Chile

12 plates of data, 2006-2026

Every figure on this page comes from a publisher that names its definition — DEIS/MINSAL for registered deaths, and the harmonised World Bank, IMF, BIS, OECD, UNDP and Transparency International layer for the rest — and every plate is regenerated from committed CSVs, so the charts and the numbers here cannot drift apart. Chile is the country where the national layer came up shortest: the Banco Central's series API is credentialled, INE delivers monthly PDFs, and Dipres, the CMF, Aduanas, the SII and SERMIG answer with HTML or walls. What is drawn is the harmonised series that republishes the Chilean one, and every panel footer says whose it is. Nothing is spliced: general and central government, two population denominators, survey and register, customs and balance of payments.

Where things stand

The plates

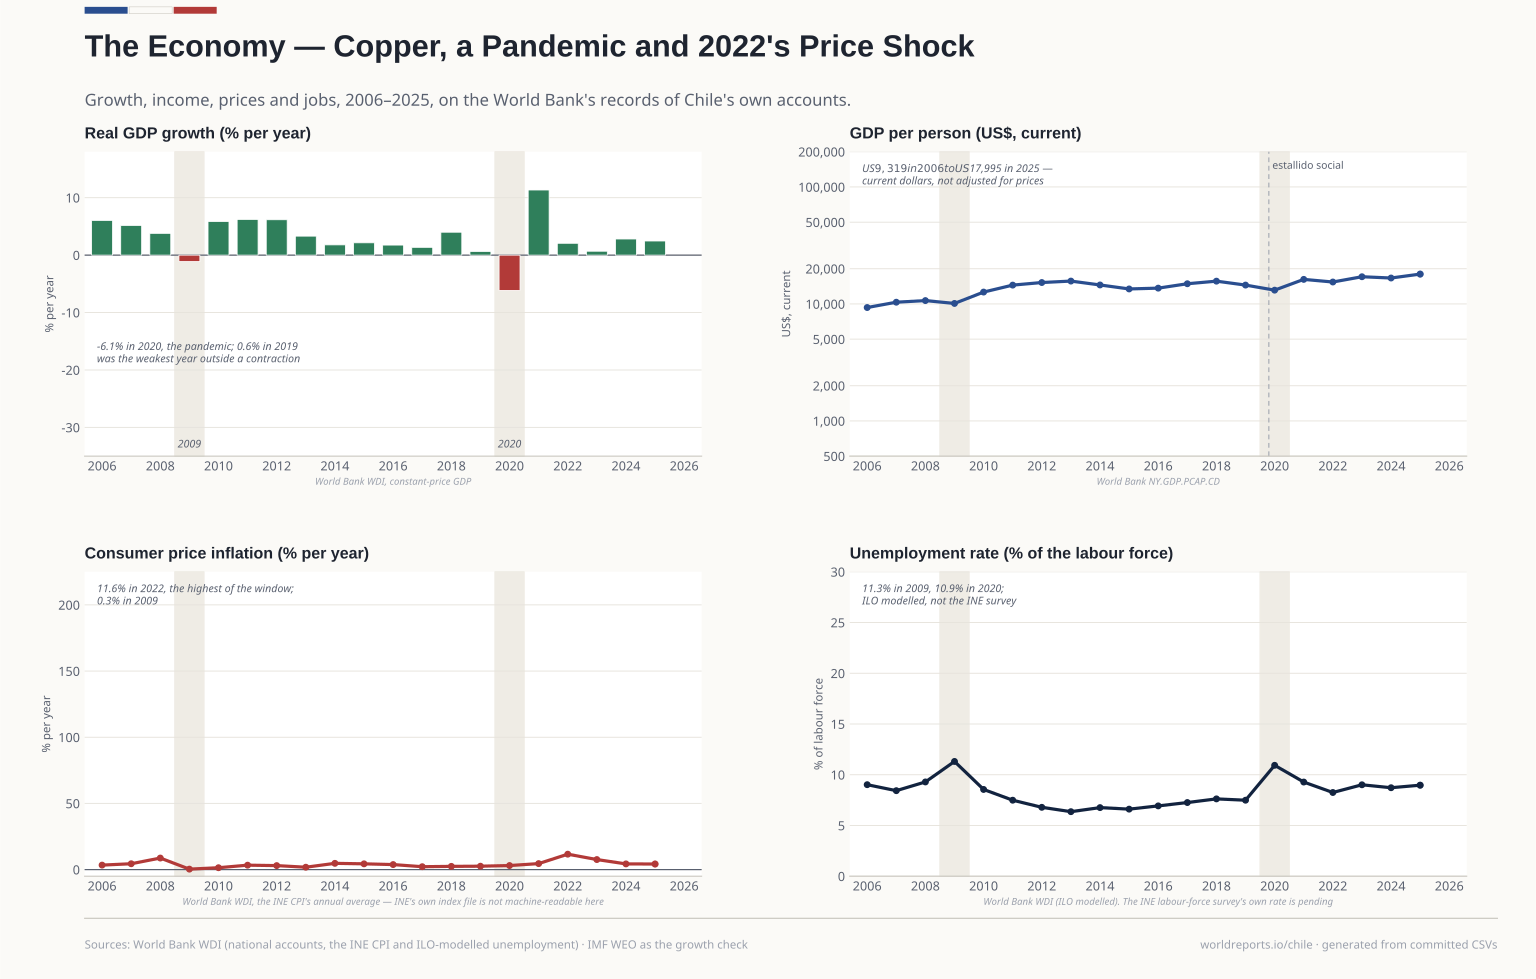
  1. Four panels for 2006–2025. Real GDP fell 6.1% in 2020 and rebounded 11.3% in 2021; inflation reached 11.6% in 2022, the highest of the window, and modelled unemployment peaked at 11.3% in 2009. GDP per person went from US$9,319 to US$17,995 in current dollars — a nominal level, not disposable income. Plate 01

    The Economy

    Growth, income, prices and jobs from the World Bank series that republish Chile's accounts, the INE's CPI and the ILO-modelled unemployment rate.

    View full size Download vector (SVG)
    Drawn from · 2

    The committed files this plate was read from, as recorded while it was drawn.

    • macro/economy.csvWorld Bank WDI — NY.GDP.MKTP.KD.ZG (growth), FP.CPI.TOTL.ZG (CPI), SL.UEM.TOTL.ZS (unemployment), NE.GDI.FTOT.ZS (GFCF) · 2006-2025
    • world/world.csvWorld Bank WDI — NY.GDP.MKTP.CD (GDP), NY.GDP.PCAP.CD (per person), FI.RES.TOTL.CD (reserves); UNDP HDR 2025 composite series (HDI); Transparency International CPI 2025 workbook (score) · 2006-2025
    20062025
    +2.5% Real growth 2025
    4.2% Inflation 2025
    9.0% Unemployment 2025
    17,995 GDP per person latest
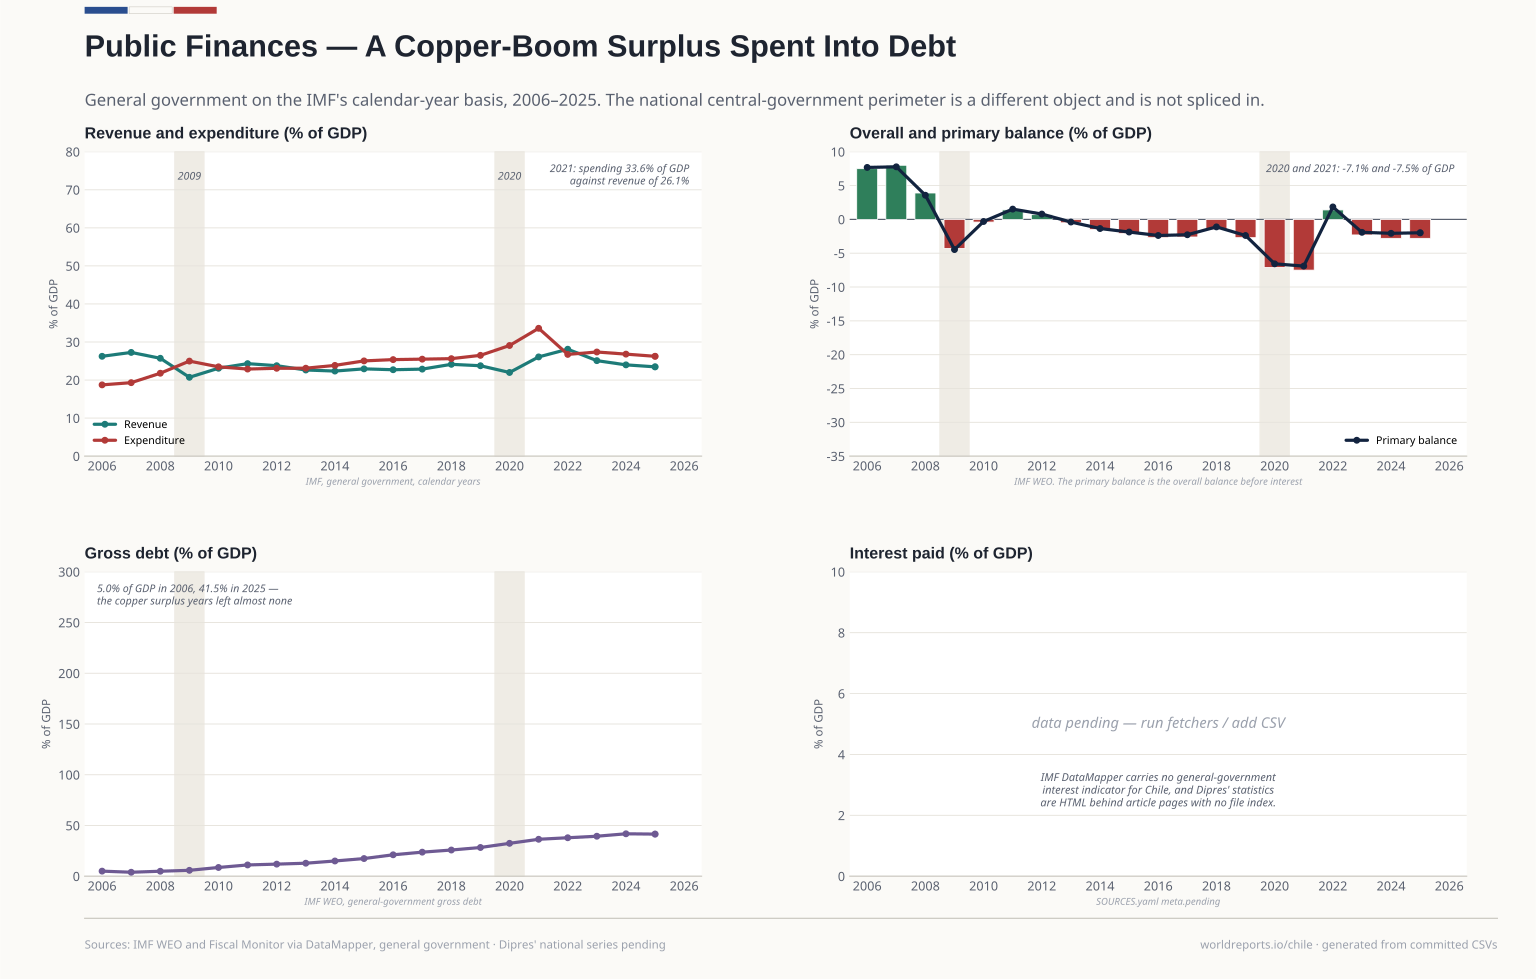
  2. The copper surplus (+7.5% of GDP in 2006) was spent: the balance reached -7.5% in 2021 and gross debt rose from 5% of GDP in 2006 to 41.5% in 2025. Interest paid stays pending: no general-government indicator sits on an accessible official route. Plate 02

    Public Finances

    General government, calendar years, from one IMF vintage: revenue and spending from the Fiscal Monitor, the balance and debt from the WEO.

    View full size Download vector (SVG)
    Drawn from · 1

    The committed files this plate was read from, as recorded while it was drawn.

    • fiscal/fiscal.csvIMF — World Economic Outlook and Fiscal Monitor via DataMapper (GGR_G01_GDP_PT, G_X_G01_GDP_PT, GGXONLB_G01_GDP_PT, GGXCNL_NGDP, GGXWDG_NGDP) · 2006-2025
    20062025
    23.5% GDP Revenue 2025
    26.2% GDP Spending 2025
    -2.8% Overall balance 2025
    41.5% GDP Gross debt latest
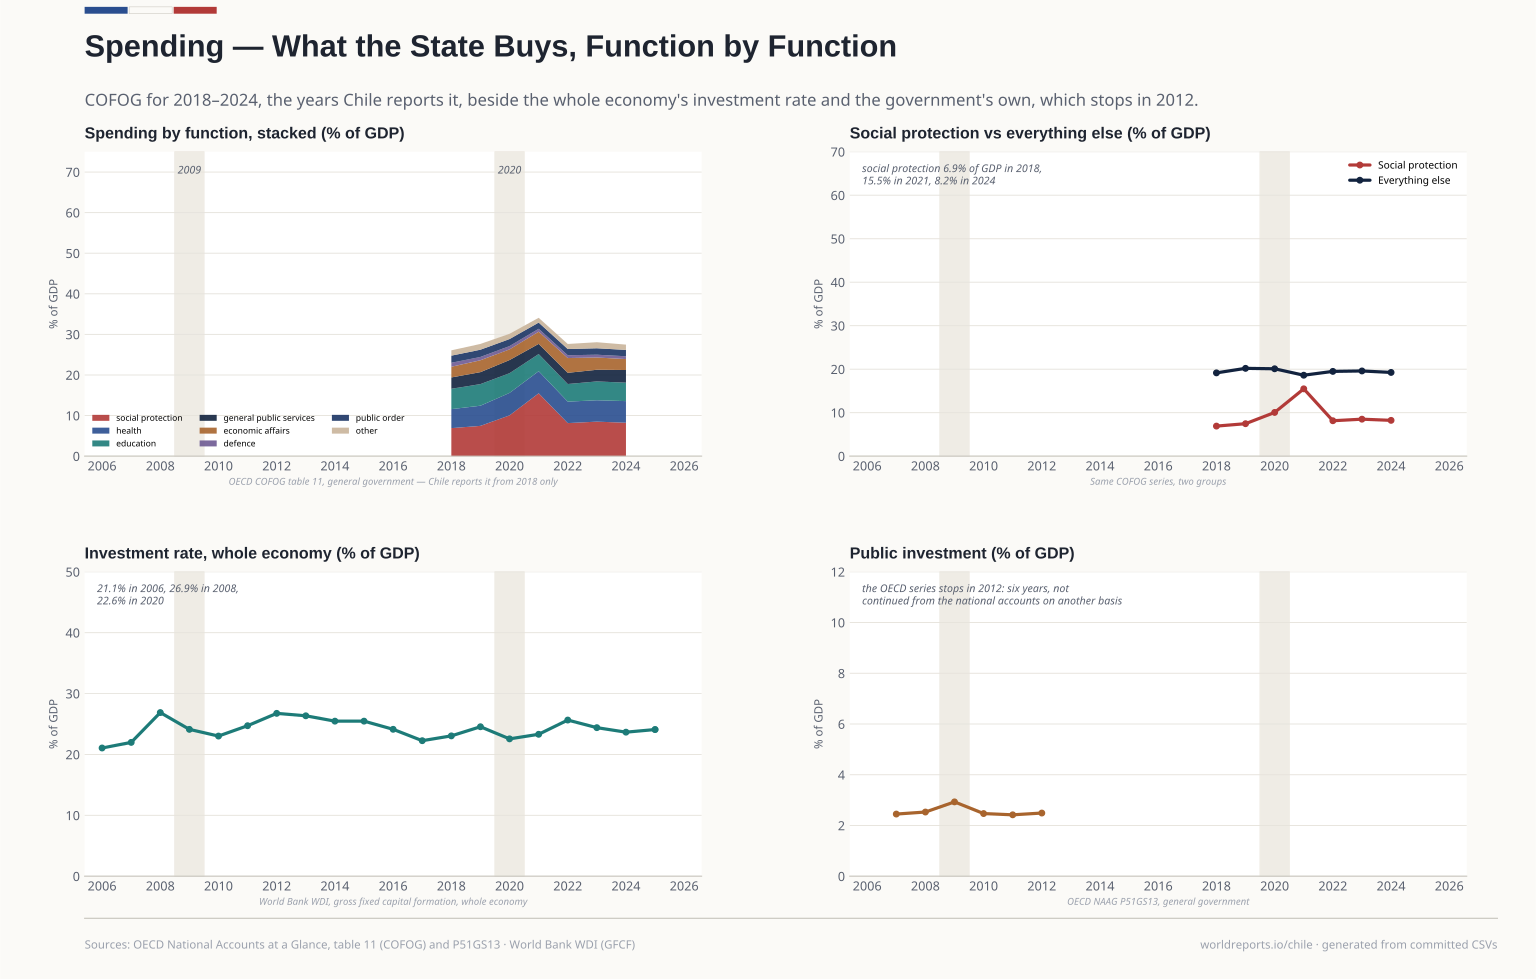
  3. Total spending reached 34.1% of GDP in 2021, when social protection alone took 15.5% (6.9% in 2018). Whole-economy investment ran between 21.1% and 26.9% of GDP; public investment exists only for 2007–2012, at 2.4% to 2.9%. Plate 03

    Spending

    The functional classification (COFOG) Chile reports to the OECD from 2018, beside the whole economy's investment rate and the government's own, whose series stopped in 2012.

    View full size Download vector (SVG)
    Drawn from · 3

    The committed files this plate was read from, as recorded while it was drawn.

    • macro/economy.csvWorld Bank WDI — NY.GDP.MKTP.KD.ZG (growth), FP.CPI.TOTL.ZG (CPI), SL.UEM.TOTL.ZS (unemployment), NE.GDI.FTOT.ZS (GFCF) · 2006-2025
    • spending/cofog.csvOECD — National Accounts at a Glance, table 11 (COFOG), general government · 2018-2024
    • spending/public_investment.csvOECD — National Accounts at a Glance P51GS13 (general government gross fixed capital formation) · 2007-2012
    20182024
    27.5% GDP Total spending 2024
    8.2% GDP Social protection 2024
    24.1% GDP Whole-economy investment 2025
    2.5% GDP Public investment 2012
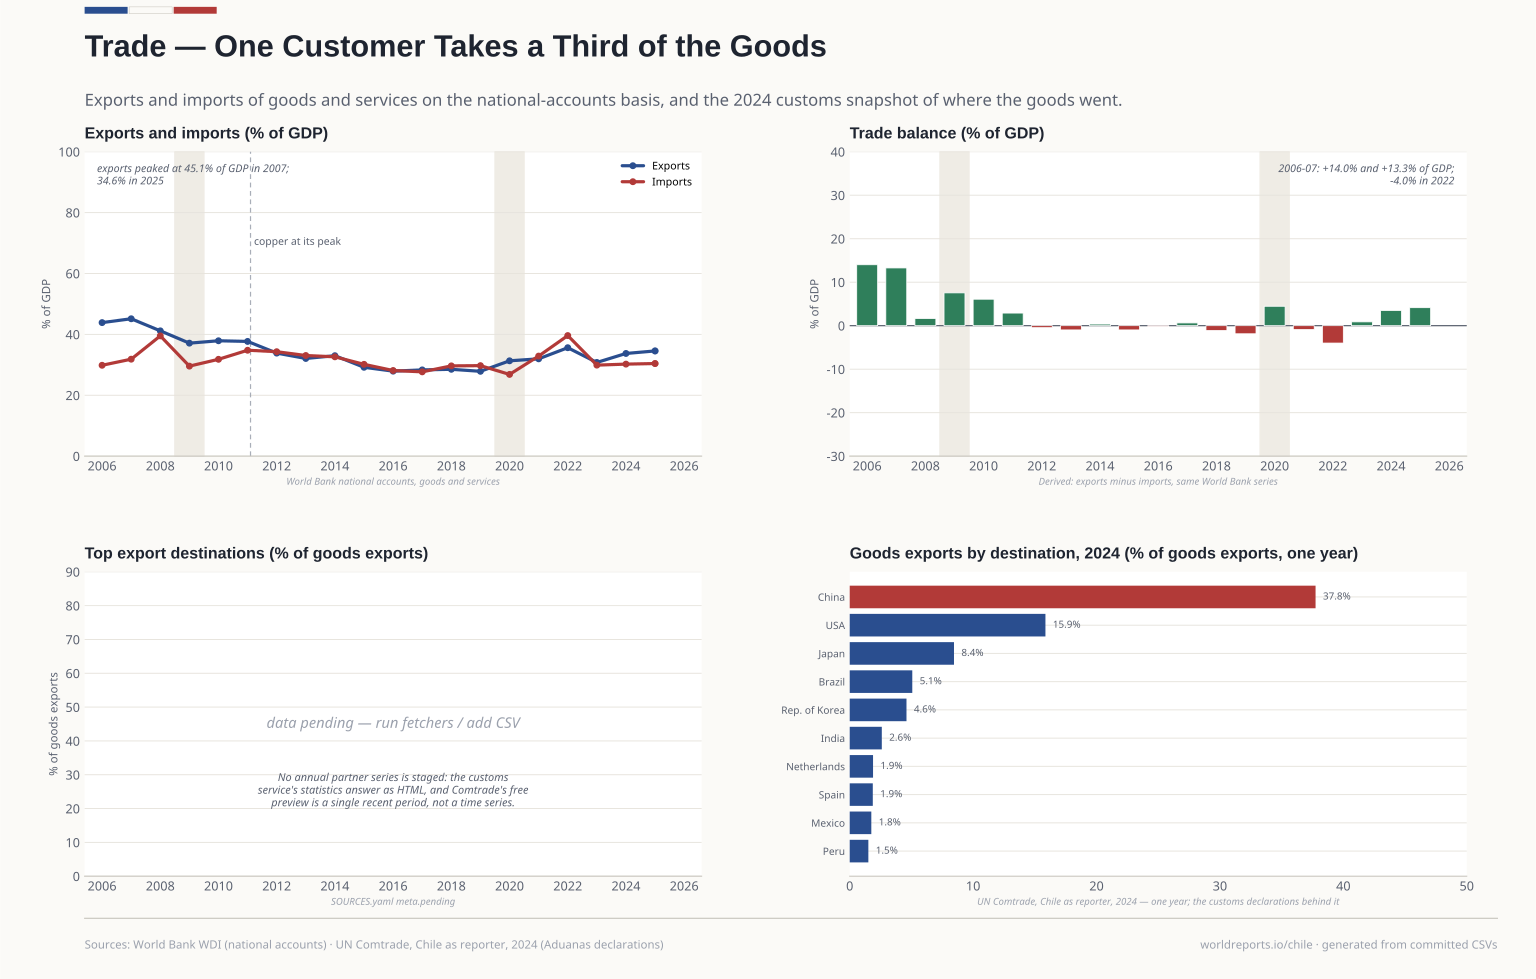
  4. Exports fell from 45.1% of GDP in 2007 to 34.6% in 2025 and the balance went from +14.0% to -4.0% in 2022. In 2024 China took 37.8% of goods exported, the United States 15.9% and Japan 8.4% — one year, not a series. Plate 04

    Trade

    Goods and services exports and imports on the national-accounts basis, plus the 2024 customs snapshot by destination.

    View full size Download vector (SVG)
    Drawn from · 2

    The committed files this plate was read from, as recorded while it was drawn.

    • trade/partners_2024.csvUN Comtrade — Chile goods exports by partner, calendar 2024 (HS, TOTAL, flow exports; declarations of the Servicio Nacional de Aduanas) · —
    • trade/trade.csvWorld Bank WDI — NE.EXP.GNFS.ZS, NE.IMP.GNFS.ZS (exports and imports of goods and services, % of GDP) · 2006-2025
    20062025
    34.6% GDP Exports 2025
    30.4% GDP Imports 2025
    +4.1% Trade balance 2025
    37.8% Top goods destination (37.8%) latest
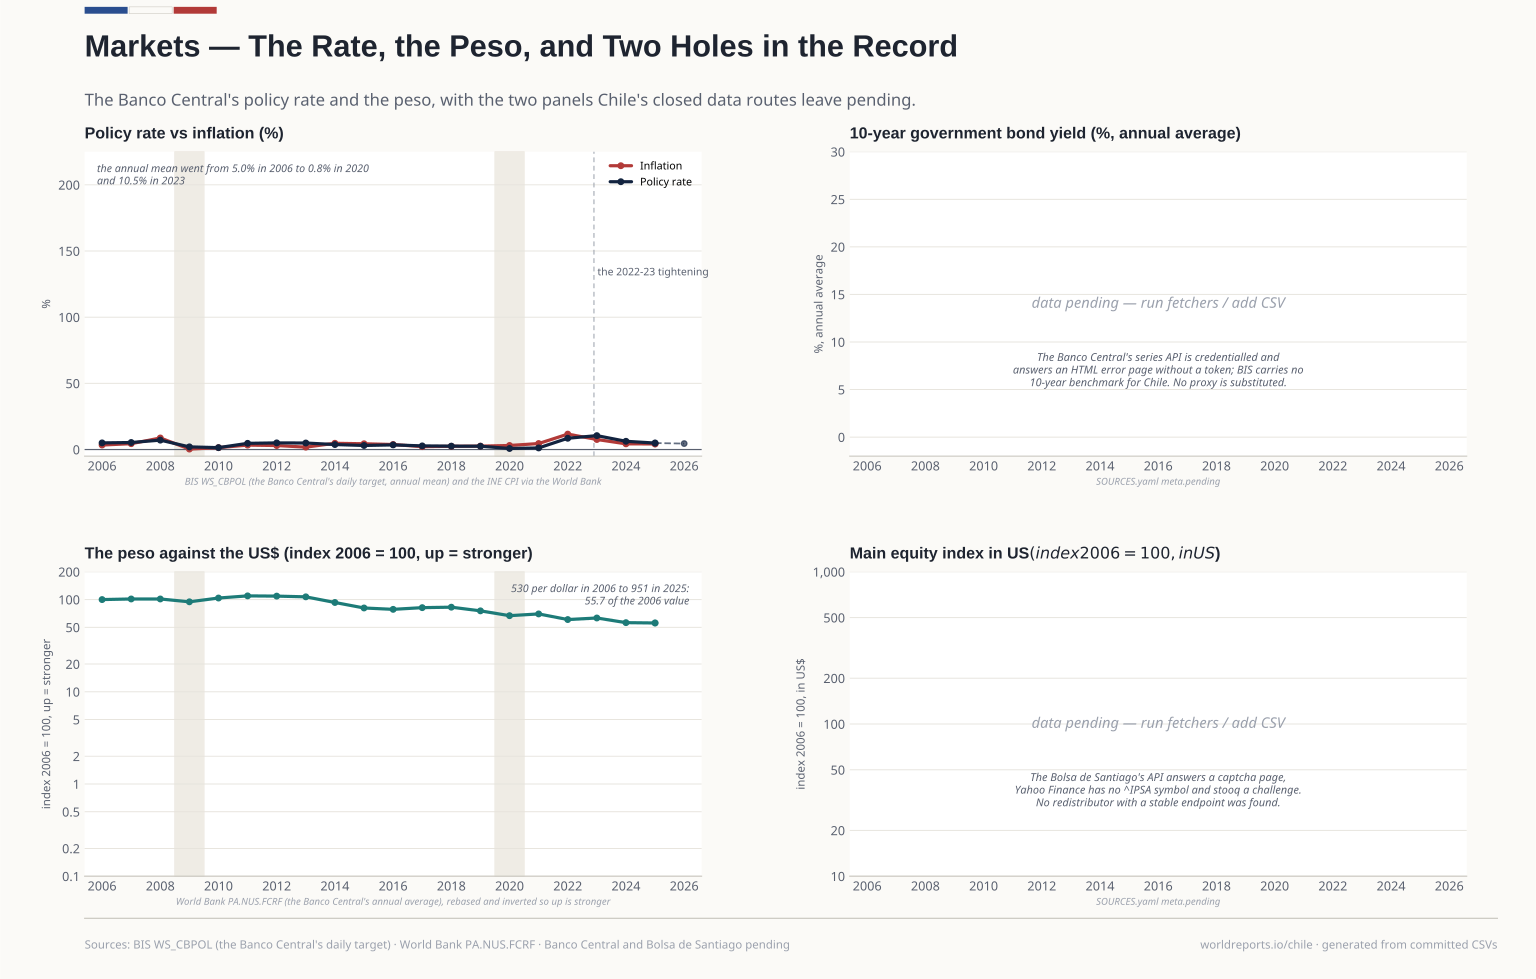
  5. The rate averaged 5.0% in 2006, 0.8% in 2020 and 10.5% in 2023; the peso went from 530 to 951 per dollar and keeps 56 of its 2006 value on the index. The two pending panels are not replaced by a proxy. Plate 05

    Markets

    The Banco Central's policy rate and the peso against the dollar; the 10-year yield and the IPSA stay pending behind closed routes.

    View full size Download vector (SVG)
    Drawn from · 3

    The committed files this plate was read from, as recorded while it was drawn.

    • macro/economy.csvWorld Bank WDI — NY.GDP.MKTP.KD.ZG (growth), FP.CPI.TOTL.ZG (CPI), SL.UEM.TOTL.ZS (unemployment), NE.GDI.FTOT.ZS (GFCF) · 2006-2025
    • macro/fx.csvWorld Bank WDI — PA.NUS.FCRF (official exchange rate, annual average) · 2006-2025
    • markets/policy_rate.csvBIS — WS_CBPOL D.CL (daily monetary policy rate, the Banco Central de Chile's own series) · 2006-2026
    20062025
    4.9% Policy rate 2025
    4.2% Inflation 2025
    56 Peso against the dollar (2006 = 100) latest
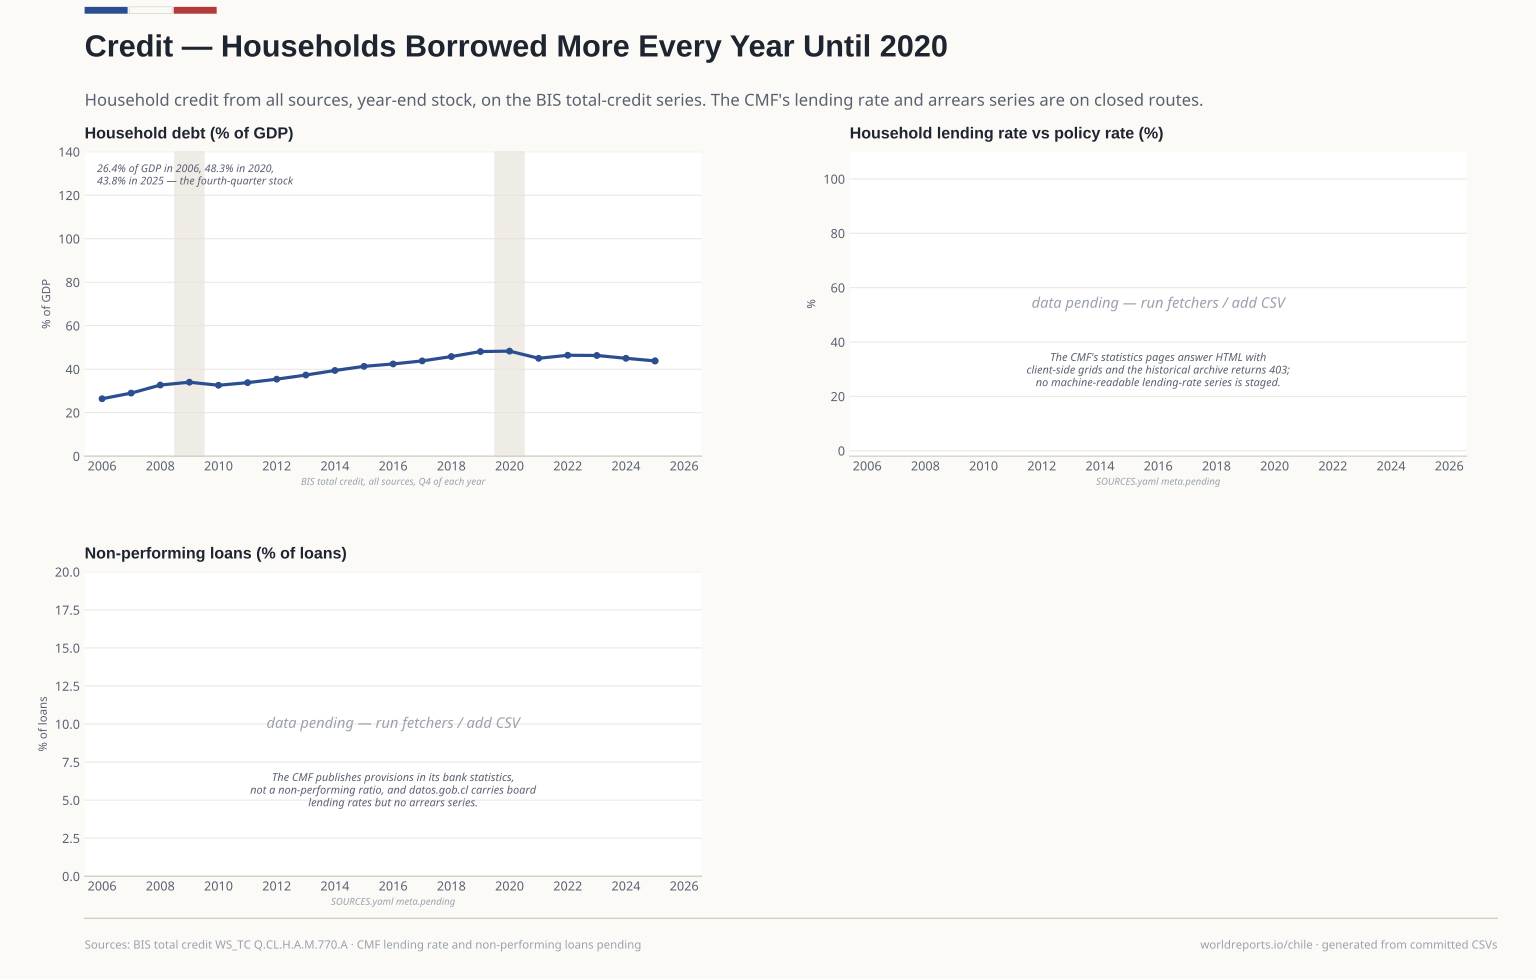
  6. Household debt rose from 26.4% of GDP at the end of 2006 to a peak of 48.3% in 2020 and fell to 43.8% in 2025. The lending rate and the arrears ratio stay pending: the CMF's statistics are HTML or behind a 403. Plate 06

    Credit

    Household debt from all sources, the year-end stock, on the BIS total-credit series.

    View full size Download vector (SVG)
    Drawn from · 1

    The committed files this plate was read from, as recorded while it was drawn.

    20062025
    43.8% GDP Household debt latest
    48.3% GDP Peak, 2020 latest
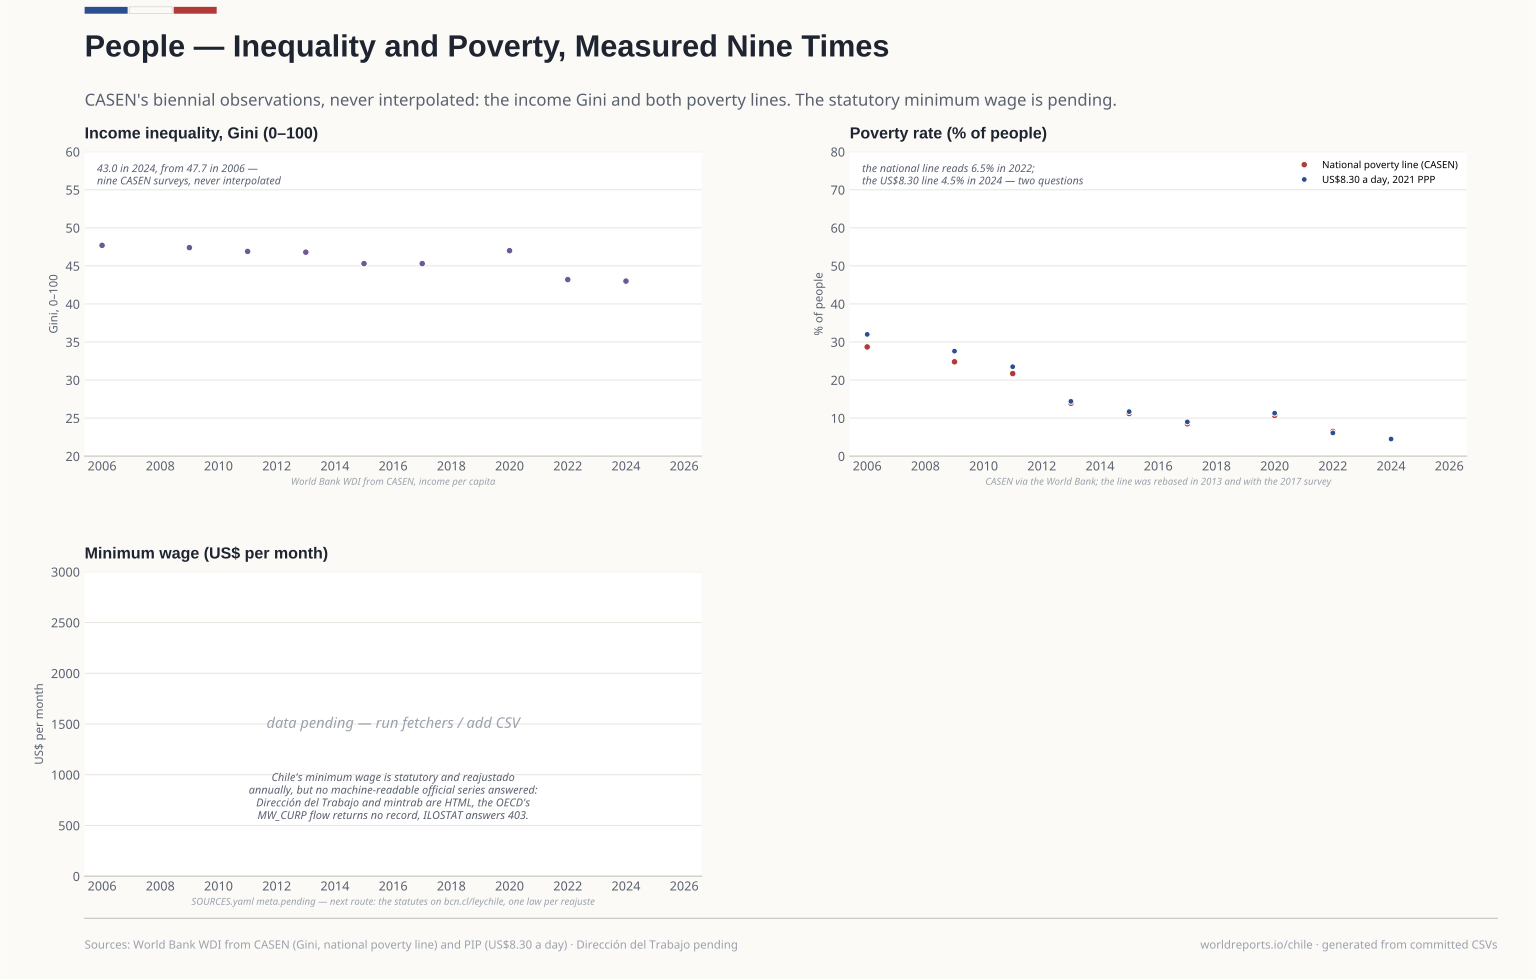
  7. The Gini fell from 47.7 in 2006 to 43.0 in 2024, with a rise to 47.0 in 2020. Poverty on the national line fell from 28.7% to 6.5% (2022) and the US$8.30-a-day line reads 4.5% in 2024 — different questions. The minimum wage stays pending, and the next route is the statutes on bcn.cl. Plate 07

    People

    The CASEN survey, which is not annual: the income Gini and both poverty lines are drawn as observations, never interpolated.

    View full size Download vector (SVG)
    Drawn from · 2

    The committed files this plate was read from, as recorded while it was drawn.

    • people/gini.csvWorld Bank WDI — SI.POV.GINI (from CASEN) · 2006-2024
    • people/poverty.csvWorld Bank WDI — SI.POV.NAHC (national poverty line, CASEN) and SI.POV.UMIC (US$8.30/day, 2021 PPP, PIP) · 2006-2024
    20062024
    43.00 Gini latest
    6.5% National poverty 2022
    4.5% Poverty at US$8.30 a day 2024
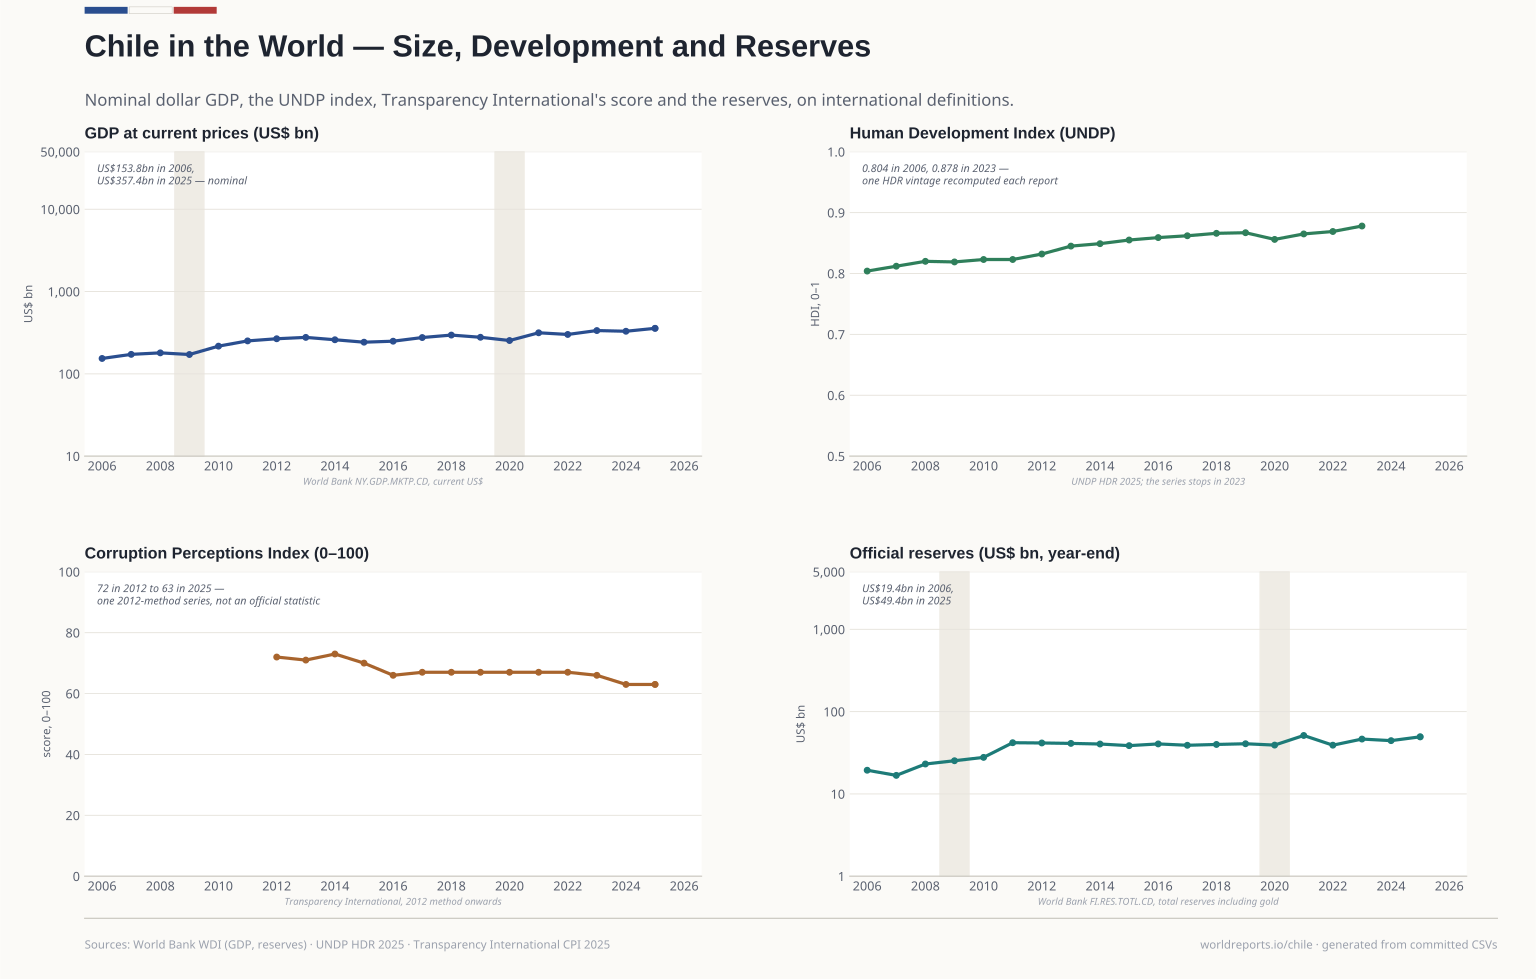
  8. Nominal GDP went from US$153.8bn in 2006 to US$357.4bn in 2025; the HDI from 0.804 to 0.878 (2023); the corruption perceptions score fell from 72 to 63 and reserves rose from US$19.4bn to US$49.4bn. Plate 08

    Chile in the World

    Size in current dollars, human development, corruption perceptions and reserves, on international definitions.

    View full size Download vector (SVG)
    Drawn from · 1

    The committed files this plate was read from, as recorded while it was drawn.

    • world/world.csvWorld Bank WDI — NY.GDP.MKTP.CD (GDP), NY.GDP.PCAP.CD (per person), FI.RES.TOTL.CD (reserves); UNDP HDR 2025 composite series (HDI); Transparency International CPI 2025 workbook (score) · 2006-2025
    20062025
    US$ 357bn Nominal GDP latest
    0.878 HDI latest
    63/100 Corruption perceptions latest
    US$ 49bn Reserves latest
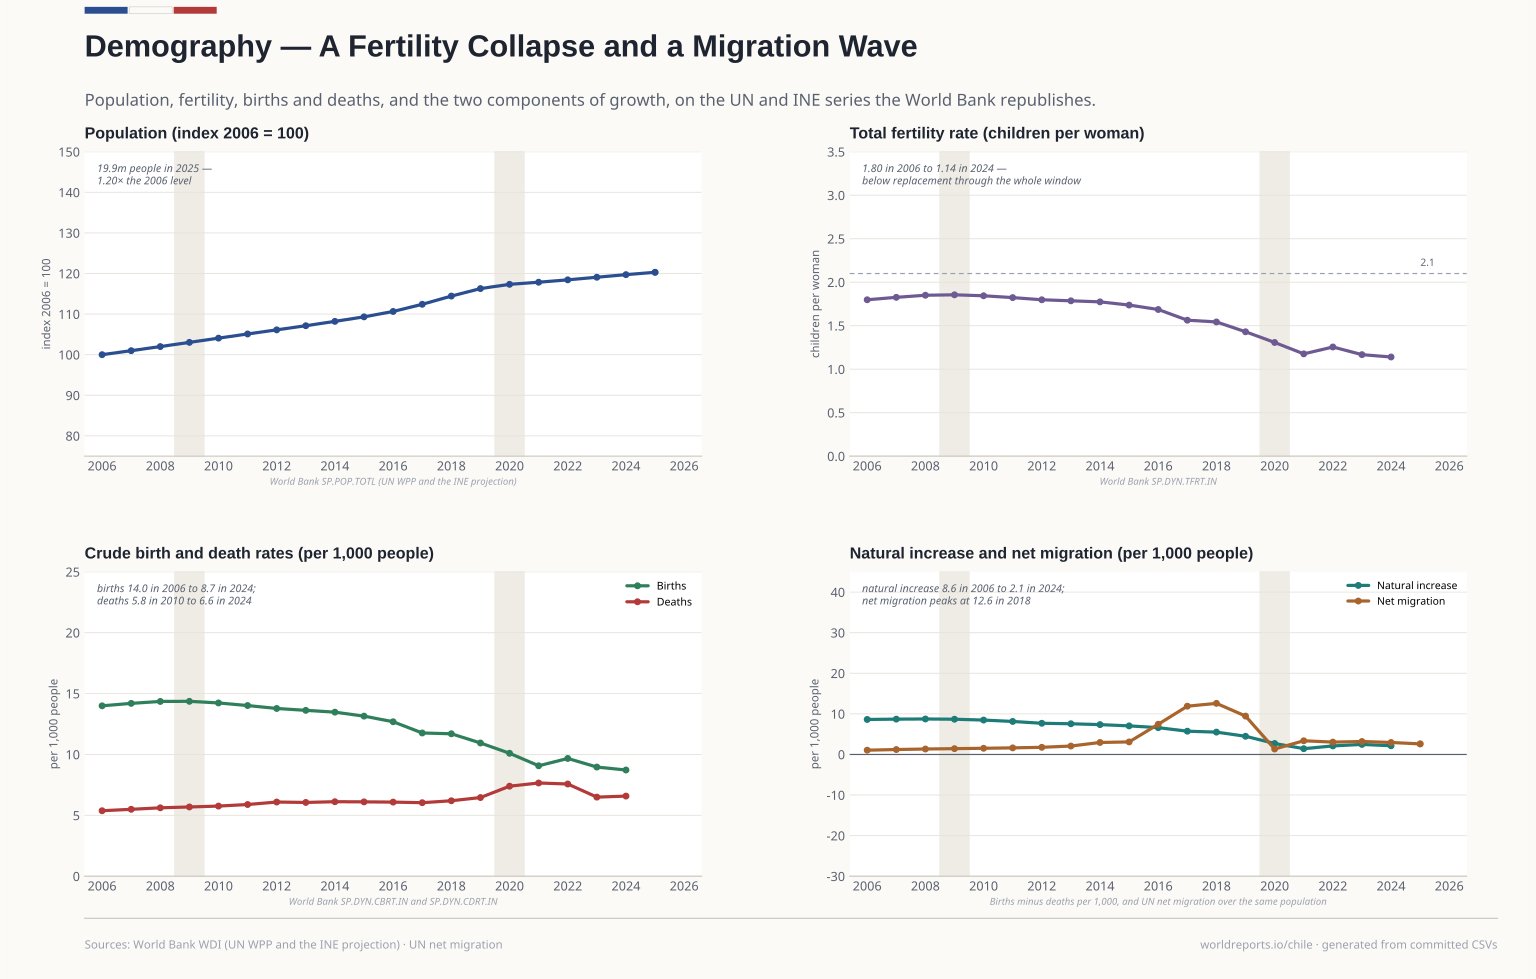
  9. Population grew 20% over the window, to 19.9 million in 2025. Fertility fell from 1.80 to 1.14 children per woman and stayed below replacement throughout; births fell from 14.0 to 8.7 per 1,000 while deaths rose from 5.8 (2010) to 7.7 (2021). Natural increase fell to 2.1 per 1,000 and net migration peaked at 12.6 in 2018. Plate 09

    Demography

    Population, fertility, births and deaths, and the two components of growth, on the UN and INE series the World Bank republishes.

    View full size Download vector (SVG)
    Drawn from · 2

    The committed files this plate was read from, as recorded while it was drawn.

    • demography/demography.csvWorld Bank WDI — SP.POP.TOTL, SP.POP.TOTL.FE.IN, SP.DYN.TFRT.IN, SP.DYN.CBRT.IN, SP.DYN.CDRT.IN (UN WPP and INE) · 2006-2025
    • migration/migration.csvWorld Bank WDI — SM.POP.NETM (UN WPP net migration) and SM.POP.TOTL (UN international migrant stock) · 2006-2025
    20062025
    19,860bn Population latest
    1.14 Fertility 2024
    8.72 Births per 1,000 2024
    2.60 Net migration per 1,000 2025
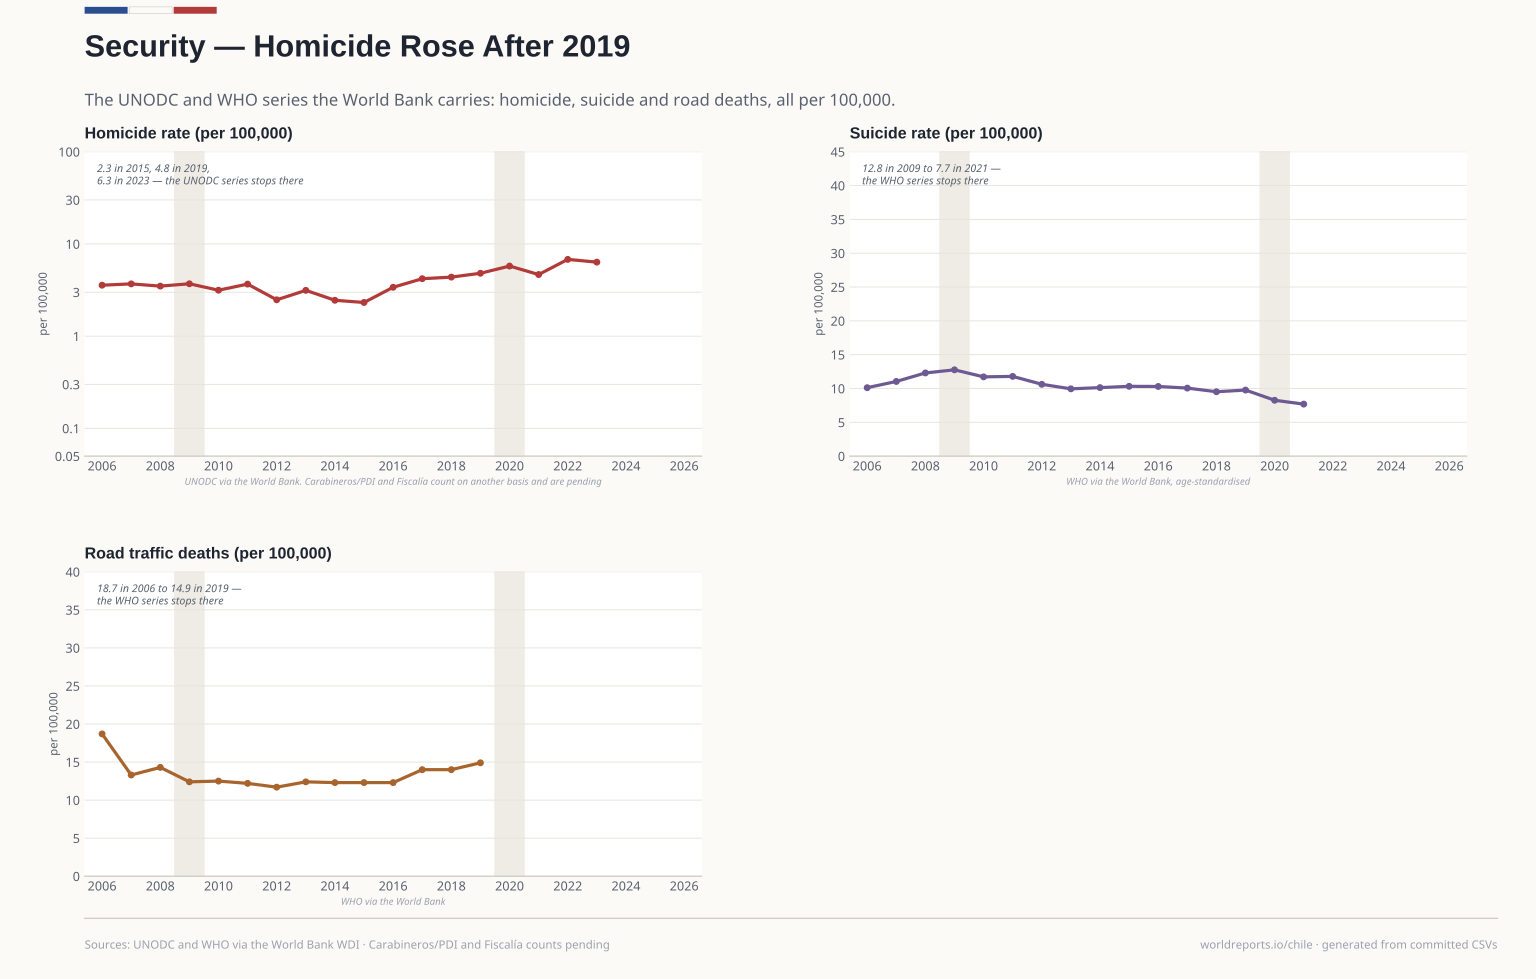
  10. The homicide rate bottomed at 2.3 in 2015 and rose to 4.8 in 2019 and 6.8 in 2022, before 6.4 in 2023 where UNODC stops. Suicide fell from 12.8 (2009) to 7.7 (2021) and road deaths from 18.7 (2006) to 14.9 (2019). The Carabineros and Fiscalía count is another basis and is pending. Plate 10

    Security

    Homicide, suicide and road deaths: the UNODC and WHO series the World Bank carries, all per 100,000 people.

    View full size Download vector (SVG)
    Drawn from · 1

    The committed files this plate was read from, as recorded while it was drawn.

    • security/security.csvWorld Bank WDI — VC.IHR.PSRC.P5 (UNODC homicide), SH.STA.SUIC.P5 (WHO suicide), SH.STA.TRAF.P5 (WHO road deaths) · 2006-2023
    20062023
    6.35/100k Homicide latest
    7.69/100k Suicide latest
    14.90/100k Road deaths latest
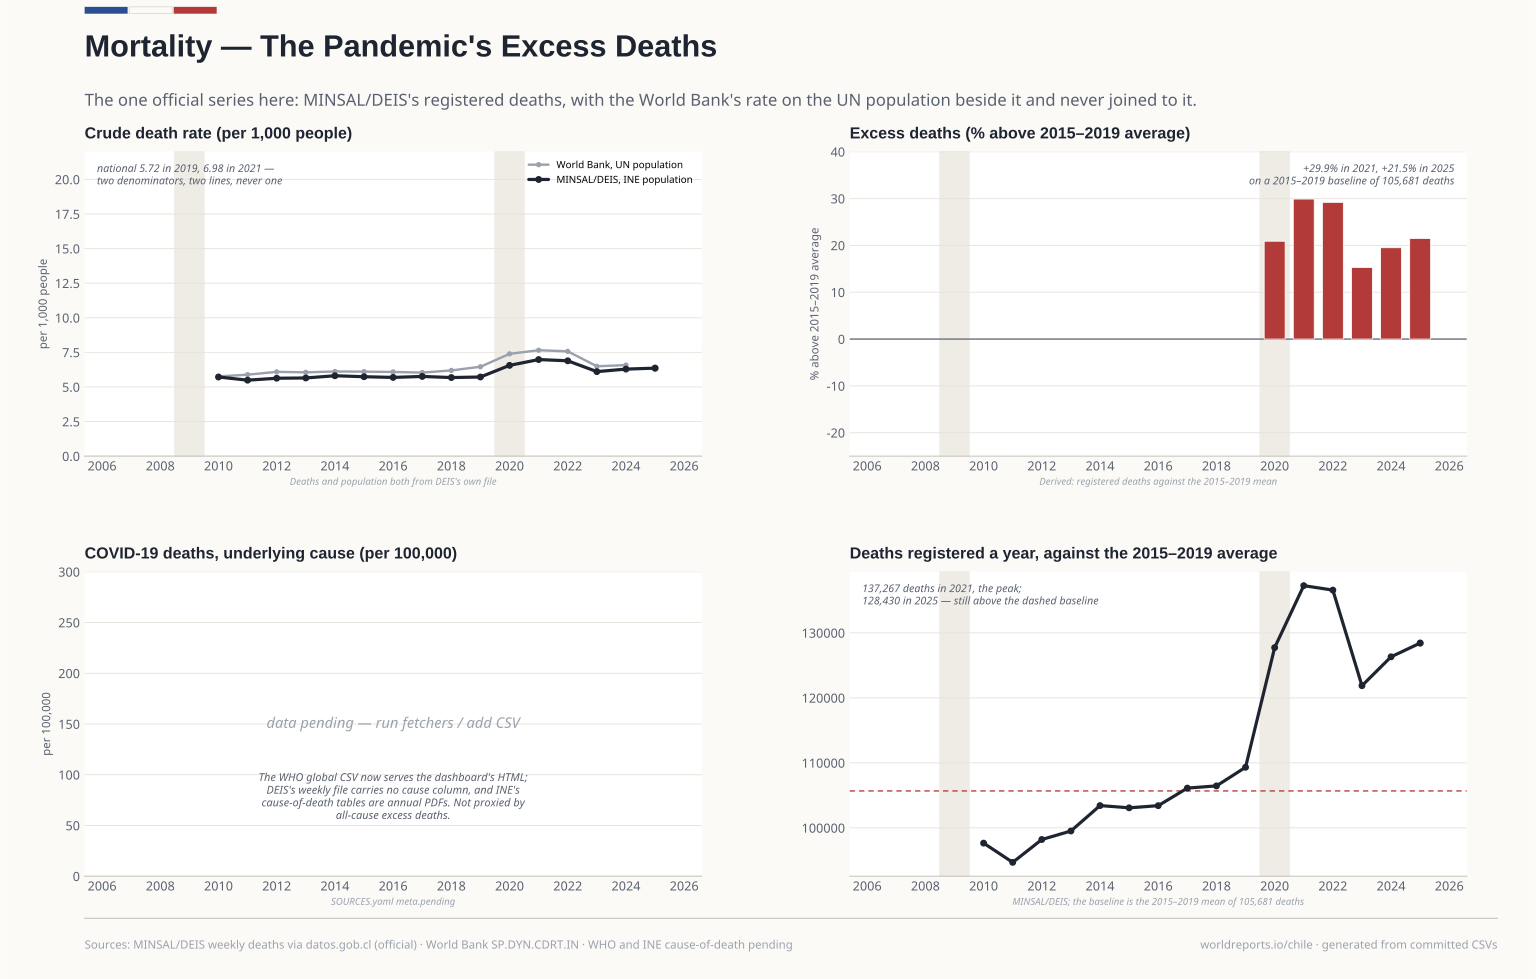
  11. The national rate was 5.72 per 1,000 in 2019 and 6.98 in 2021; registered deaths ran 29.9% above the 2015–2019 average in 2021 and 21.5% in 2025. The fourth panel counts 137,267 deaths in 2021 against a baseline of 105,681. COVID-19 as an underlying cause stays pending. Plate 11

    Mortality

    The one official series in this layer: deaths registered by DEIS/MINSAL, with the World Bank's rate on the UN population beside it and never joined to it.

    View full size Download vector (SVG)
    Drawn from · 1

    The committed files this plate was read from, as recorded while it was drawn.

    • mortality/mortality.csvMINSAL/DEIS — registered deaths by epidemiological week (datos.gob.cl), summed to the year; World Bank SP.DYN.CDRT.IN for the comparison rate · 2010-2025
    20102025
    6.36 National death rate 2025
    +21.5% Excess over 2015–2019 latest
    128,430 Registered deaths 2025
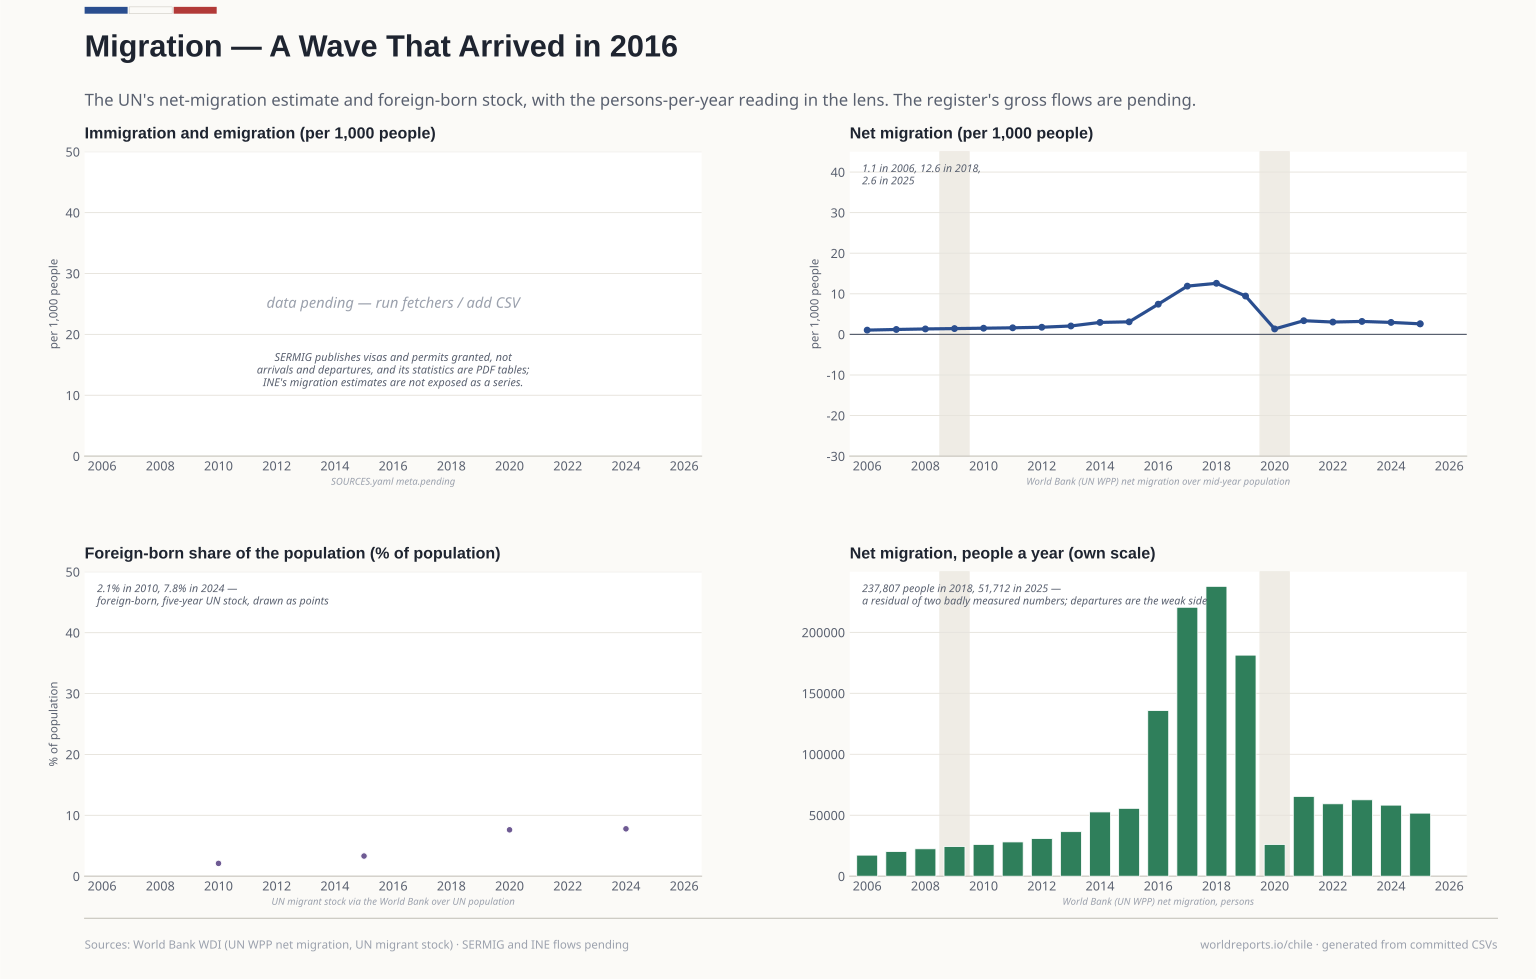
  12. Net migration rose from 1.1 per 1,000 in 2006 to 12.6 in 2018 and 2.6 in 2025; the foreign-born share went from 2.1% (2010) to 7.8% (2024) on the five-year stock. The lens shows 237,807 people in 2018 and 26,042 in 2020. Gross immigration and emigration from the register remain pending. Plate 12

    Migration

    The UN's net-migration estimate and the foreign-born stock, with persons per year in the lens. The register's gross flows are pending.

    View full size Download vector (SVG)
    Drawn from · 2

    The committed files this plate was read from, as recorded while it was drawn.

    • demography/demography.csvWorld Bank WDI — SP.POP.TOTL, SP.POP.TOTL.FE.IN, SP.DYN.TFRT.IN, SP.DYN.CBRT.IN, SP.DYN.CDRT.IN (UN WPP and INE) · 2006-2025
    • migration/migration.csvWorld Bank WDI — SM.POP.NETM (UN WPP net migration) and SM.POP.TOTL (UN international migrant stock) · 2006-2025
    20062025
    2.60 Net migration per 1,000 2025
    7.8% Foreign-born share latest
    51,712 Net migration, persons 2025