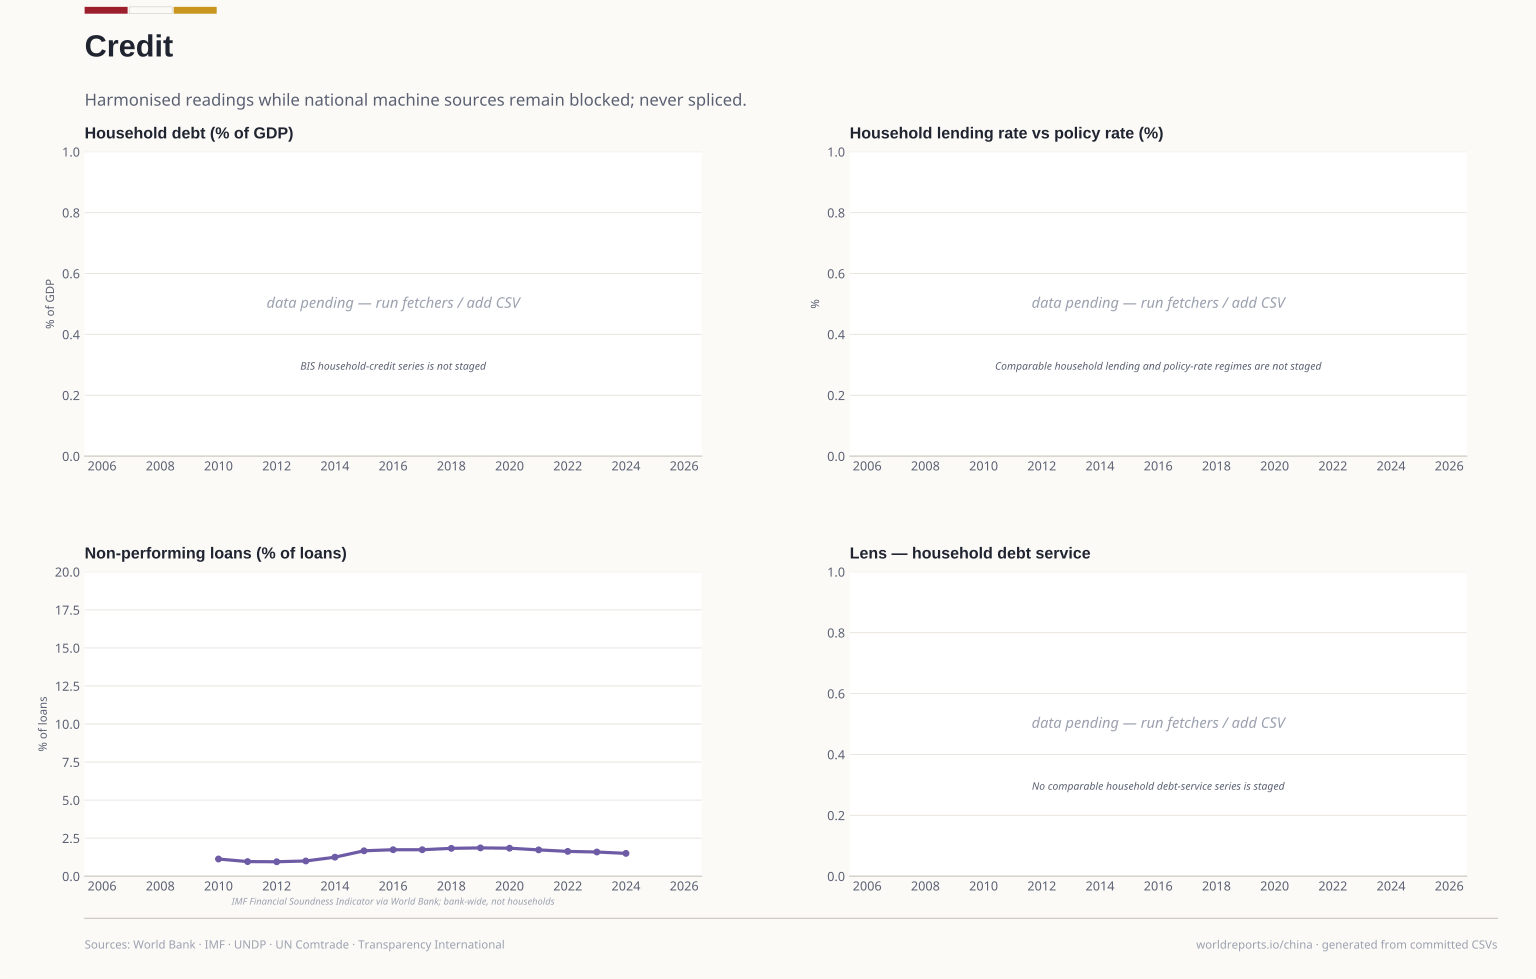
credit/npl_intl.csv | VERIFIED 2026-10-23: 2024 1.51% of gross loans, series 2010-2024. This is the regulators' reported ratio as the FSI collects it; the property crisis… | World Bank — FB.AST.NPER.ZS (IMF Financial Soundness Indicators) | 2010-2024 | Other |
|---|
credit/npl_intl_from_wb.csv | Fetcher sidecar behind npl_intl.csv; diff before adopting. | World Bank — FB.AST.NPER.ZS | 2010-2024 | Other |
|---|
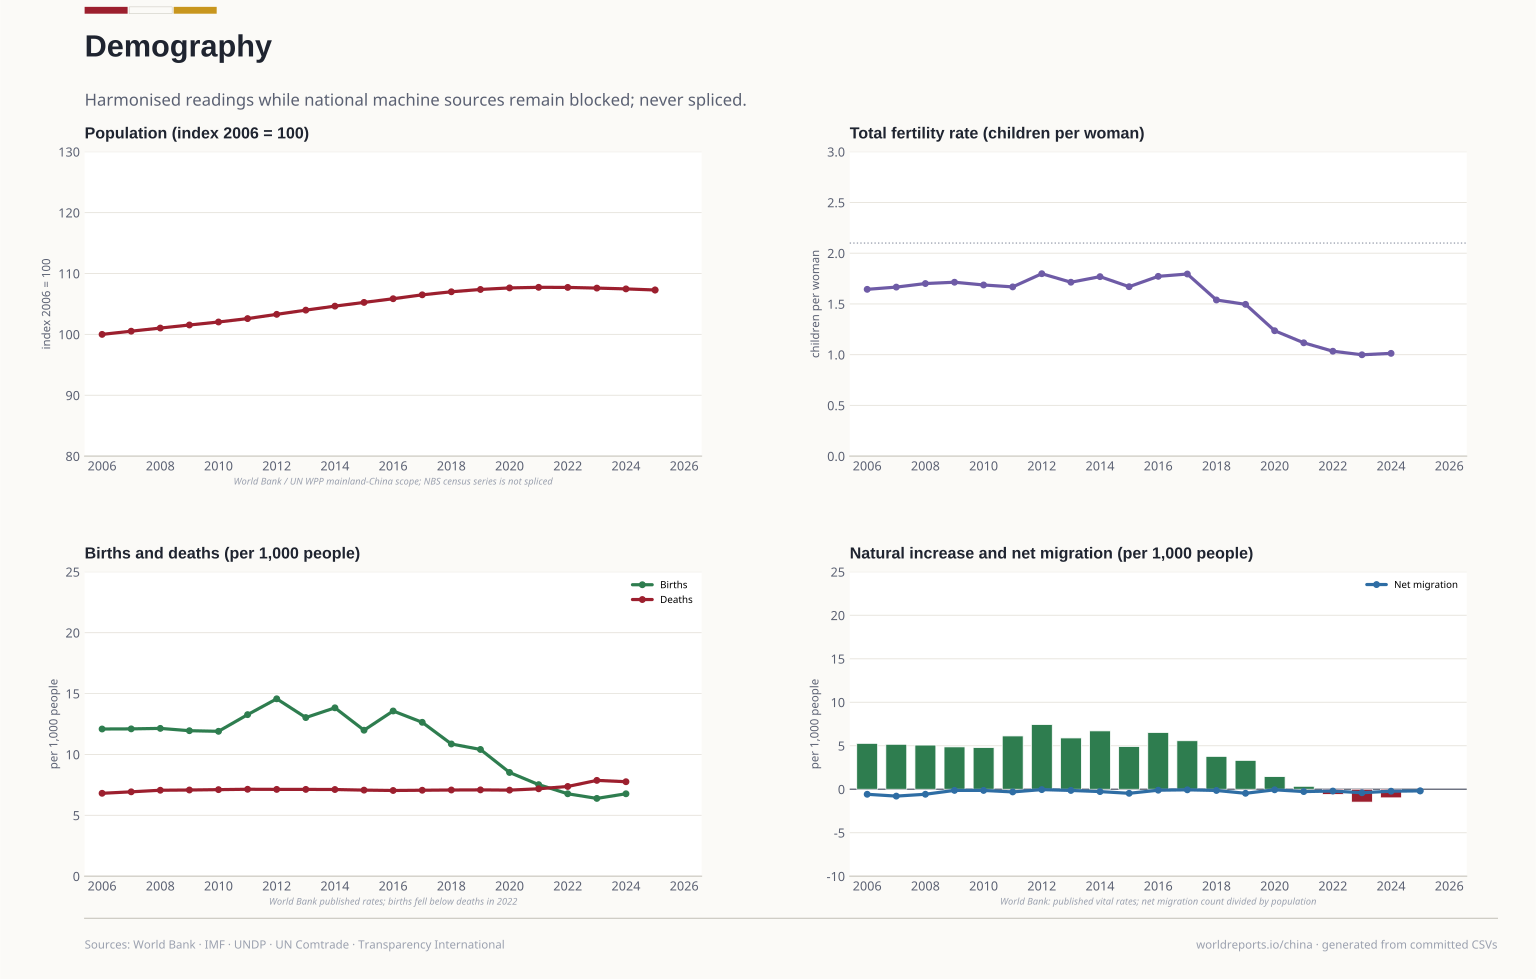
demography/population_intl.csv | VERIFIED. Peak 2022 = 1,412,175,000; 2023 1,410,710,000; 2024 1,408,975,000; 2025 1,406,585,000. Population ~1.41bn and FALLING since 2022 — the… | World Bank — SP.POP.TOTL (UN World Population Prospects) | 2006-2025 | Other |
|---|
demography/population_intl_from_wb.csv | Fetcher sidecar behind population_intl.csv; diff before adopting. | World Bank — SP.POP.TOTL | 2006-2025 | Other |
|---|
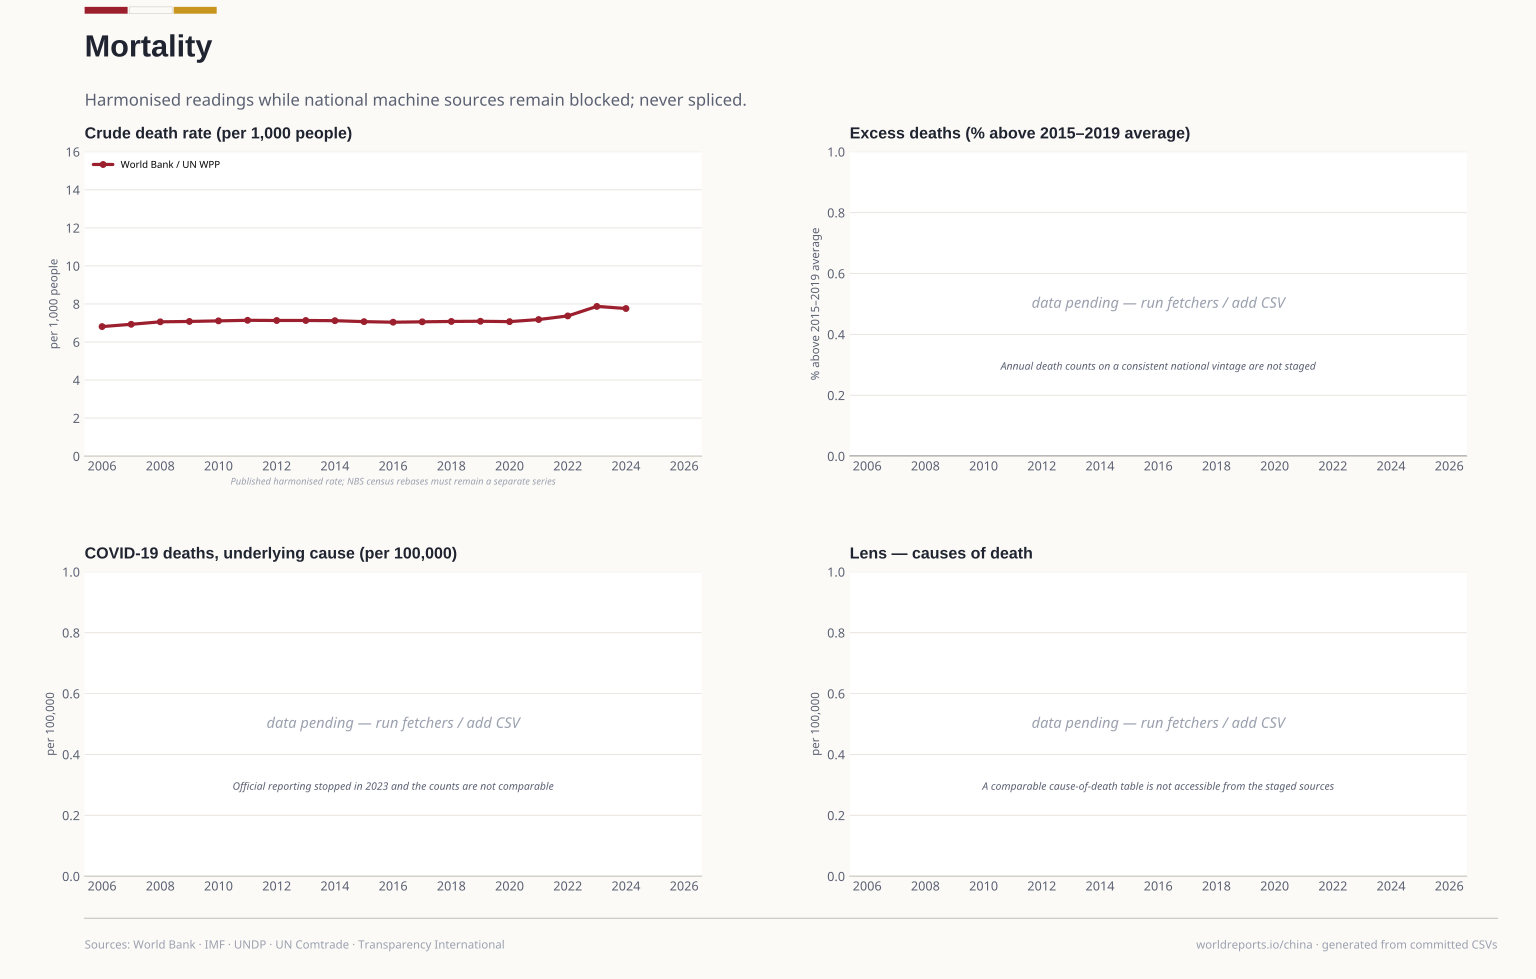
demography/vital_intl.csv | VERIFIED 2026-10-23: TFR 2023 1.00, 2024 1.01 — below replacement by a factor of two; crude birth 2024 6.77 per 1,000 vs crude death 7.76 — the two… | World Bank WDI — SP.DYN.TFRT.IN, SP.DYN.CBRT.IN, SP.DYN.CDRT.IN, SM.POP.NETM (UN WPP 2024-revision vintage) | 2006-2025 | Other |
|---|
demography/vital_intl_from_wb.csv | Fetcher sidecar behind vital_intl.csv; diff before adopting. | World Bank — SP.DYN.TFRT.IN, SP.DYN.CBRT.IN, SP.DYN.CDRT.IN, SM.POP.NETM | 2006-2025 | Other |
|---|
economy/gdp_growth_intl.csv | VERIFIED 2026-10-22 and refetched by the fetcher the same day. WB annual real growth (JSON [meta,[obs]]): 2025 4.96, 2024 4.96, 2023 5.42, 2022 3.13… | World Bank NY.GDP.MKTP.KD.ZG + IMF DataMapper NGDP_RPCH (ISO3=CHN) | 2006-2025 | Other |
|---|
economy/gdp_growth_intl_from_imf.csv | Fetcher sidecar behind gdp_growth_intl.csv; diff before adopting. | IMF DataMapper — NGDP_RPCH (WEO, outturn years only; WEO projections beyond 2025 are never cached as data) | 2006-2025 | Other |
|---|
economy/gdp_growth_intl_from_wb.csv | Fetcher sidecar behind gdp_growth_intl.csv; diff before adopting. | World Bank — NY.GDP.MKTP.KD.ZG | 2006-2025 | Other |
|---|
economy/gdp_pc_usd.csv | VERIFIED. 2025 = US$13,861.97 per person (current US$, harmonised). | World Bank — NY.GDP.PCAP.CD | 2006-2025 | Other |
|---|
economy/gdp_pc_usd_from_wb.csv | Fetcher sidecar behind gdp_pc_usd.csv; diff before adopting. | World Bank — NY.GDP.PCAP.CD | 2006-2025 | Other |
|---|
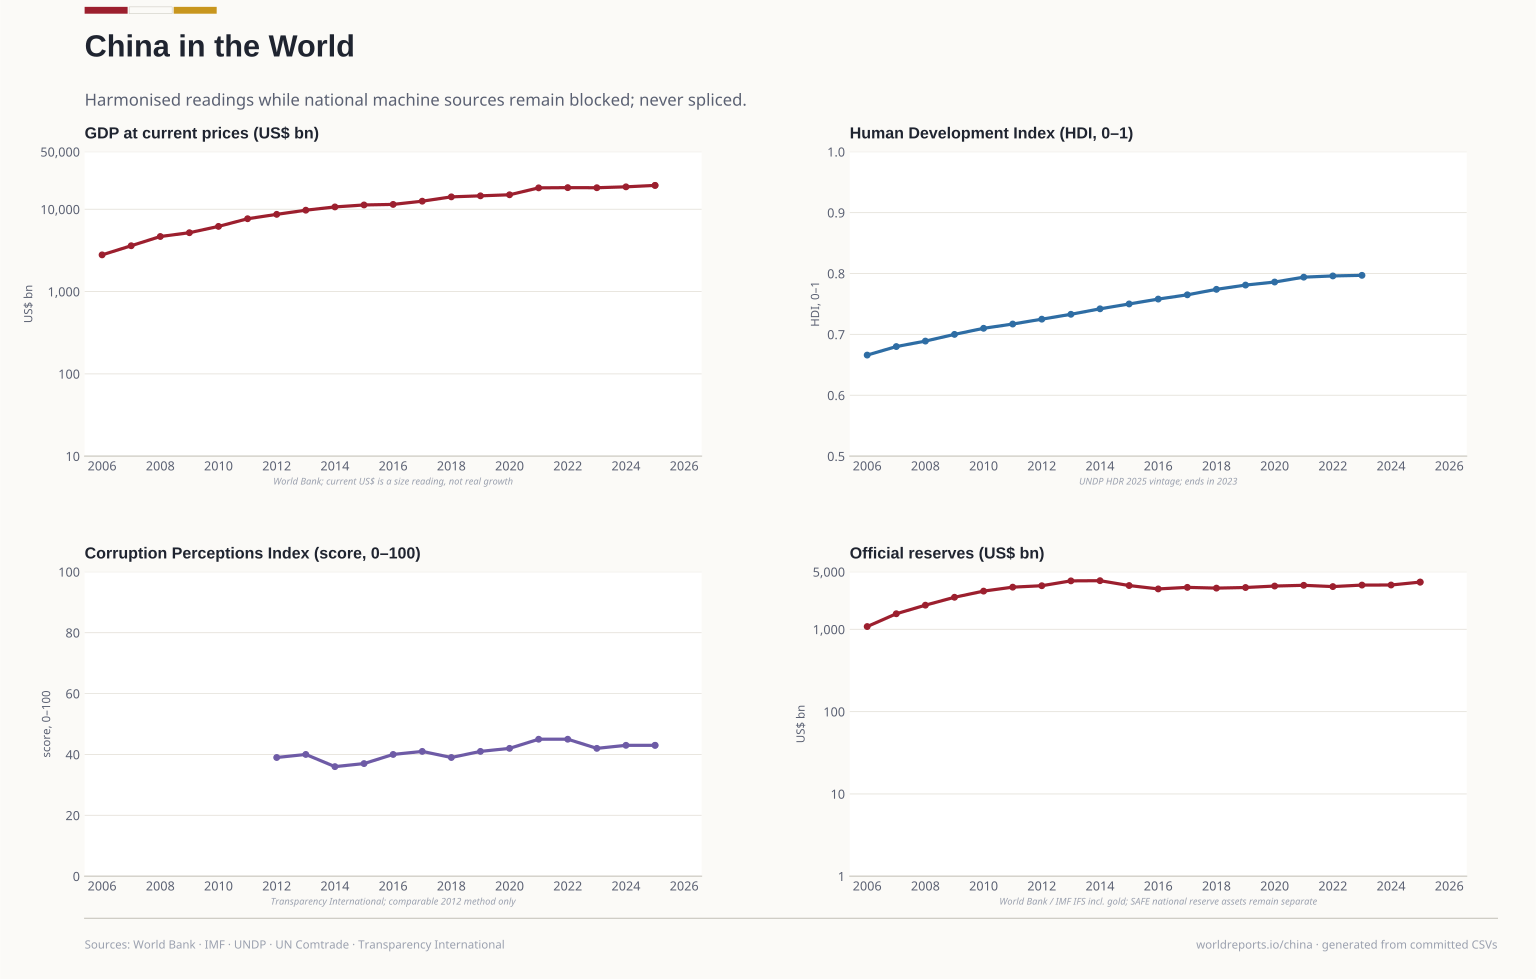
economy/gdp_usd.csv | VERIFIED. Current US$: 2025 19,498,039,388,042.6 (US$19.50tn), 2024 18,729,668,435,848, 2023 18,270,356,654,533, 2022 18,316,765,021,690, 2021… | World Bank — NY.GDP.MKTP.CD (ISO3=CHN) | 2006-2025 | Other |
|---|
economy/gdp_usd_from_wb.csv | Fetcher sidecar behind gdp_usd.csv; diff before adopting. | World Bank — NY.GDP.MKTP.CD | 2006-2025 | Other |
|---|
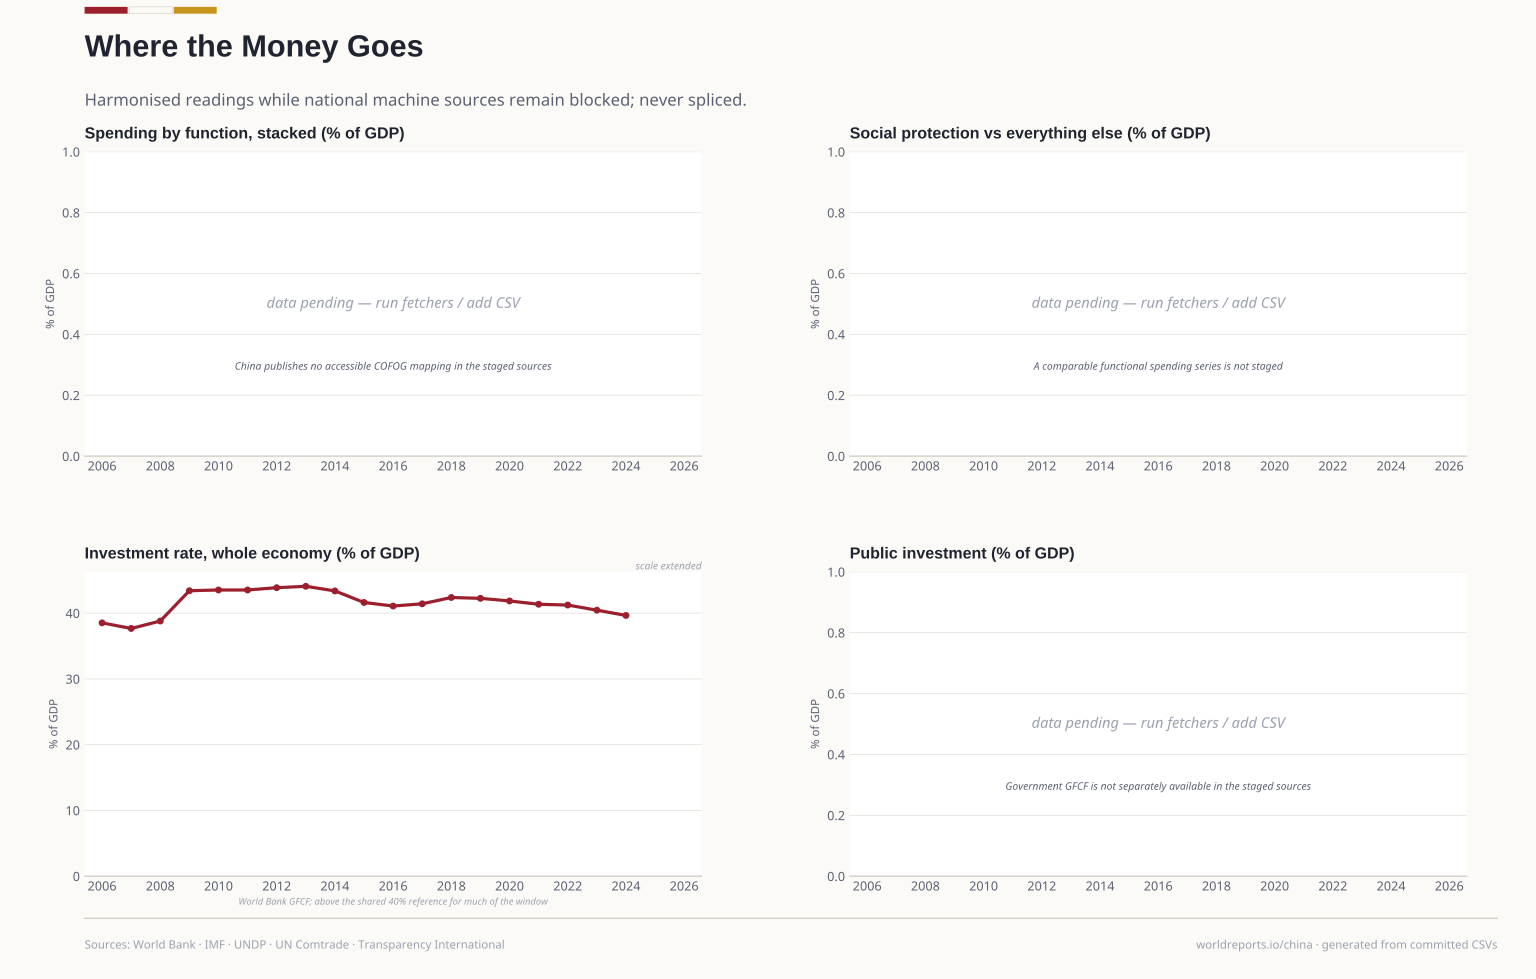
economy/gfcf_pct_gdp.csv | VERIFIED 2026-10-23: 2024 39.65, series ends 2024 (WB lag). The 2010-2021 plateau (always above 40) breaks the spine's 0–40 reference: the axis grows… | World Bank — NE.GDI.FTOT.ZS (GFCF, % of GDP, national accounts) | 2006-2024 | Other |
|---|
economy/gfcf_pct_gdp_from_wb.csv | Fetcher sidecar behind gfcf_pct_gdp.csv; diff before adopting. | World Bank — NE.GDI.FTOT.ZS | 2006-2024 | Other |
|---|
economy/inflation_intl.csv | VERIFIED 2026-10-23 and refetched the same day. WB annual CPI: 2023 0.23, 2024 0.22, 2025 0.06; IMF CHN: 2009 −0.7 (deflation inside a +9% growth… | World Bank FP.CPI.TOTL.ZG + IMF DataMapper PCPIPCH (WEO) | 2006-2025 | Other |
|---|
economy/inflation_intl_from_imf.csv | Fetcher sidecar behind inflation_intl.csv; diff before adopting. | IMF DataMapper — PCPIPCH (WEO, outturn years only) | 2006-2025 | Other |
|---|
economy/inflation_intl_from_wb.csv | Fetcher sidecar behind inflation_intl.csv; diff before adopting. | World Bank — FP.CPI.TOTL.ZG | 2006-2025 | Other |
|---|
economy/unemployment_intl.csv | VERIFIED 2026-10-23: 2025 4.6, 2020 5.0 — the ILO modelled estimate, the only unemployment series this machine can fetch: the NBS surveyed urban rate… | World Bank — SL.UEM.TOTL.ZS (ILO modelled estimate) | 2006-2025 | Other |
|---|
economy/unemployment_intl_from_wb.csv | Fetcher sidecar behind unemployment_intl.csv; diff before adopting. | World Bank — SL.UEM.TOTL.ZS | 2006-2025 | Other |
|---|
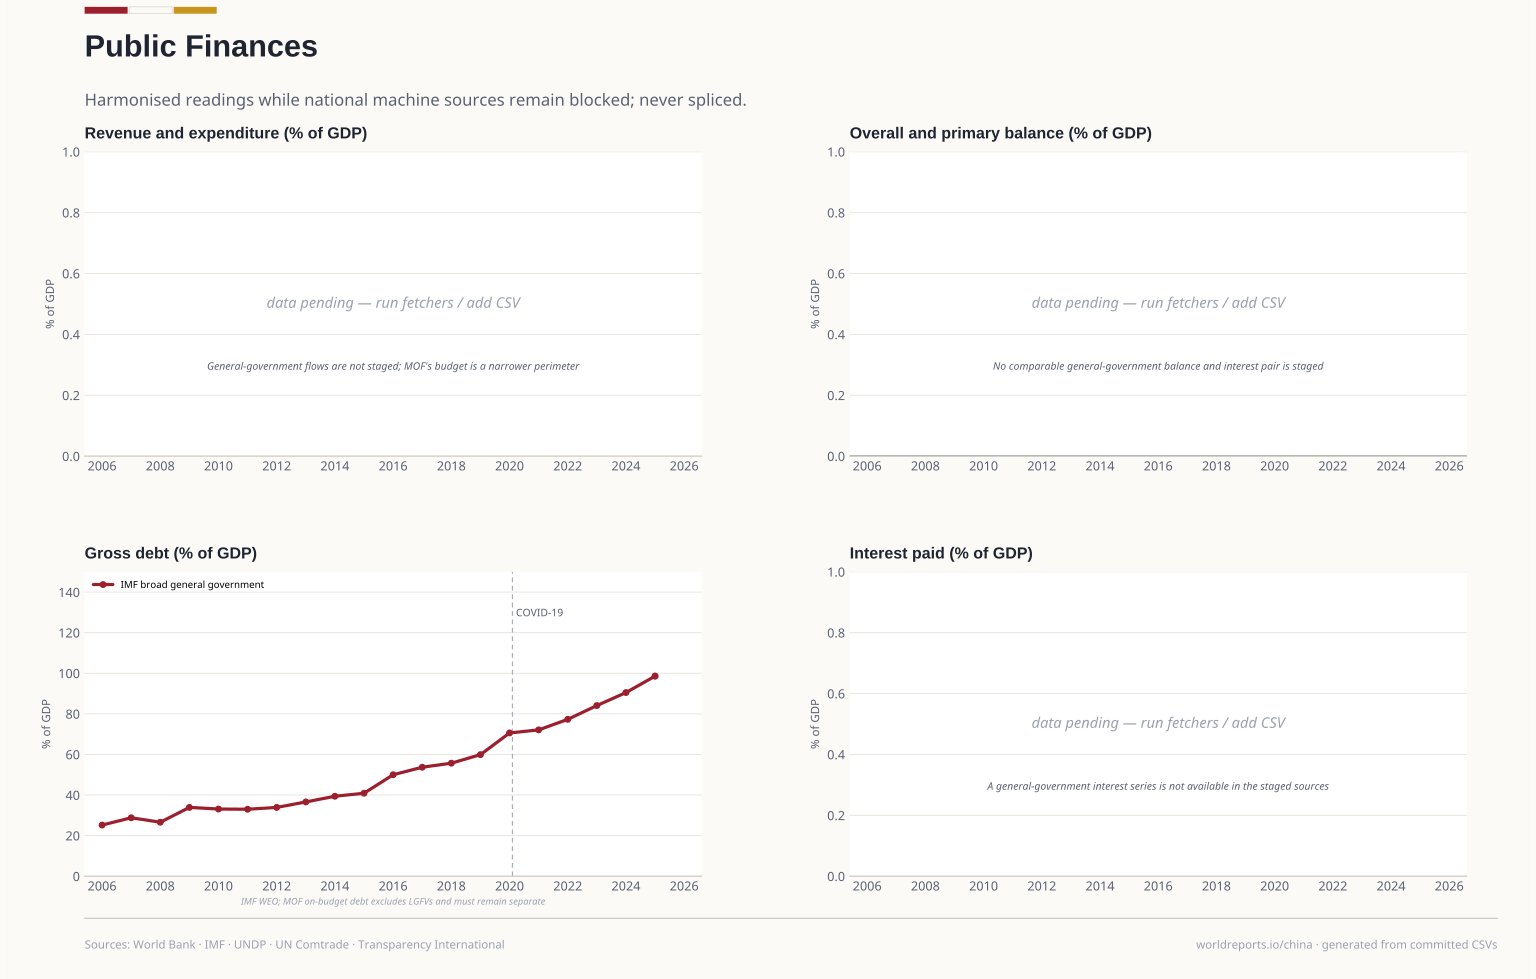
fiscal/debt_intl_pct_gdp.csv | The official DataMapper landing above is the independently resolvable citation. The fetcher reads the JSON API at… | IMF DataMapper — GGXWDG_NGDP (general government gross debt, % of GDP) | 2006-2025 | Other |
|---|
fiscal/debt_intl_pct_gdp_from_imf.csv | Fetcher sidecar behind debt_intl_pct_gdp.csv; diff before adopting. The fetcher uses the DataMapper JSON API, which may receive an IMF/Akamai 403… | IMF DataMapper — GGXWDG_NGDP (outturn years to 2025; projections beyond are never cached as data) | 2006-2025 | Other |
|---|
international/corruption_intl.csv | VERIFIED 2026-10-23: CHN 2012 39, 2021-22 45 (best years), 2025 43. Scores 0–100 on the method introduced in 2012; the earlier 0–10 scores are a… | Transparency International — Corruption Perceptions Index, 2012-method series | 2012-2025 | Other |
|---|
international/hdi.csv | VERIFIED. 200, text/csv, ~2.0 MB, one row per country (names are cp1252, not UTF-8 — the fetcher decodes cp1252); the CHN row: rank 78, 2006 0.666… | UNDP — Human Development Report 2025, composite indices complete time series | 2006-2023 | Other |
|---|
international/hdi_from_undp.csv | Fetcher sidecar behind hdi.csv; window-clipped copy of the HDR25 CHN row. | UNDP — HDR25_Composite_indices_complete_time_series.csv, CHN row | 2006-2023 | Other |
|---|
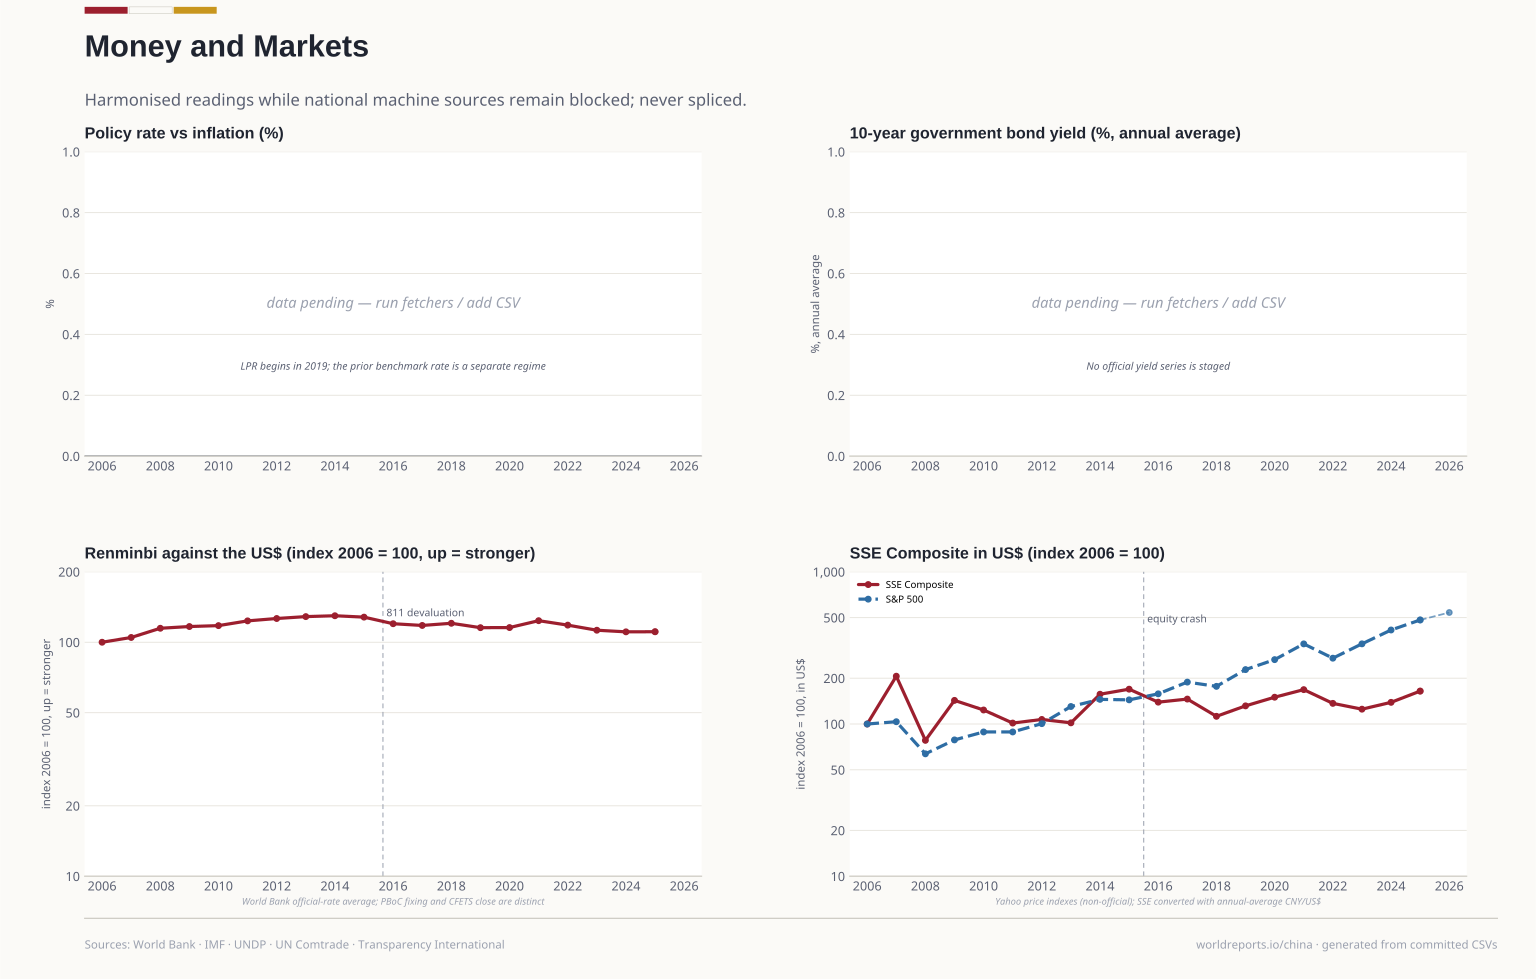
markets/fx_cny_per_usd.csv | VERIFIED 2026-10-23: 2025 7.19; 2006 7.97, 2014 6.14 (the firm years before the 2015-811 devaluation). This is the series the currency slot indexes… | World Bank — PA.NUS.FCRF (official exchange rate, CNY per US$, annual average) | 2006-2025 | Other |
|---|
markets/fx_cny_per_usd_from_wb.csv | Fetcher sidecar behind fx_cny_per_usd.csv; diff before adopting. | World Bank — PA.NUS.FCRF | 2006-2025 | Other |
|---|
markets/reserves_intl.csv | VERIFIED. Reserves incl. gold, current US$, year-end: 2025 3,748,744,952,817.94 (US$3.75tn), 2024 US$3.46tn. The gold-revaluation step in 2024-25… | World Bank — FI.RES.TOTL.CD (IMF IFS), ISO3=CHN | 2006-2025 | Other |
|---|
markets/reserves_intl_from_wb.csv | Fetcher sidecar behind reserves_intl.csv; diff before adopting. | World Bank — FI.RES.TOTL.CD | 2006-2025 | Other |
|---|
markets/spx_index.csv | VERIFIED 2026-10-23. Year-end closes 2007 1468.36, 2015 2043.94, 2024 5881.63 — matching the record exactly; the 2026 row is a running reading. Drawn… | market — S&P 500, redistributed by Yahoo Finance | 2006-2026 | Other |
|---|
markets/spx_index_from_yahoo.csv | Fetcher sidecar behind spx_index.csv; 2005 row kept as rebasing context. | Yahoo Finance chart API — ^GSPC monthly bars | 2005-2026 | Other |
|---|
markets/sse_index.csv | VERIFIED. JSON chart object; meta: symbol 000001.SS, exchange SHH (Shanghai), instrumentType INDEX, currency CNY, firstTradeDate 1997-07, gmtoffset… | market — SSE Composite (上证综合指数), redistributed by Yahoo Finance | 2006-2026 | Other |
|---|
markets/sse_index_from_yahoo.csv | Fetcher sidecar behind sse_index.csv; 2005 row kept as rebasing context. | Yahoo Finance chart API — 000001.SS monthly bars | 2005-2026 | Other |
|---|
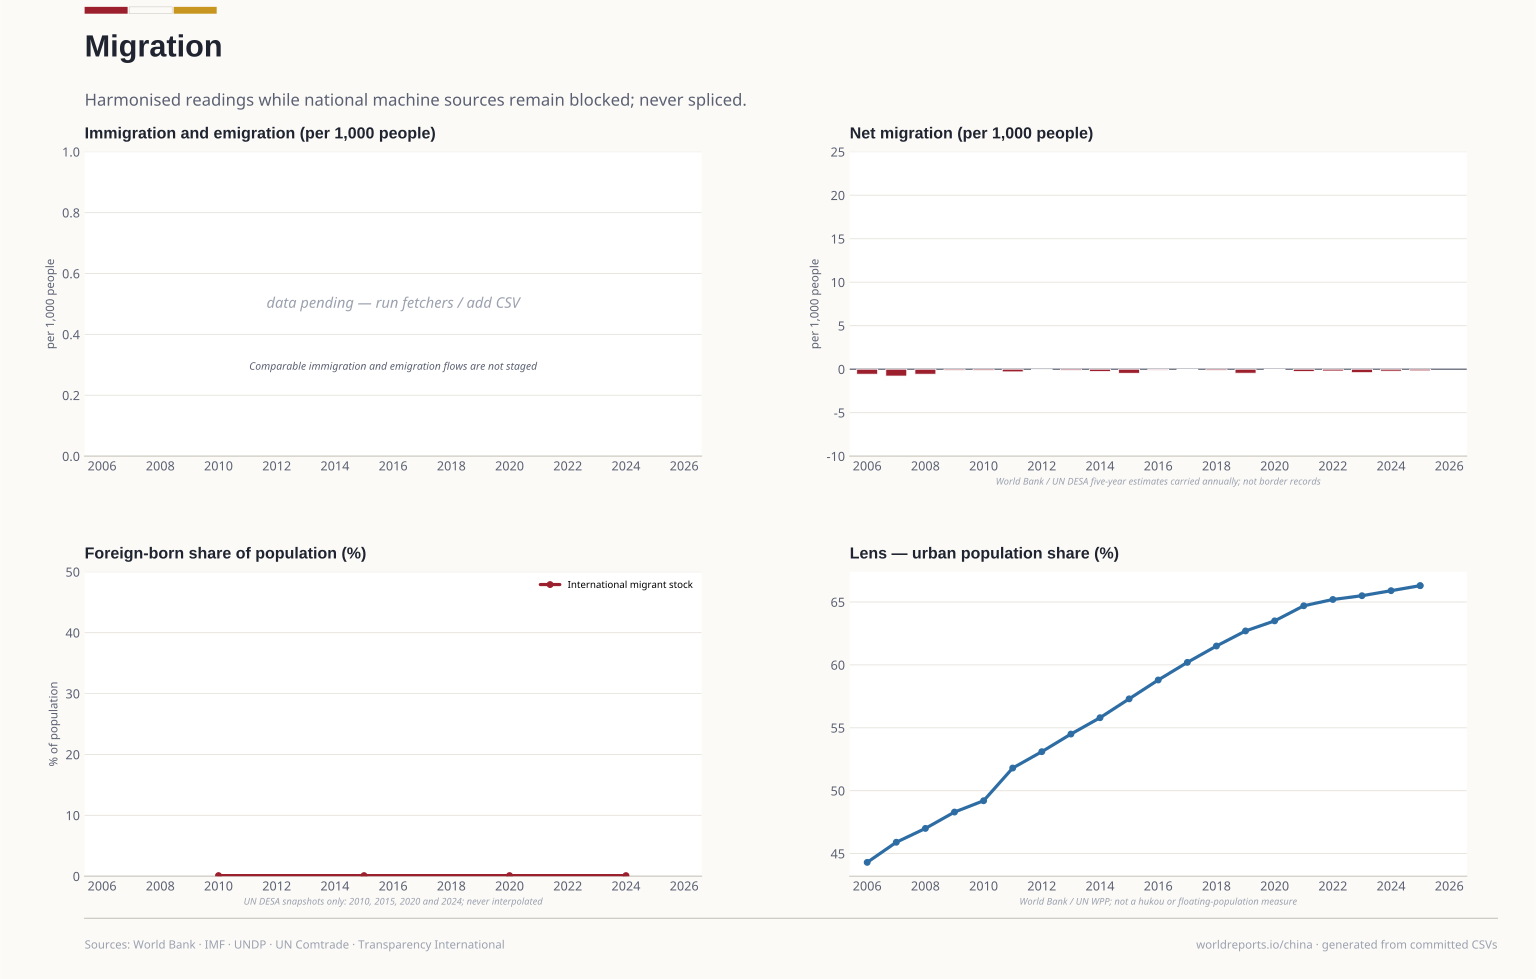
migration/migrant_stock_intl.csv | VERIFIED. 2024 = 0.1% of population. UN DESA publishes five-year vintages: inside the window the series exists at 2010, 2015, 2020 and 2024 only… | World Bank — SM.POP.TOTL.ZS (UN DESA migrant stock, % of population) | 2010-2024 | Other |
|---|
migration/migrant_stock_intl_from_wb.csv | Fetcher sidecar behind migrant_stock_intl.csv; diff before adopting. | World Bank — SM.POP.TOTL.ZS | 2010-2024 | Other |
|---|
migration/urban_share_intl.csv | The legible reading of internal (rural-to-urban) migration — the country's largest movement, invisible in the blocked NBS external-flow books and in… | UN World Population Prospects 2024 (urban population share) via World Bank SP.URB.TOTL.IN.ZS, ISO3=CHN | 2006-2025 | Other |
|---|
migration/urban_share_intl_from_wb.csv | Fetcher sidecar behind urban_share_intl.csv; diff before adopting. | World Bank — SP.URB.TOTL.IN.ZS | 2006-2025 | Other |
|---|
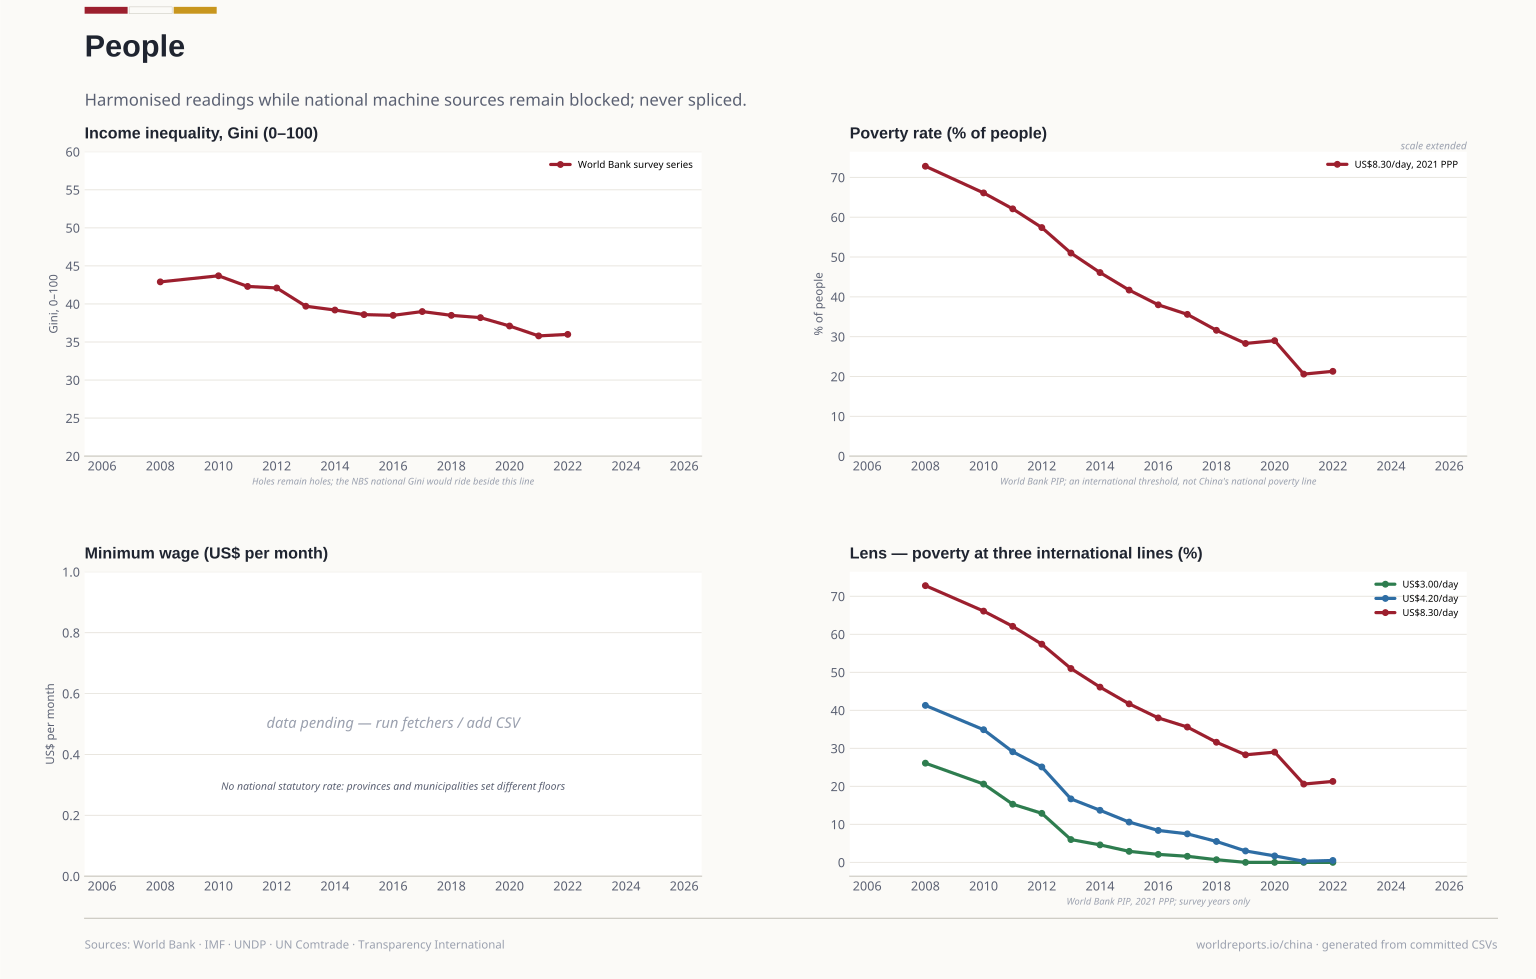
people/gini_intl.csv | VERIFIED. 2022 = 36.0; 2023 onward are null — the WB series LAGS, and the nulls stay null (a hole is a hole). 2006-2007 and 2009 are holes in the WB… | World Bank — SI.POV.GINI (harmonised, own income definition) | 2008-2022 | Other |
|---|
people/gini_intl_from_wb.csv | Fetcher sidecar behind gini_intl.csv; holes 2006-2007, 2009 and 2023+ stay holes. | World Bank — SI.POV.GINI | 2008-2022 | Other |
|---|
people/pov_lines_intl.csv | The international poverty-line family for China — one survey, three lines, with the $8.30 upper-middle-income line already in poverty_intl.csv… | World Bank PIP pov_line_family — SI.POV.DDAY ($3.00/day 2021 PPP) + SI.POV.LMIC ($4.20/day 2021 PPP), ISO3=CHN | 2008-2022 | Other |
|---|
people/pov_lines_intl_from_wb.csv | Fetcher sidecar behind pov_lines_intl.csv; diff before adopting. | World Bank — SI.POV.DDAY + SI.POV.LMIC | 2008-2022 | Other |
|---|
people/poverty_intl.csv | VERIFIED 2026-10-23: 2022 21.3% and survey years 2008-2022 only. The US$8.30 line is the poverty line the Bank sets for a country at China's income… | World Bank PIP — SI.POV.UMIC (poverty headcount, US$8.30/day, 2021 PPP) | 2008-2022 | Other |
|---|
people/poverty_intl_from_wb.csv | Fetcher sidecar behind poverty_intl.csv; survey-year holes stay holes. | World Bank — SI.POV.UMIC | 2008-2022 | Other |
|---|
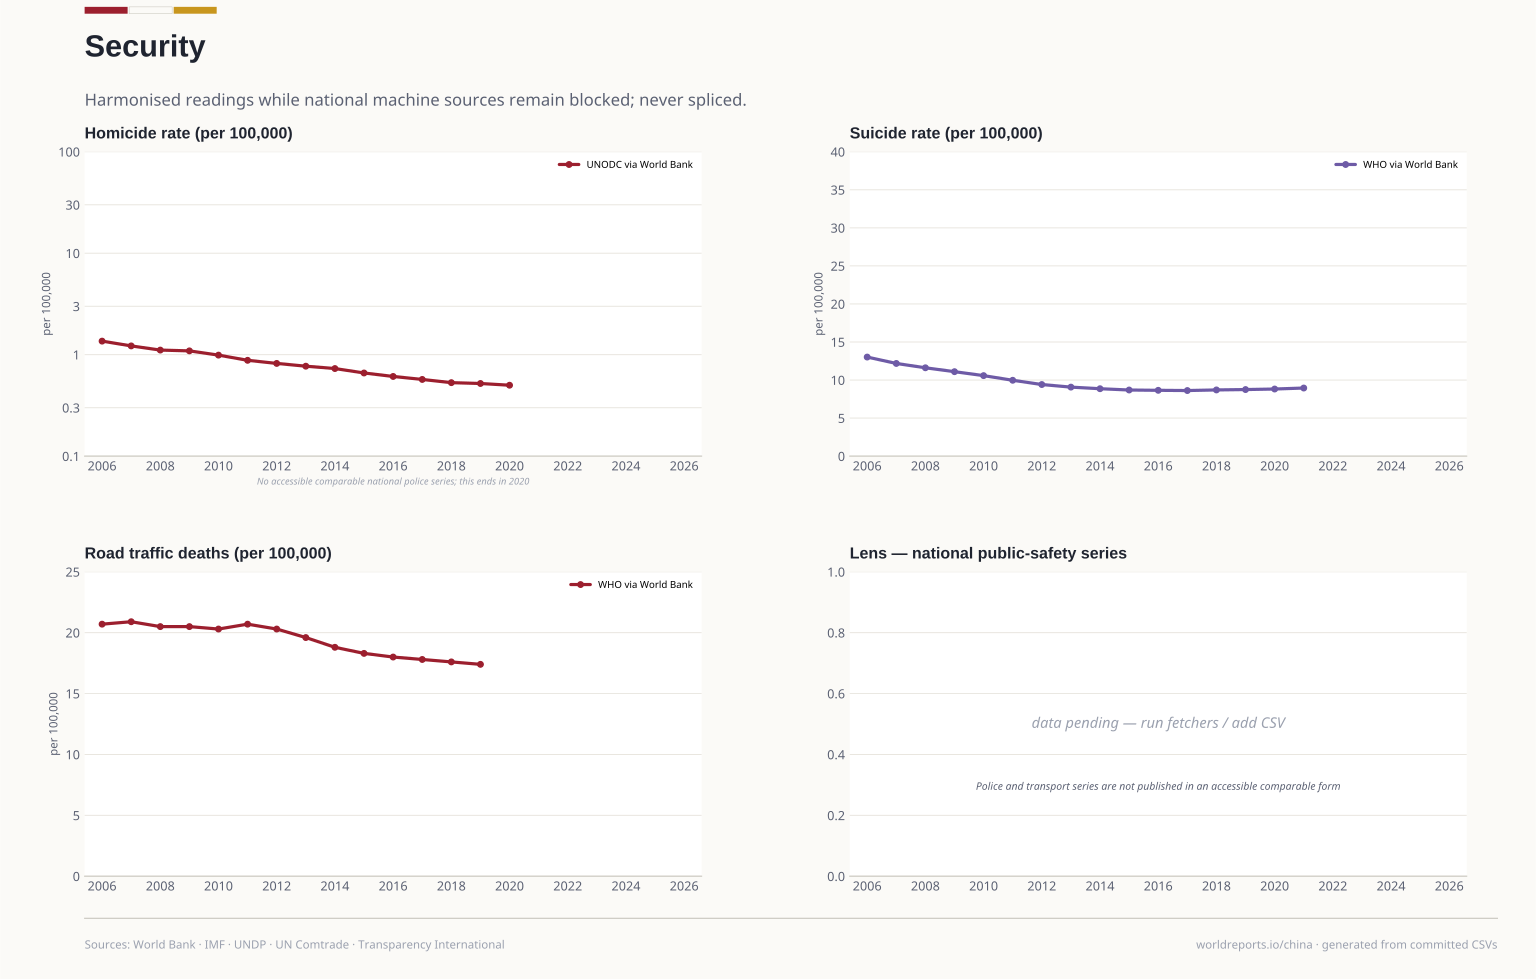
security/security_intl.csv | VERIFIED 2026-10-23: homicide 2020 0.50 per 100,000 (UNODC series ends 2020), suicide 2021 8.95 (WHO age-standardised, ends 2021), road traffic 2019… | World Bank — VC.IHR.PSRC.P5 (UNODC homicide), SH.STA.SUIC.P5 (WHO suicide), SH.STA.TRAF.P5 (WHO road traffic) | 2006-2021 | Other |
|---|
security/security_intl_from_wb.csv | Fetcher sidecar behind security_intl.csv; each series keeps its own end year. | World Bank — VC.IHR.PSRC.P5, SH.STA.SUIC.P5, SH.STA.TRAF.P5 | 2006-2021 | Other |
|---|
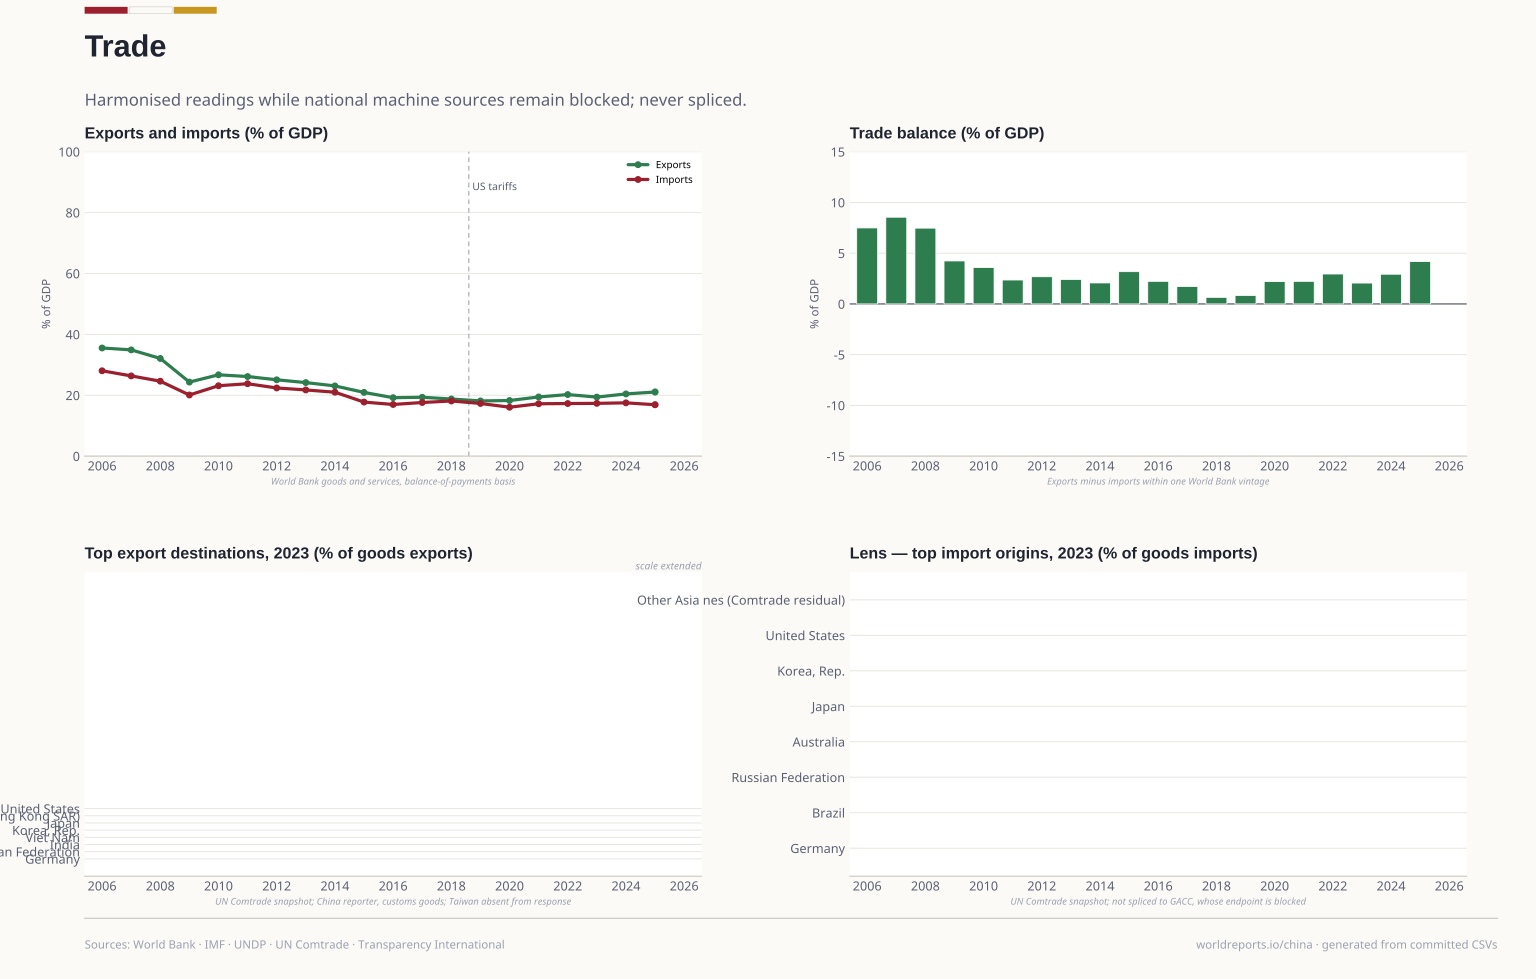
trade/trade_comtrade_partner.csv | VERIFIED 200 (no auth). 2023 snapshot: World rows US$3,379,747,834,884 (X) / US$2,556,763,018,595 (M), asserted at fetch time and matching GACC's… | UN Comtrade public preview (reporter 156 = China), HS goods by partner | 2023-2023 | Other |
|---|
trade/trade_comtrade_partner_from_comtrade.csv | Fetcher sidecar behind trade_comtrade_partner.csv; the World row and all partner sums are shape-asserted before caching. | UN Comtrade public preview — period 2023, flows X and M, cmdCode TOTAL, all partners | 2023-2023 | Other |
|---|
trade/trade_intl_openness.csv | VERIFIED. 2025 = 37.96% of GDP (exports 21.07 + imports 16.89; the fetcher asserts the two parts sum to the total within 0.1). Goods+ services, BoP… | World Bank — NE.TRD.GNFS.ZS plus NE.EXP.GNFS.ZS / NE.IMP.GNFS.ZS | 2006-2025 | Other |
|---|
trade/trade_intl_openness_from_wb.csv | Fetcher sidecar behind trade_intl_openness.csv; diff before adopting. | World Bank — NE.TRD.GNFS.ZS, NE.EXP.GNFS.ZS, NE.IMP.GNFS.ZS | 2006-2025 | Other |
|---|
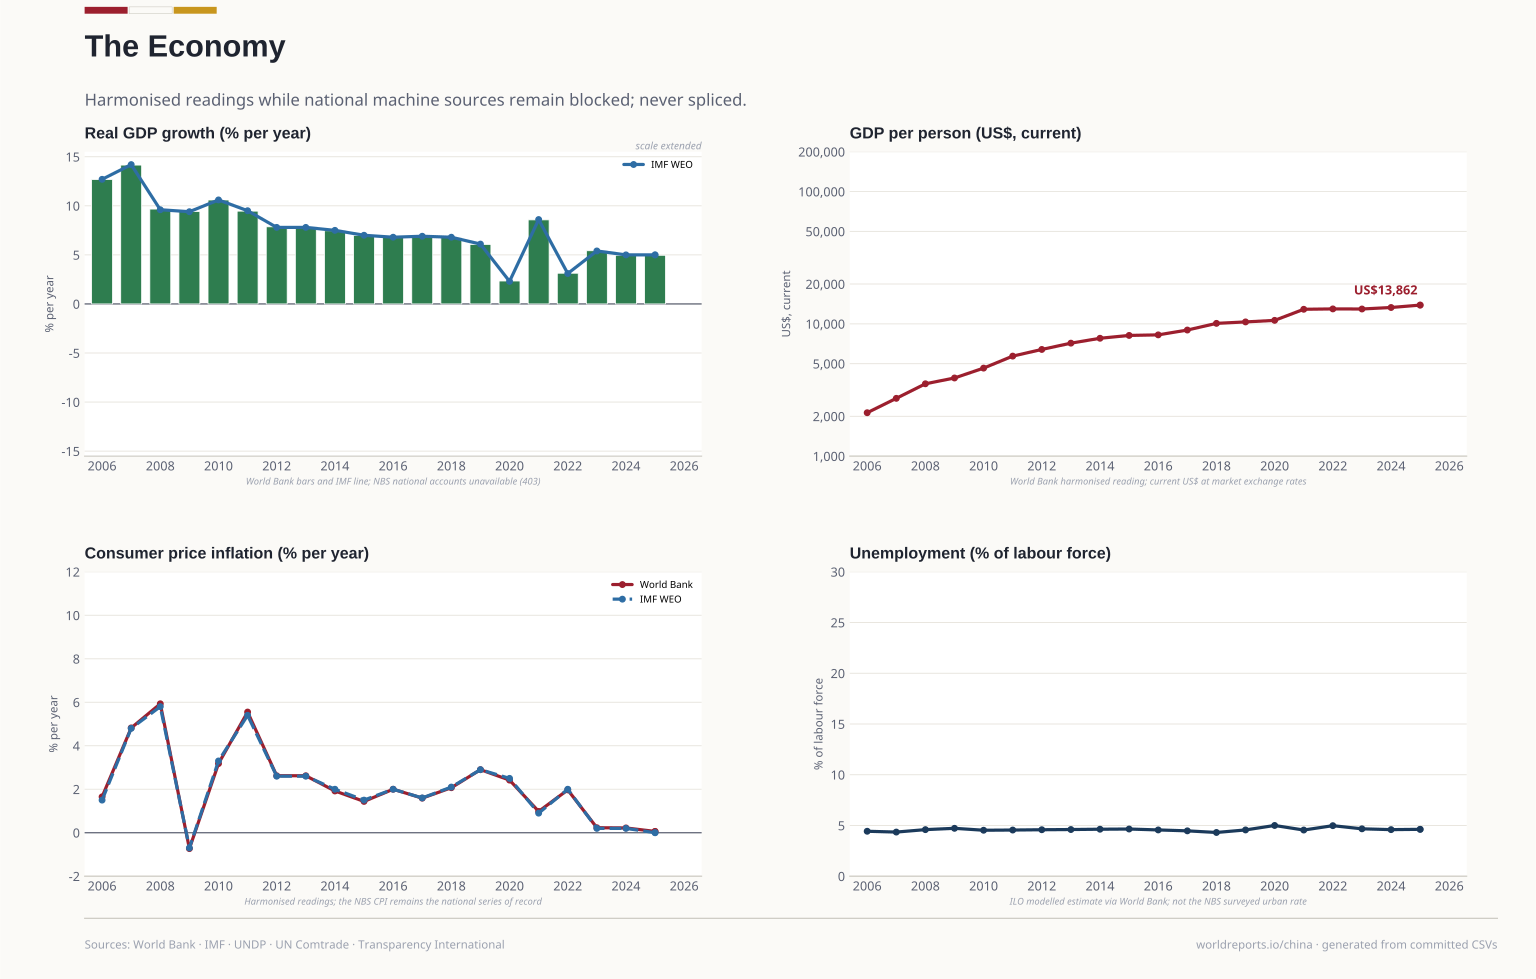 Plate 01