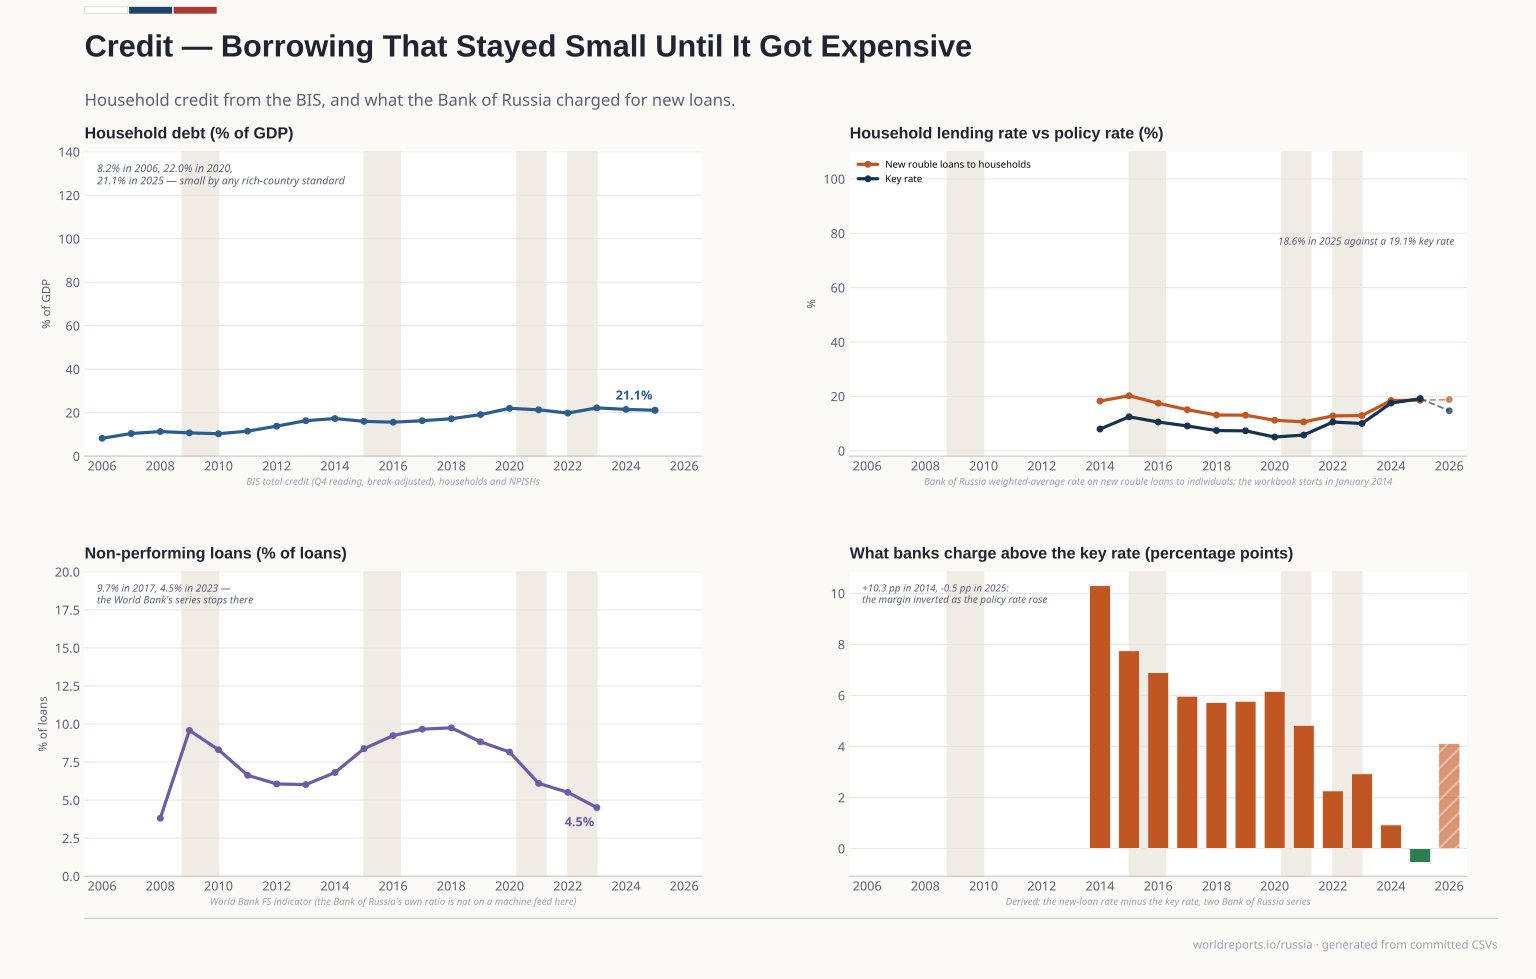
credit/household_debt.csv | VERIFIED 2026-10-25, year-end (Q4) reading of a quarterly series: 2006 = 8.2% of GDP, 2020 = 22.0% (the COVID peak), 2024 = 21.5%, 2025 = 21.1%… | BIS total credit statistics — WS_TC, Q.RU.H.A.M.770.A (credit to households and NPISHs, % of GDP) | 2006-2025 | Other |
|---|
credit/household_lending_rate.csv | VERIFIED 2026-10-25. Monthly weighted-average rate on NEW rouble loans to individuals, all maturities, annual mean: 2014 = 18.27, 2015 = 20.23 (the… | Bank of Russia — weighted-average rate on new rouble loans to individuals | 2014-2026 | Official |
|---|
credit/npl.csv | VERIFIED 2026-10-25: 2009 = 9.58% (the crisis peak), 2017 = 9.66% (the retail-lending clean-up), 2023 = 4.51%. The series stops in 2023 — the World… | World Bank WDI — FB.AST.NPER.ZS (bank non-performing loans to total gross loans) | 2008-2023 | Other |
|---|
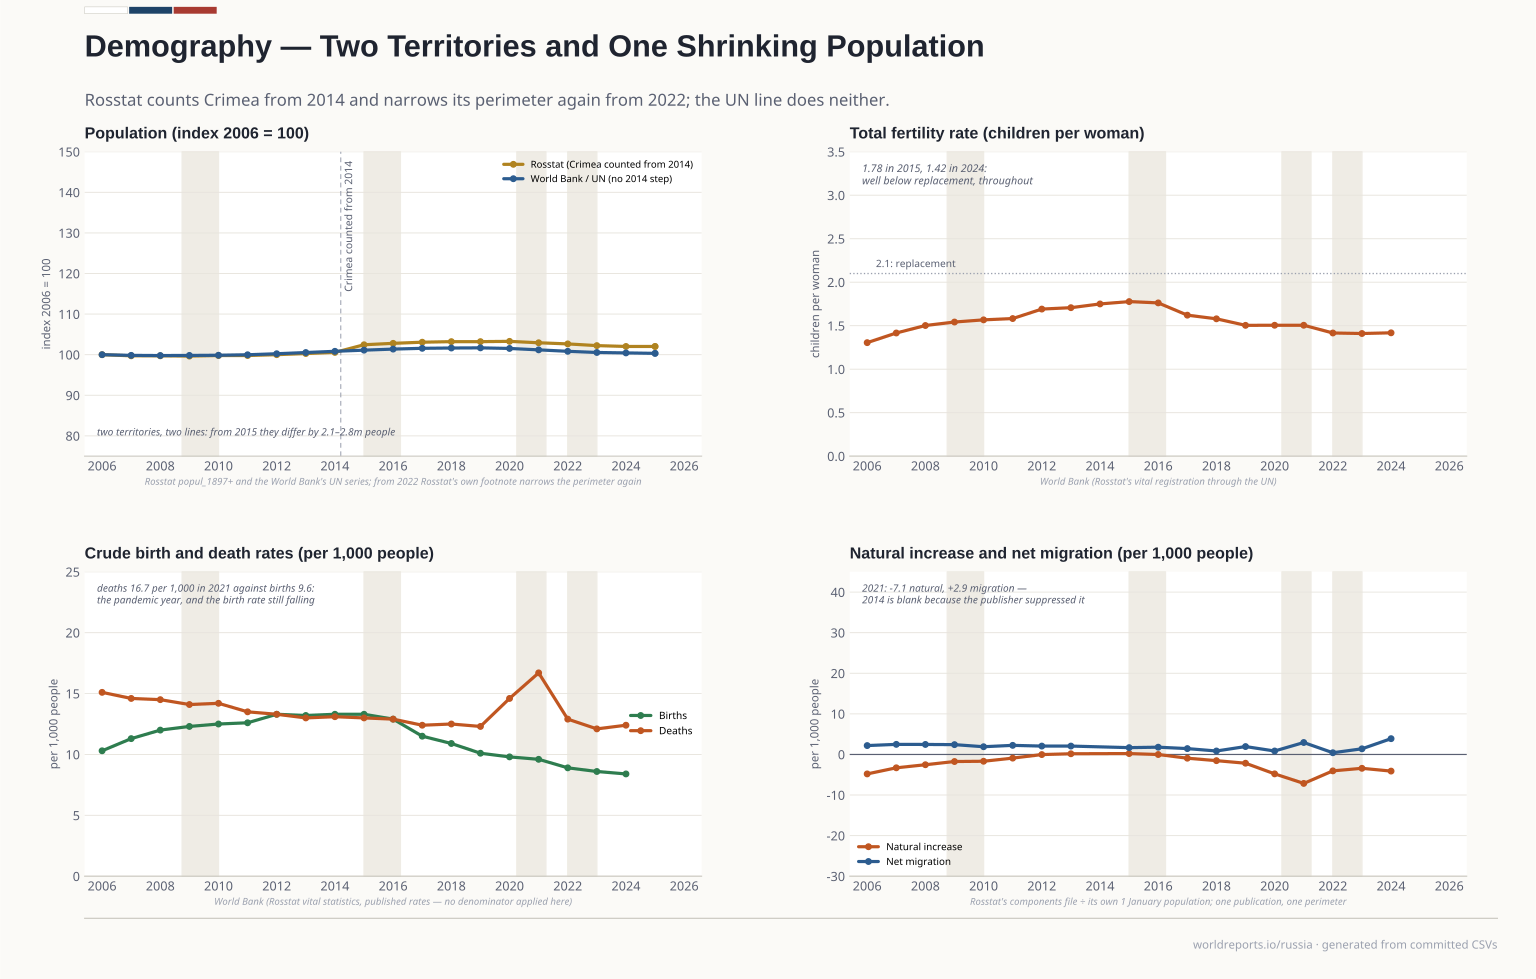
demography/components.csv | VERIFIED 2026-10-25. Thousand people: the 1 January stock, the year's total, natural and migration change, and the 31 December stock. This is the… | Rosstat — Popul components_1990+.xlsx (population change and its components) | 2006-2024 | Official |
|---|
demography/fertility.csv | VERIFIED 2026-10-25: 2006 = 1.31, 2015 = 1.78 (the pro-natalist peak), 2024 = 1.42. Covers 2006-2024. | World Bank WDI — SP.DYN.TFRT.IN (UN WPP) | 2006-2024 | Other |
|---|
demography/population.csv | VERIFIED 2026-10-25, million people, one decimal as published: 2014 = 144.0, 2015 = 146.7, 2025 = 146.1. TERRITORY: the +2.7m step between 2014 and… | Rosstat — popul_1897+.xlsx (population, million people, annual) | 2006-2025 | Official |
|---|
demography/population_wb.csv | VERIFIED 2026-10-25, mid-year de-facto total on the UN perimeter: 2014 = 144,237,223 and 2015 = 144,640,716 — a 0.4m step where Rosstat has 2.7m… | World Bank WDI — SP.POP.TOTL (UN World Population Prospects) | 2006-2025 | Other |
|---|
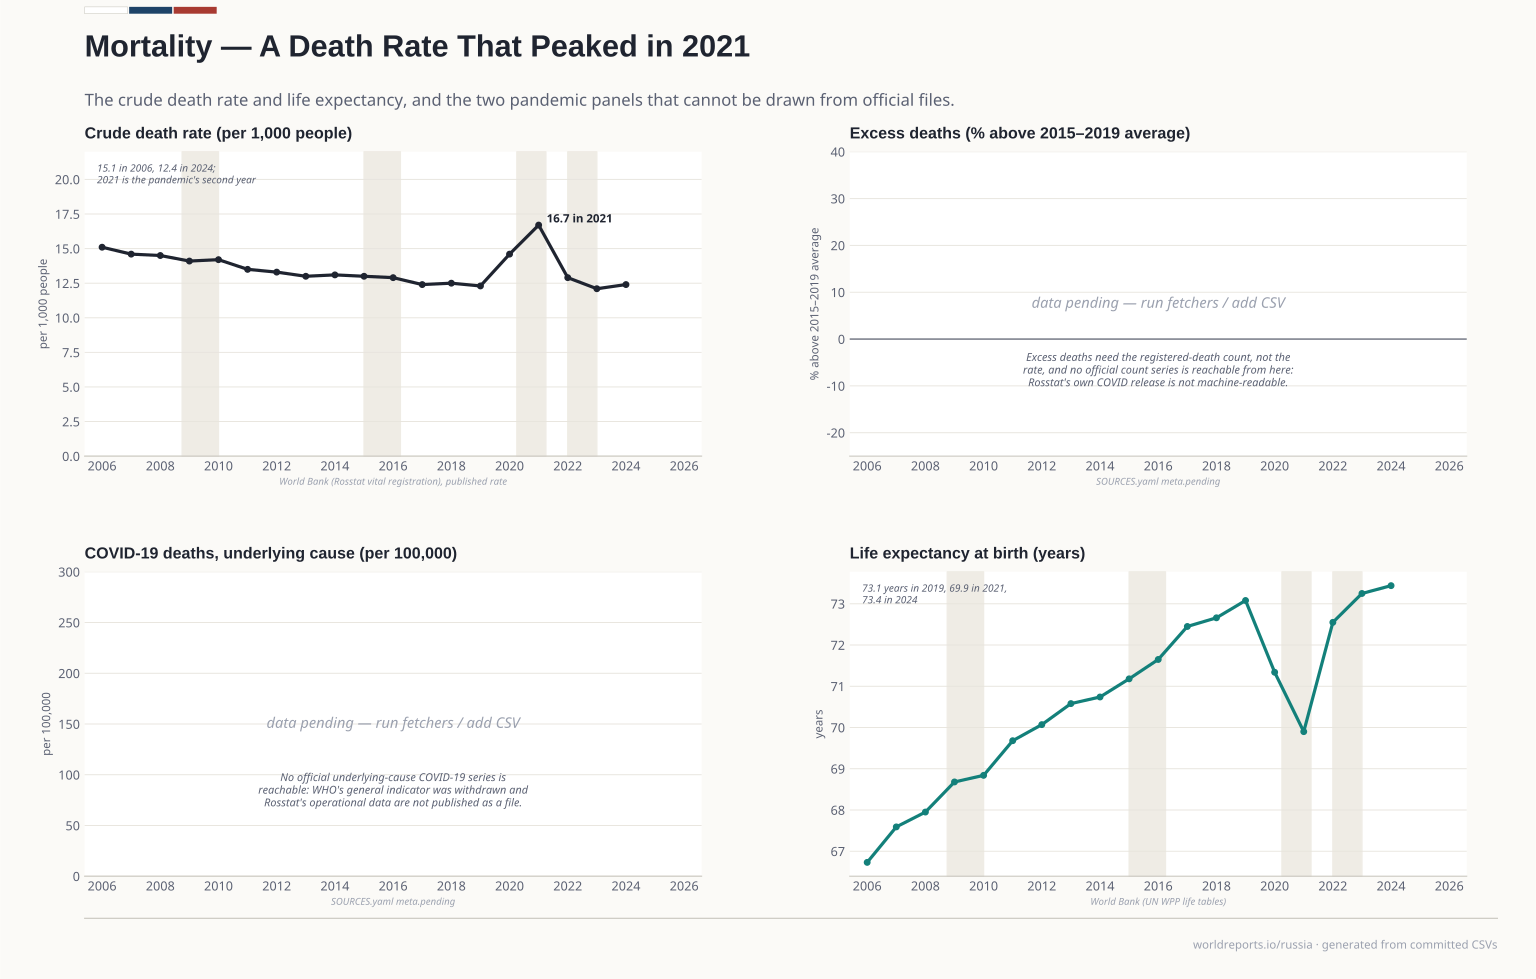
demography/vitals.csv | VERIFIED 2026-10-25: crude birth rate per 1,000 2024 = 8.4, crude death rate 2024 = 12.4. The national births-and-deaths counts are published by… | World Bank WDI — SP.DYN.CBRT.IN, SP.DYN.CDRT.IN (UN WPP) | 2006-2024 | Other |
|---|
fiscal/federal_budget.csv | VERIFIED 2026-10-25. Federal budget, CASH basis, FEDERAL level only, billion roubles. Anchors: 2006 revenue 6,278.9; 2023 revenue 29,124.0… | Ministry of Finance of the Russian Federation — Приложение 3.1, federal budget execution | 2006-2025 | Official |
|---|
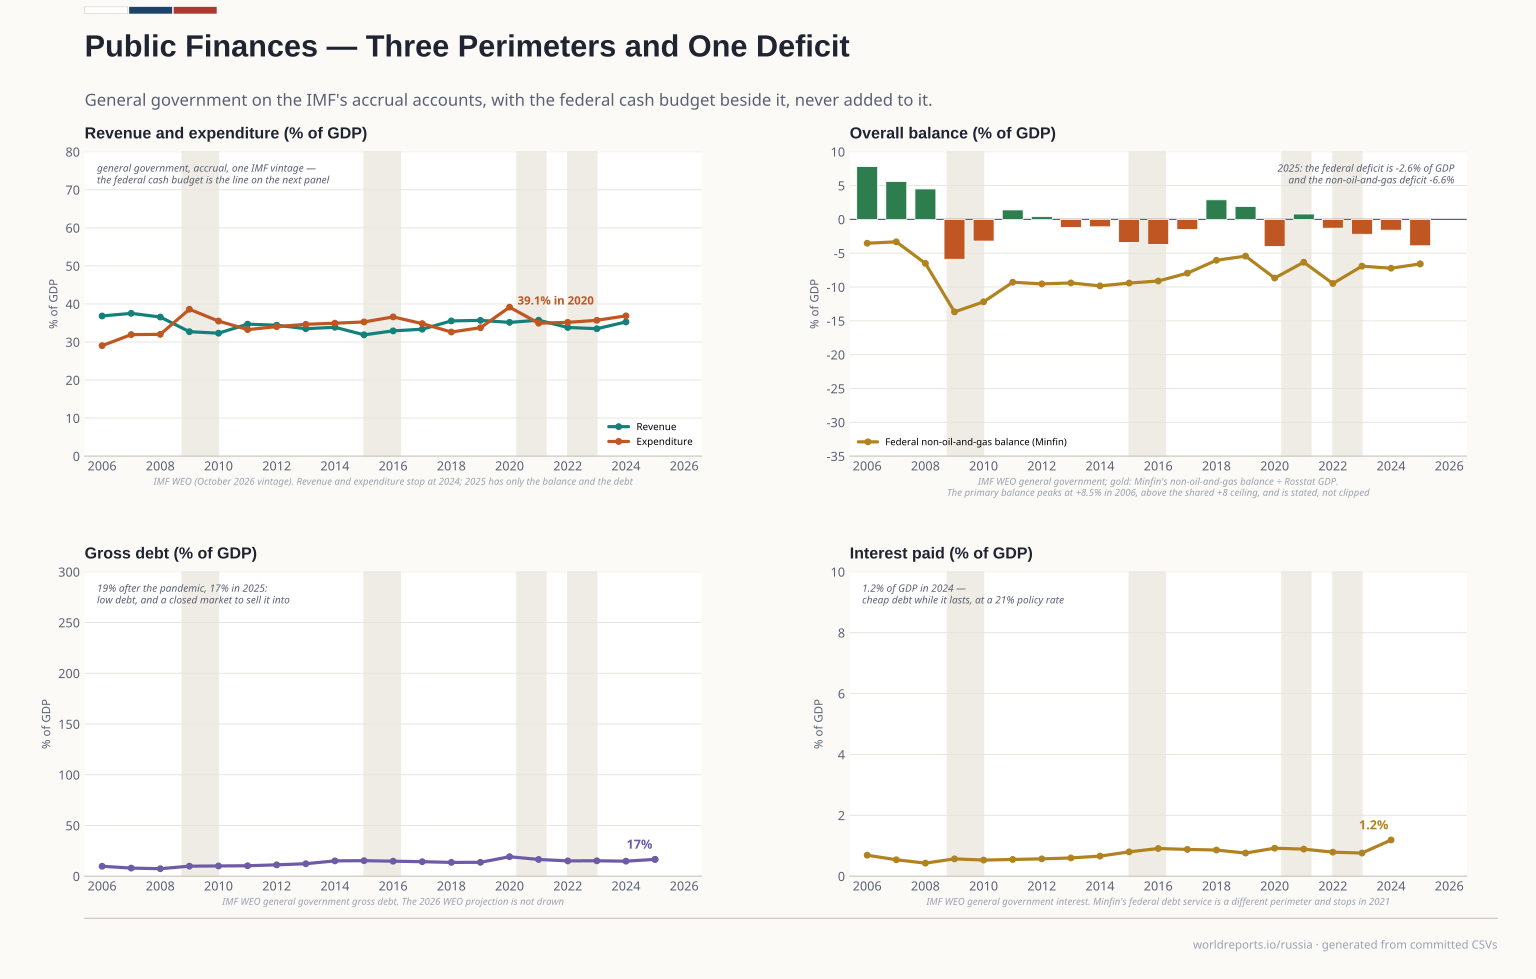
fiscal/fiscal.csv | VERIFIED 2026-10-25. One vintage for all six columns. Observed: revenue 2024 = 35.27% of GDP, expenditure 2024 = 36.87%, overall balance 2023 =… | IMF WEO (October 2026 vintage), general government — rev, exp, GGXCNL_NGDP, pb, ie, GGXWDG_NGDP | 2006-2026 | Other |
|---|
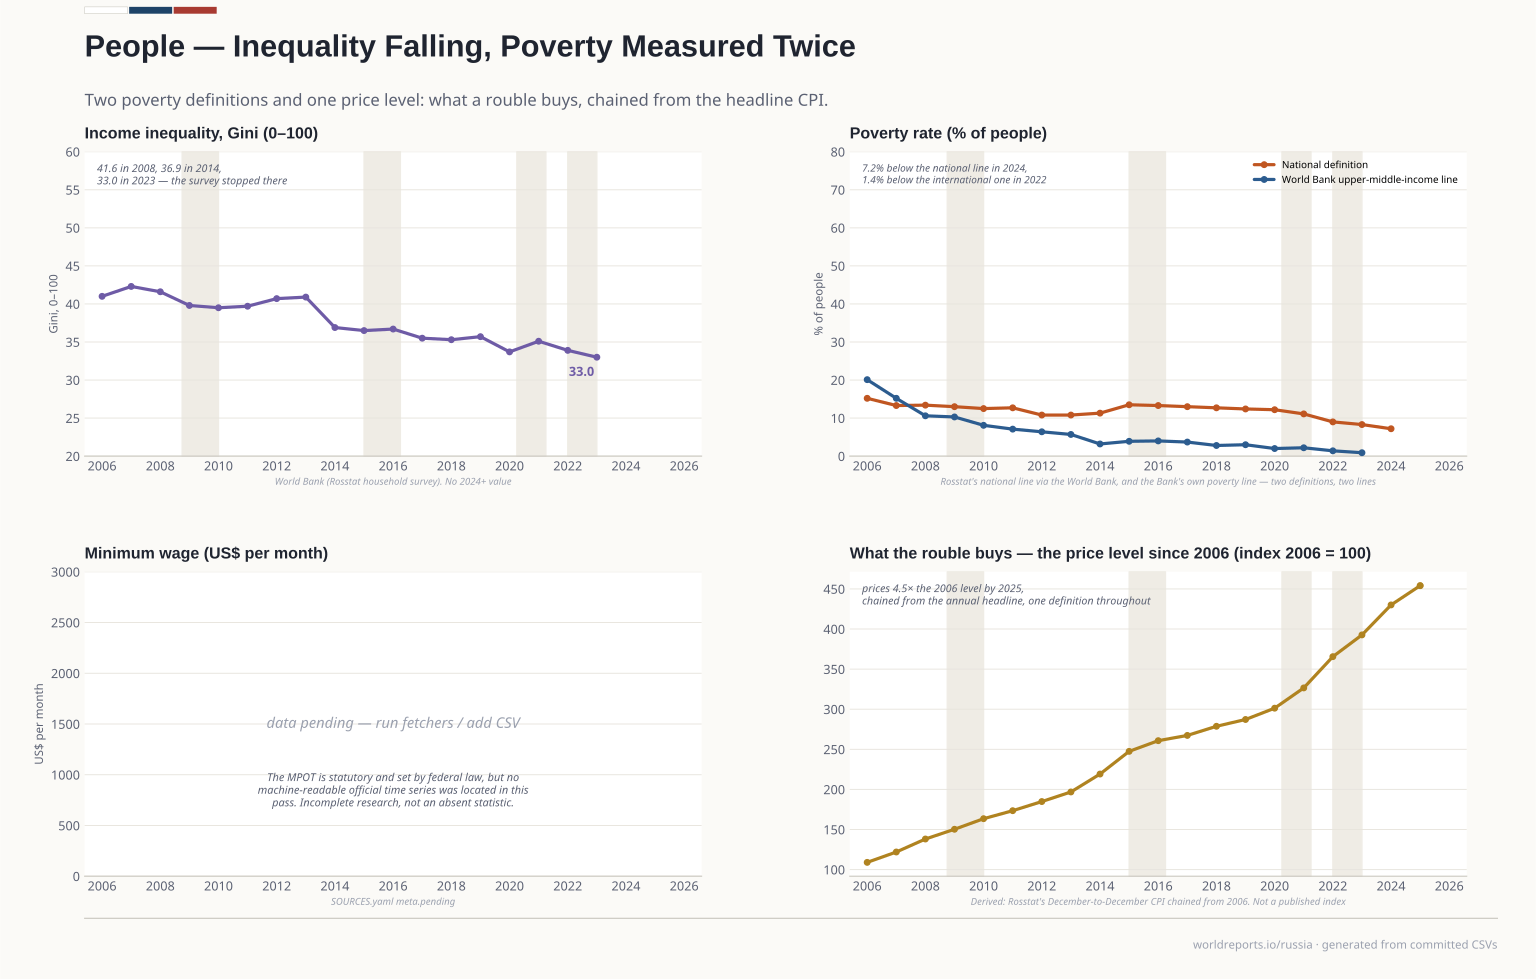
macro/cpi.csv | VERIFIED 2026-10-25. The HEADLINE December-to-December change: 2008 = 13.28%, 2015 = 12.91%, 2022 = 11.94%, 2025 = 5.59%. DEFINITION TRAP: the World… | Rosstat — ipc_s_1992-2025.xlsx (CPI, all goods and services, Russian Federation) | 2006-2025 | Official |
|---|
macro/economy.csv | VERIFIED 2026-10-25, the harmonised comparison layer. Growth is Rosstat republished (2022 -1.44 on both, 2025 +1.00 on both). CPI is the annual… | World Bank WDI — NY.GDP.MKTP.KD.ZG, FP.CPI.TOTL.ZG, SL.UEM.TOTL.ZS, NE.GDI.FTOT.ZS, NY.GDP.DEFL.KD.ZG | 2006-2025 | Other |
|---|
macro/gdp.csv | VERIFIED 2026-10-25. Nominal GDP billion roubles, real growth % and the GDP deflator %, all from the computing institution's own annual workbook… | Rosstat — VVP_god_s1995-2025.xlsx (GDP at current prices, physical-volume index, GDP deflator) | 2006-2025 | Official |
|---|
macro/gdp_quarterly.csv | VERIFIED 2026-10-25. The quarterly physical-volume index, previous year's quarter = 100, minus 100: a YEAR-ON-YEAR rate, not quarter-on-quarter… | Rosstat — VVP_kvartal_s-1995-2026.xlsx, sheets 11 and 12 (quarterly physical-volume index of GDP) | 2006-2021 | Official |
|---|
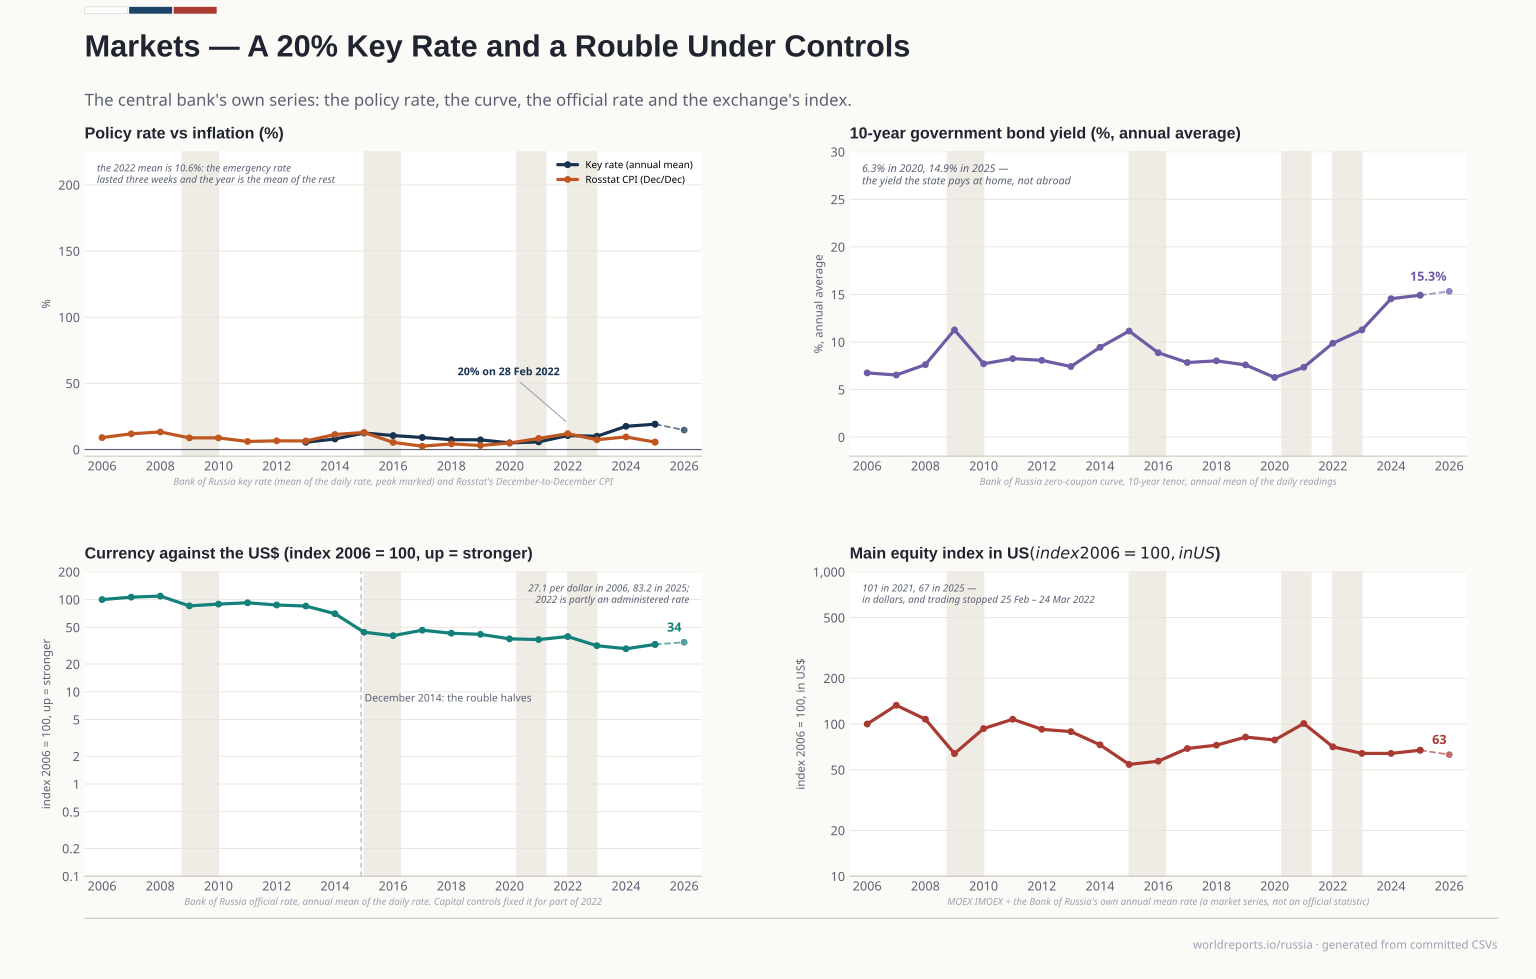
markets/imoex.csv | VERIFIED 2026-10-25. A STOCK INDEX IS A MARKET SERIES: it is flagged official: false even though the exchange that computes it serves it… | Moscow Exchange ISS API — IMOEX (MOEX Russia Index) | 2006-2026 | Other |
|---|
markets/key_rate.csv | VERIFIED 2026-10-25 against the daily rows. The key rate begins on 13.09.2013, so the series starts in 2013 and 2006-2012 are a hole rather than an… | Bank of Russia — key rate history (daily) | 2013-2026 | Official |
|---|
markets/ofz_10y.csv | VERIFIED 2026-10-25. The Bank of Russia's own model estimate of the zero-coupon curve from OFZ market prices, daily, annual mean; the 10-year tenor… | Bank of Russia — OFZ zero-coupon yield curve, 10-year tenor | 2006-2026 | Official |
|---|
markets/usd_rub.csv | VERIFIED 2026-10-25: 2006 mean 27.14, 2014 38.60 (the December 2014 collapse), 2015 61.32, 2022 68.35, 2025 83.21. Per ONE dollar; the feed's Nominal… | Bank of Russia — XML_dynamic, VAL_NM_RQ=R01235 (USD) | 2006-2026 | Official |
|---|
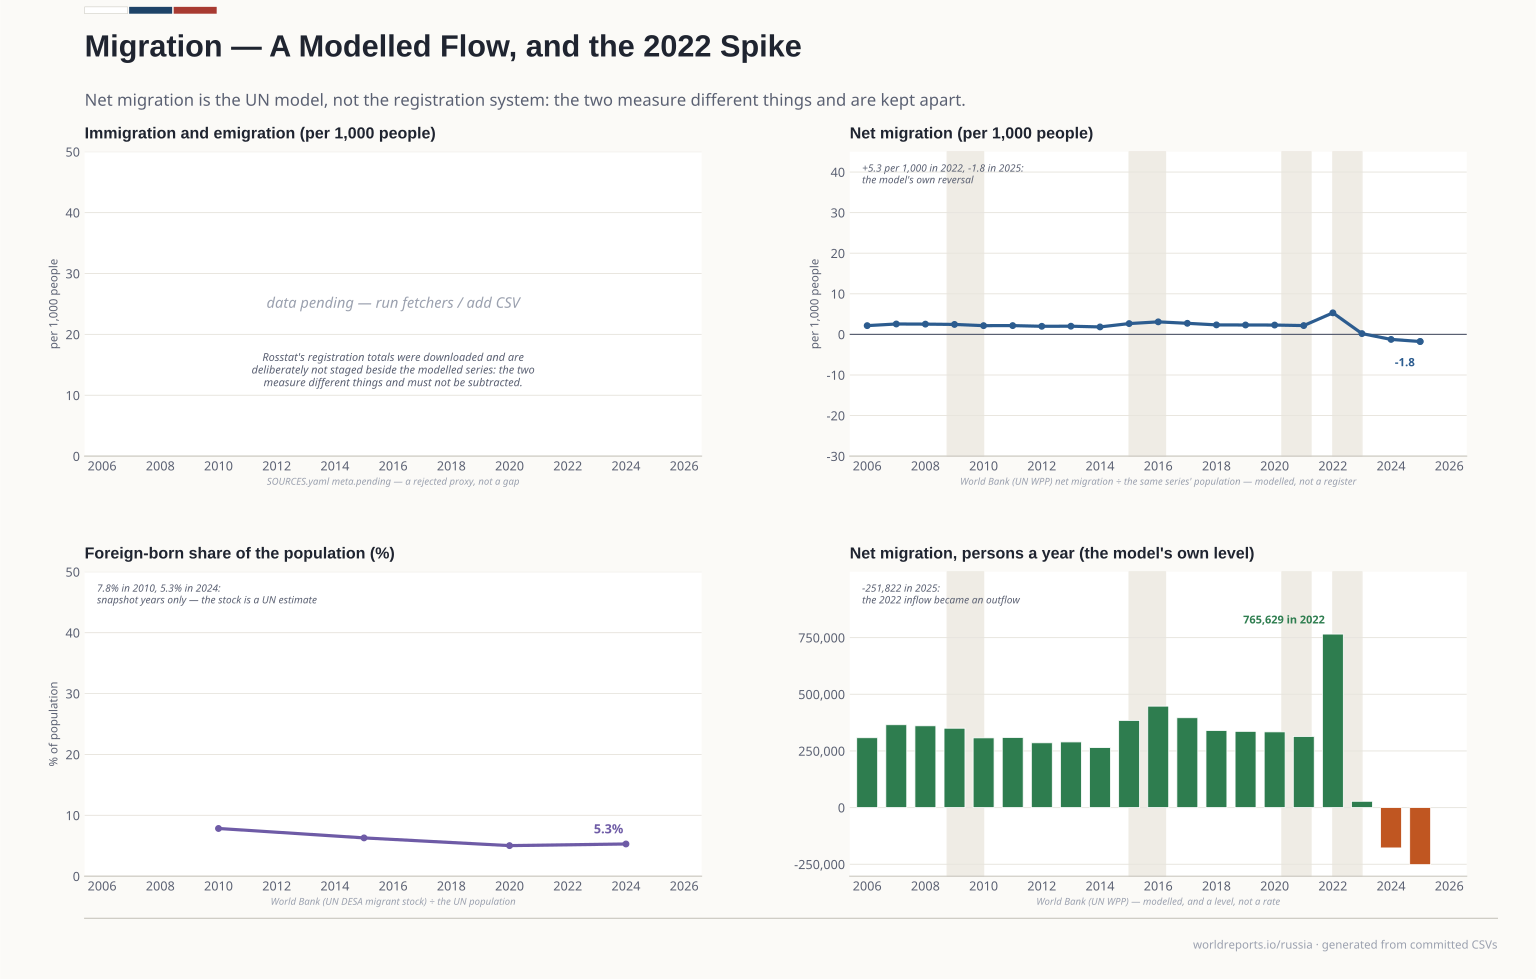
migration/migrant_stock.csv | VERIFIED 2026-10-25. A SNAPSHOT series — 2010, 2015, 2020, 2024 only, 2024 = 7,605,774 — never interpolated between its points. Foreign-born stock… | World Bank WDI — SM.POP.TOTL (UN DESA migrant stock) | 2010-2024 | Other |
|---|
migration/net_migration.csv | VERIFIED 2026-10-25: modelled net migration, persons. 2022 = +202,383 and 2025 = -251,822 — a MODELLED series, not a register. Rosstat's own… | World Bank WDI — SM.POP.NETM (UN WPP, modelled) | 2006-2025 | Other |
|---|
mortality/mortality.csv | VERIFIED 2026-10-25: crude death rate per 1,000 and life expectancy at birth. 2006 = 15.2 deaths and 66.7 years; 2021 = 16.7 and 69.4 (the COVID… | World Bank WDI — SP.DYN.CDRT.IN, SP.DYN.LE00.IN (UN WPP) | 2006-2024 | Other |
|---|
people/gini.csv | VERIFIED 2026-10-25: household-survey Gini, 0-100, 2006 = 41.5, 2023 = 33.0. The series stops in 2023. Rosstat's own Gini is published in its… | World Bank WDI — SI.POV.GINI | 2006-2023 | Other |
|---|
people/poverty.csv | VERIFIED 2026-10-25. poverty_national_pct is the share of people below Russia's own poverty line: 2006 = 15.2%, 2015 = 13.5%, 2024 = 7.2%… | World Bank WDI — SI.POV.NAHC (national poverty line) and SI.POV.UMIC | 2006-2024 | Other |
|---|
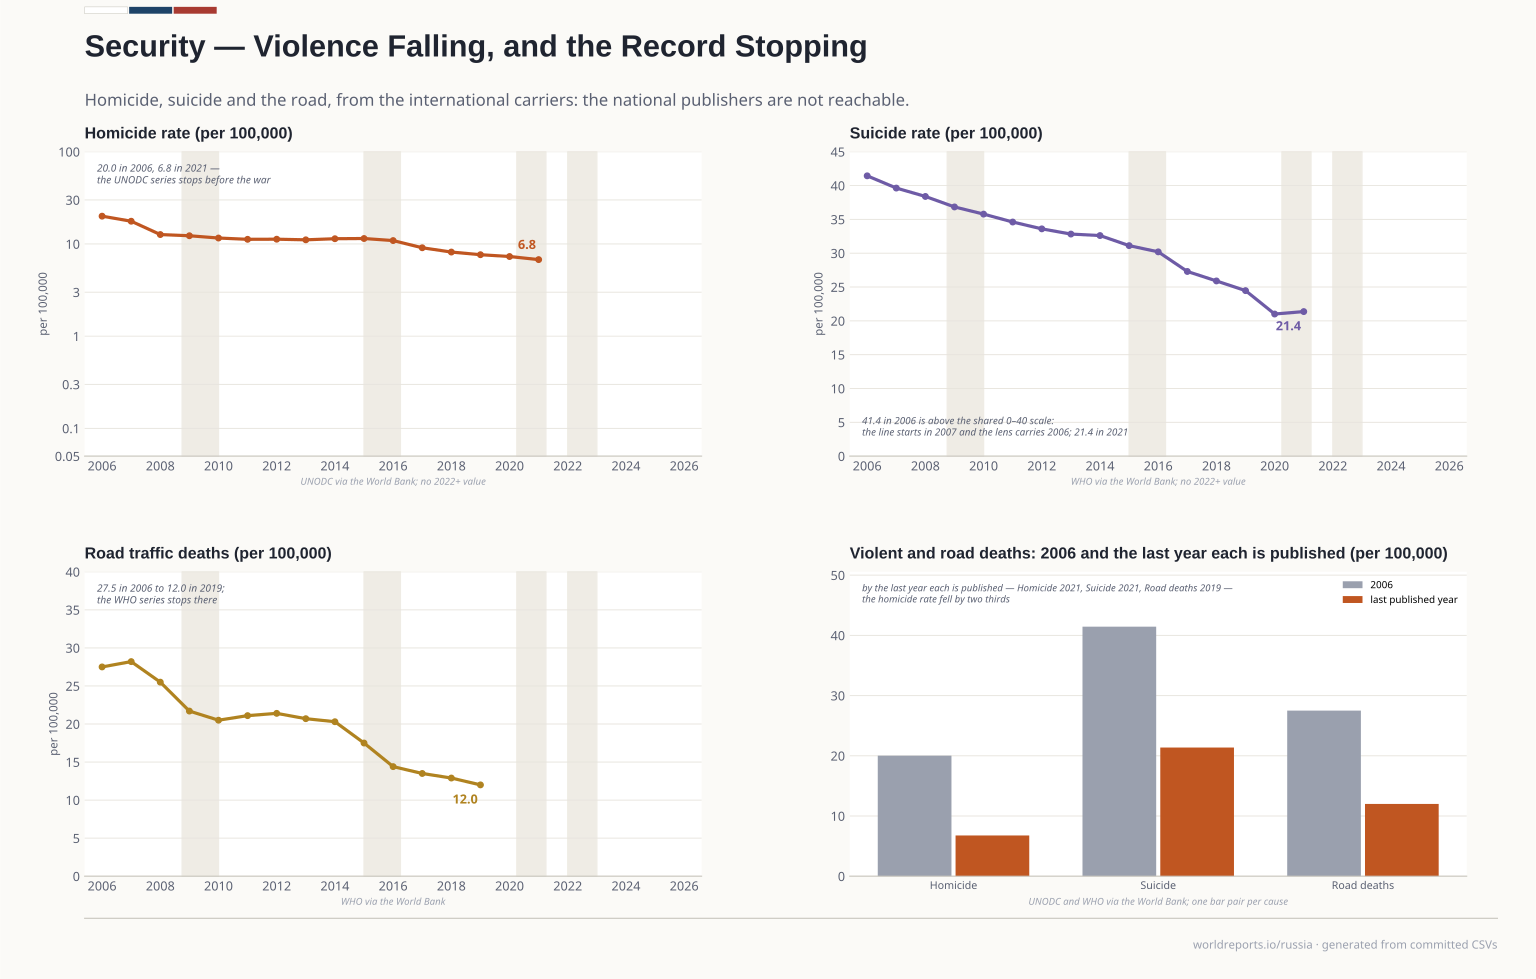
security/security.csv | VERIFIED 2026-10-25: homicide 20.0 per 100,000 in 2006 to 6.8 in 2021; suicide 41.4 to 21.4; road deaths 27.5 in 2006 to 12.0 in 2019. Every series… | UNODC and WHO via the World Bank — VC.IHR.PSRC.P5, SH.STA.SUIC.P5, SH.STA.TRAF.P5 | 2006-2021 | Other |
|---|
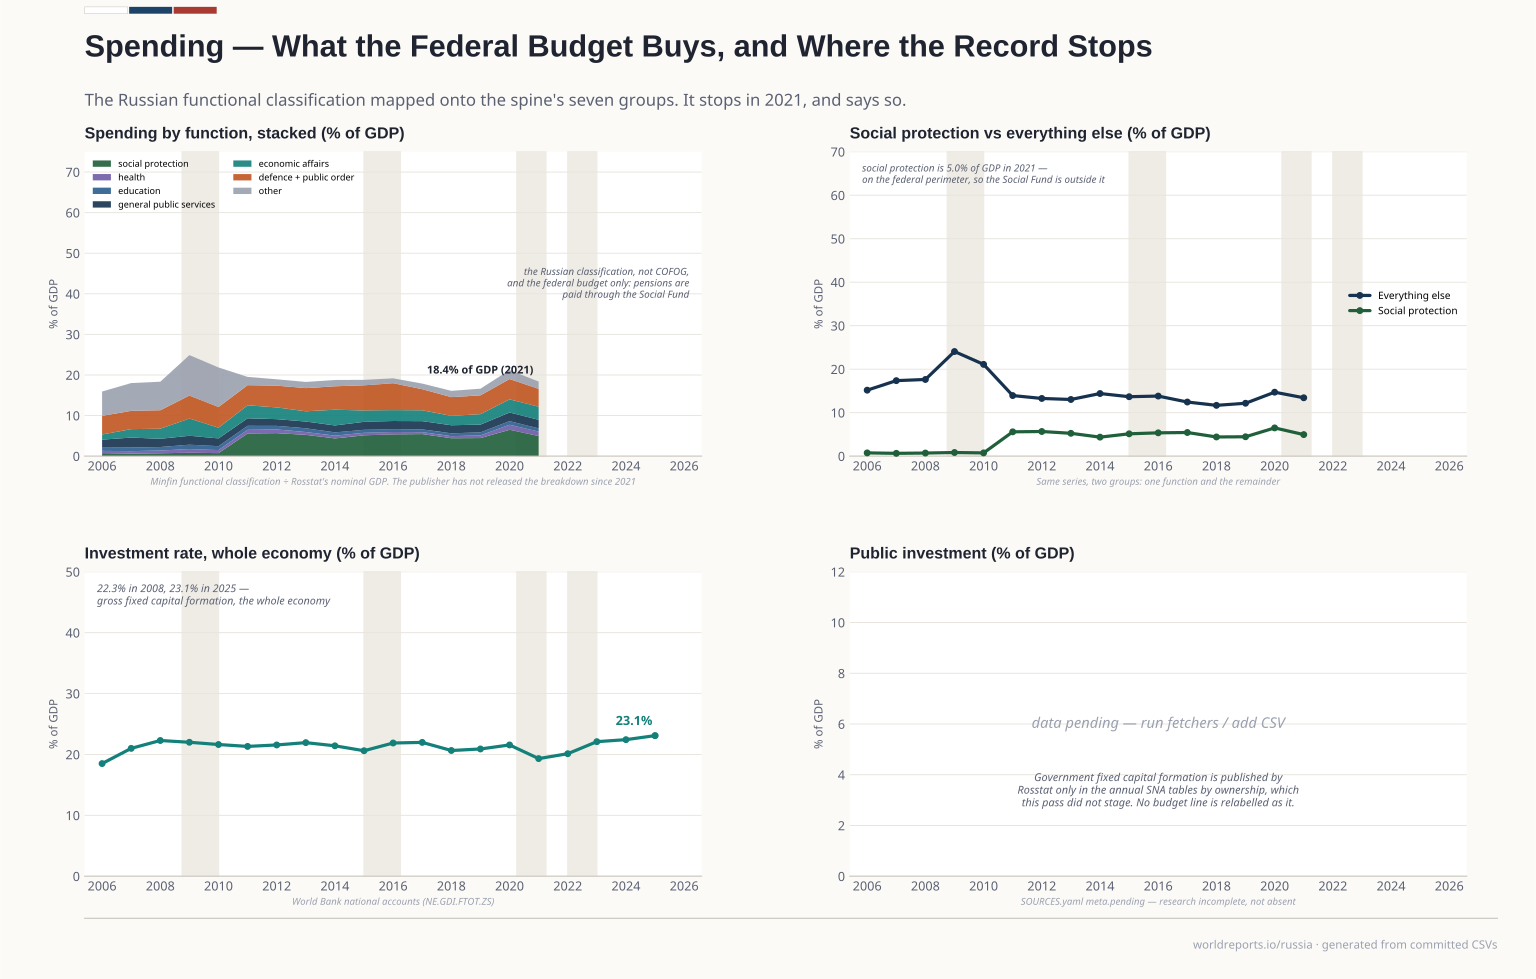
spending/budget_function.csv | VERIFIED 2026-10-25. Fourteen sections of the Russian budget classification, billion roubles, cash basis, federal level, 2006-2021. THE BREAKDOWN… | Ministry of Finance — federal budget expenditure by the national functional classification | 2006-2021 | Official |
|---|
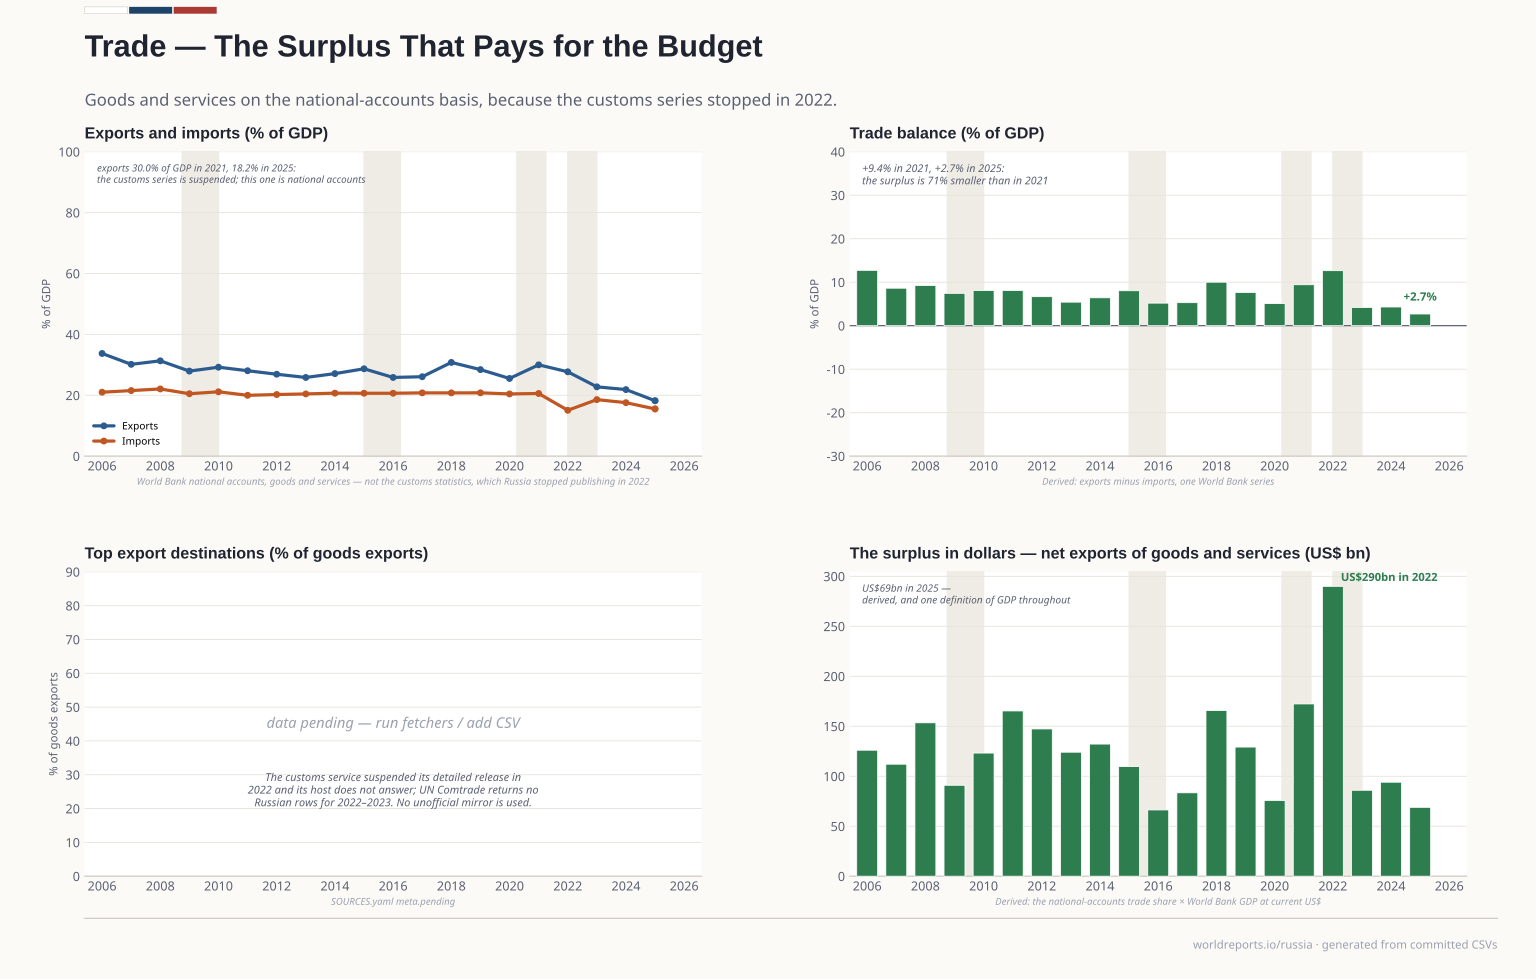
trade/trade.csv | VERIFIED 2026-10-25: 2022 exports 27.5% of GDP on the goods-and- services national-accounts basis. This is NOT the customs series. Russia suspended… | World Bank WDI — NE.EXP.GNFS.ZS, NE.IMP.GNFS.ZS (goods and services, national accounts) | 2006-2025 | Other |
|---|
world/gdp_per_person.csv | VERIFIED 2026-10-25, current US$, 2025 = US$17,546.6. The denominator is the UN population in demography/population_wb.csv, which does not carry the… | World Bank WDI — NY.GDP.PCAP.CD | 2006-2025 | Other |
|---|
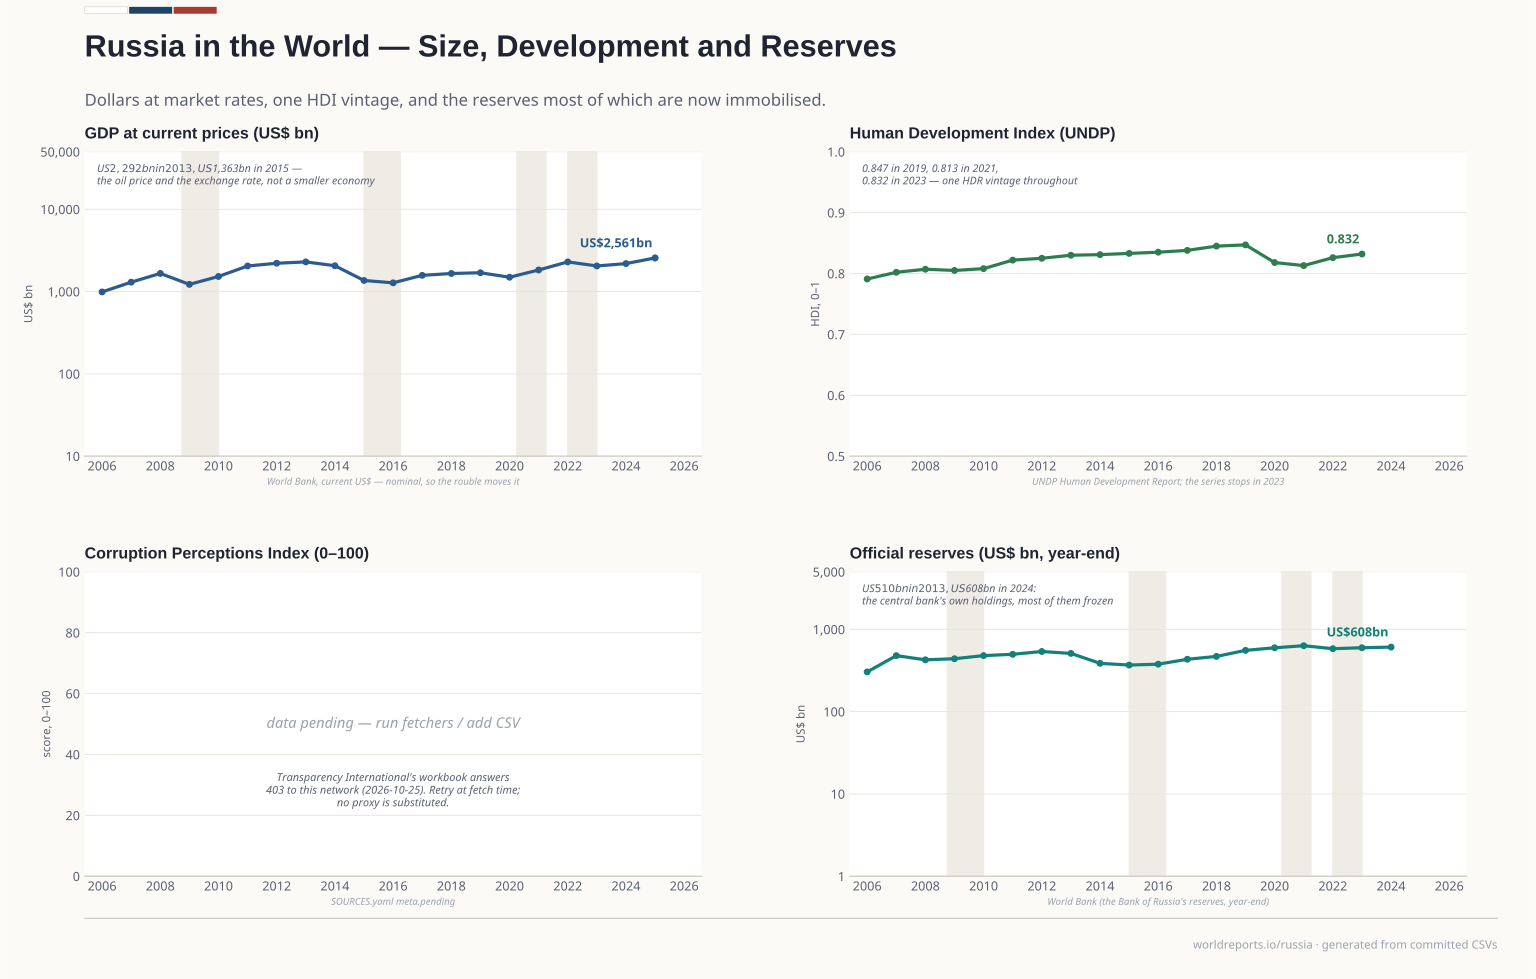
world/gdp_usd.csv | VERIFIED 2026-10-25, current US$. 2013 = US$2,292.5bn (the pre-2014 peak), 2015 = US$1,363.5bn (the rouble's halving), 2022 = US$2,292.5bn and 2025 =… | World Bank WDI — NY.GDP.MKTP.CD | 2006-2025 | Other |
|---|
world/hdi.csv | VERIFIED 2026-10-25, one vintage (HDR 2025) throughout — the HDR recomputes the whole back-series at each methodology change, so a mixed vintage… | UNDP Human Development Report 2025 — HDI time series | 2006-2023 | Official |
|---|
world/reserves.csv | VERIFIED 2026-10-25, year-end, current US$ including gold. 2024 = US$608.4bn. About half the stock was immobilised by sanctions in 2022 — the level… | World Bank WDI — FI.RES.TOTL.CD | 2006-2024 | Other |
|---|
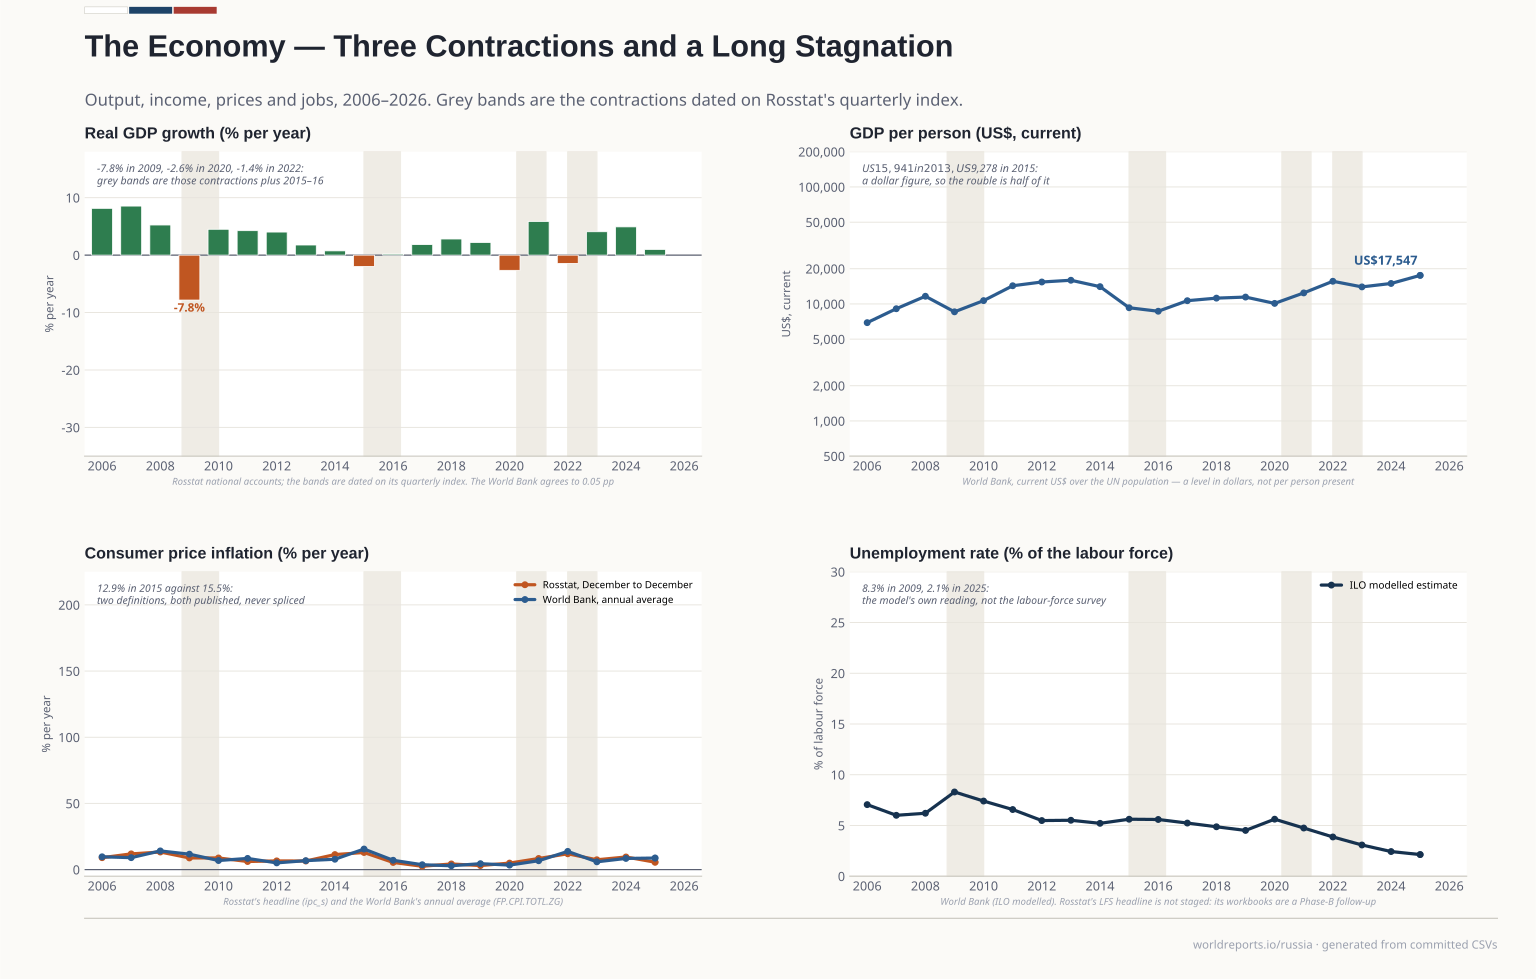 Plate 01