Poland

12 plates of official data, 2006-2026

Every figure on this page comes from a publisher that names its definition — the Central Statistical Office (GUS) for the national accounts, prices, trade and population, the National Bank of Poland for the reference rate and the exchange rates, and Eurostat, the World Bank and the BIS for the comparison layer — and every plate is regenerated from committed CSVs, so the charts and the numbers here cannot drift apart. Poland is a story of catch-up: the fastest growth in the Union, the only economy that did not fall into recession in 2009, a 14.4% inflation peak in 2022, and a residence register that did not see the million refugees of 2022 because refugees did not register a permanent address. The population balance and the temporary-protection stock show that inflow; the register does not. Two populations, two trade perimeters and two unemployment measures are drawn as separate lines and never joined.

Where things stand

The plates

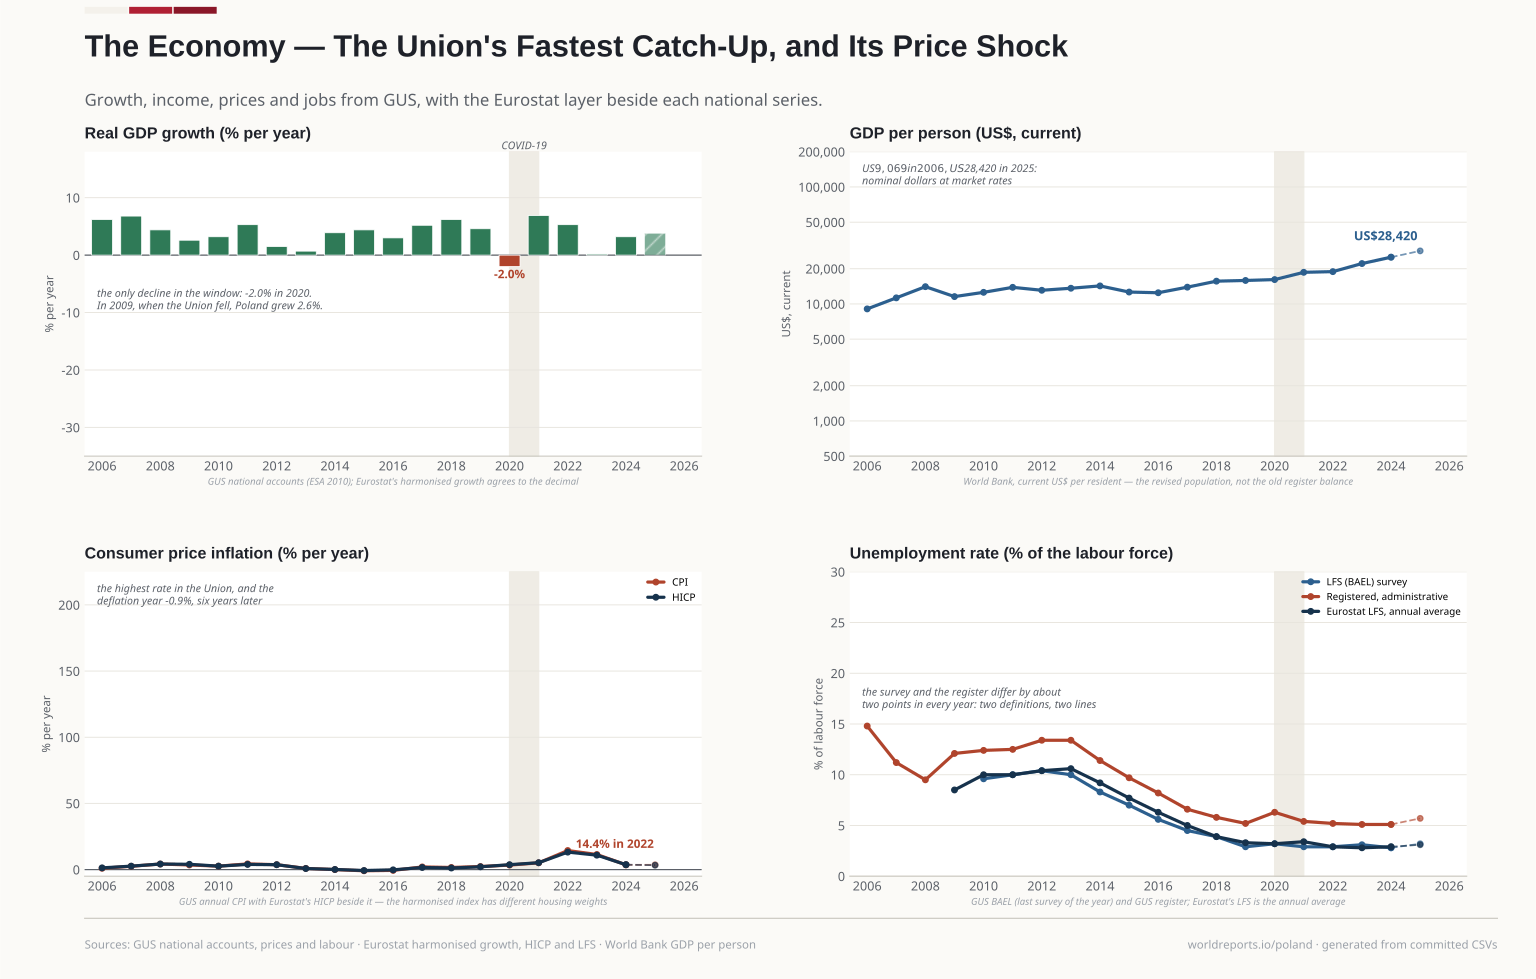
  1. Four panels on the Polish economy. Growth is positive in every year but 2020; GDP per person rises from US$9,069 to US$28,420; inflation peaks at 14.4% in 2022; the registered unemployment rate falls from 14.8% to about 5%. Plate 01

    The Economy — The Union's Fastest Catch-Up, and Its Price Shock

    Growth in every year but 2020, when GDP fell 2.0% — and 2.6% in 2009, the year the Union was in recession. Inflation reached 14.4% in 2022, after deflation of -0.9% in 2015.

    View full size Download vector (SVG)
    Drawn from · 2

    The committed files this plate was read from, as recorded while it was drawn.

    • macro/economy.csvGUS — Roczne wskaźniki makroekonomiczne (ESA 2010 national accounts, prices, labour market); Eurostat — nama_10_gdp, prc_hicp_aind, une_rt_a · 2006-2026
    • macro/gdp_per_person.csvWorld Bank WDI — NY.GDP.PCAP.CD and NY.GDP.MKTP.CD · 2006-2026
    20062024
    3.6% The Economy — The Union's Fastest Catch-Up, and Its Price Shock 2024
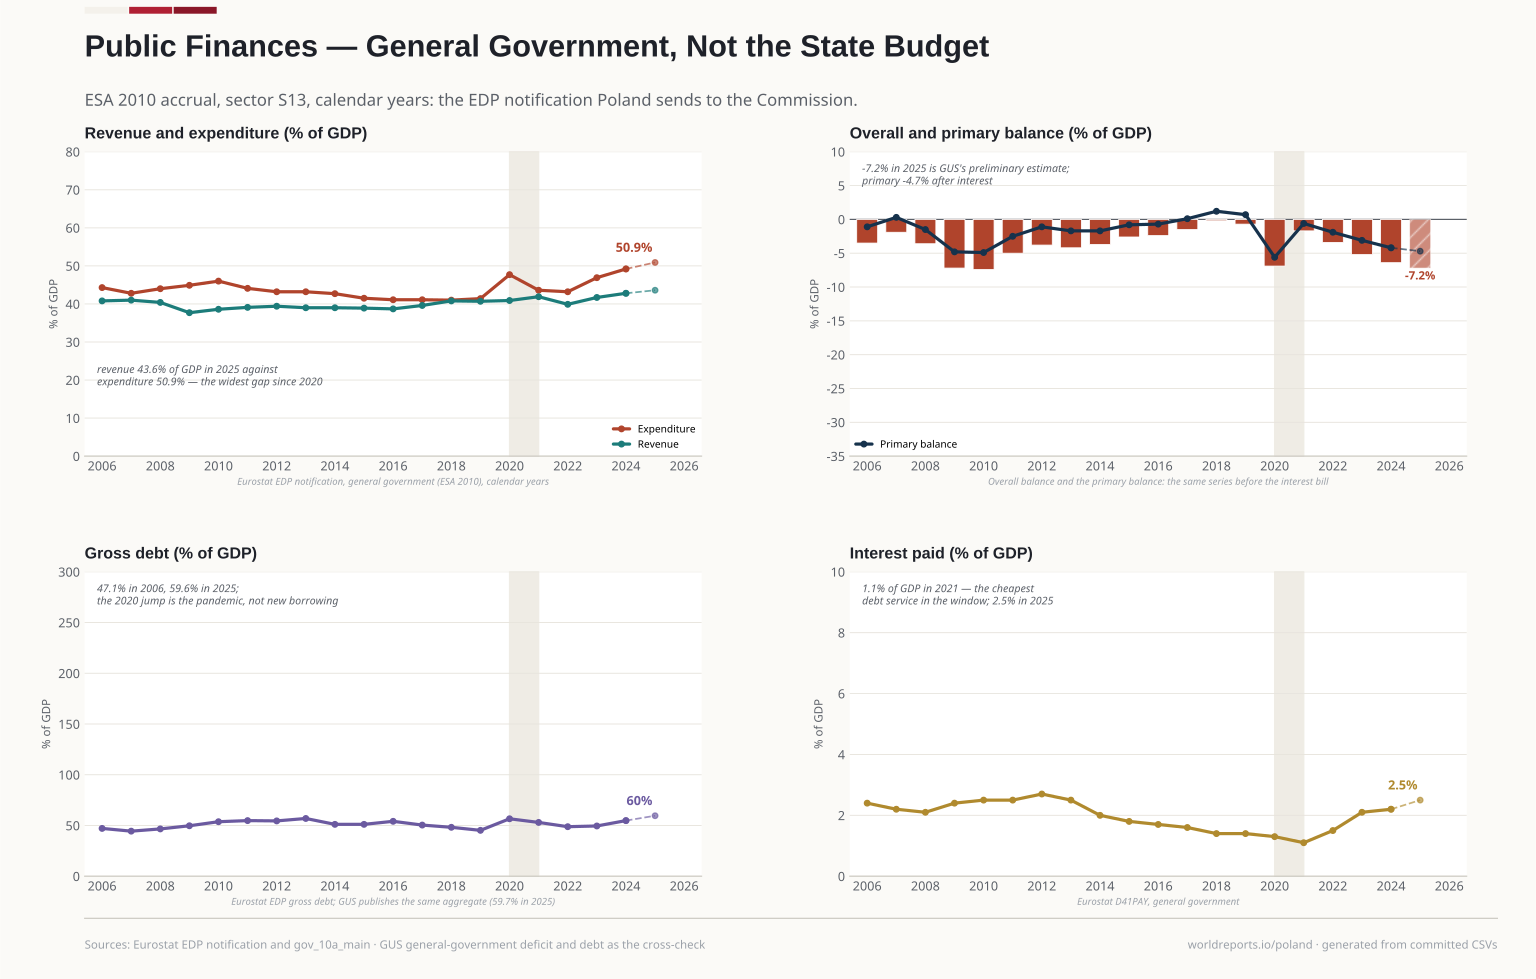
  2. Four panels on general-government finances. The balance is negative in every year, at its worst -7.4% of GDP in 2010 and -7.2% in 2025; debt runs from 47.1% to 59.6% of GDP; interest paid falls from 2.5% to 1.1% in 2021 and back to 2.5%. Plate 02

    Public Finances — General Government, Not the State Budget

    ESA 2010 accrual, sector S13: the EDP notification Poland sends to the Commission. In 2025 spending reaches 50.9% of GDP against revenue of 43.6%, and debt 59.6%.

    View full size Download vector (SVG)
    Drawn from · 1

    The committed files this plate was read from, as recorded while it was drawn.

    • fiscal/fiscal.csvEurostat EDP notification (gov_10dd_edpt1: B9, GD) and gov_10a_main (TR, TE, D41PAY, P51G); GUS general-government deficit and debt as the national cross-check · 2006-2026
    20062024
    54.8% GDP Public Finances — General Government, Not the State Budget 2024
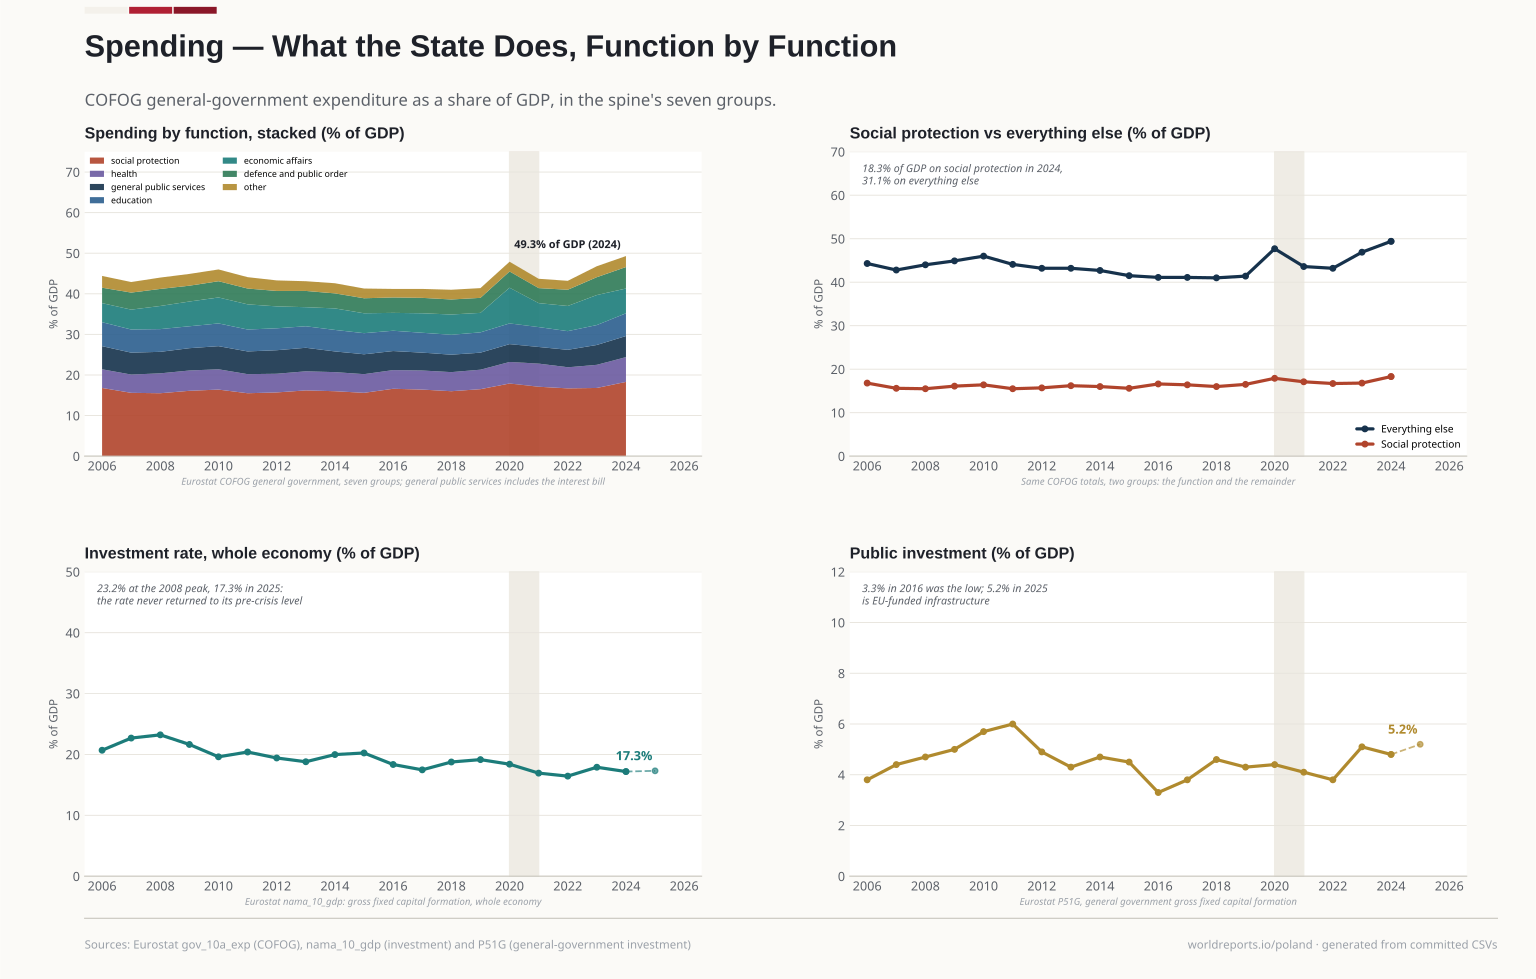
  3. Four panels on public spending. The stacked total grows from 44.3% to 49.4% of GDP; social protection is 18.3% of GDP; public investment runs between 3.3% and 6.0% of GDP. Plate 03

    Spending — What the State Does, Function by Function

    COFOG, by function: social protection is 18.3% of GDP, more than a third of the 49.4% spent in 2024. The investment rate fell from 22.7% of GDP in 2008 to 17.3%.

    View full size Download vector (SVG)
    Drawn from · 1

    The committed files this plate was read from, as recorded while it was drawn.

    • spending/spending.csvEurostat COFOG gov_10a_exp (na_item TE, sector S13) and nama_10_gdp P51G / B1GQ; gov_10a_main P51G · 2006-2026
    20062024
    49.4% GDP Spending — What the State Does, Function by Function 2024
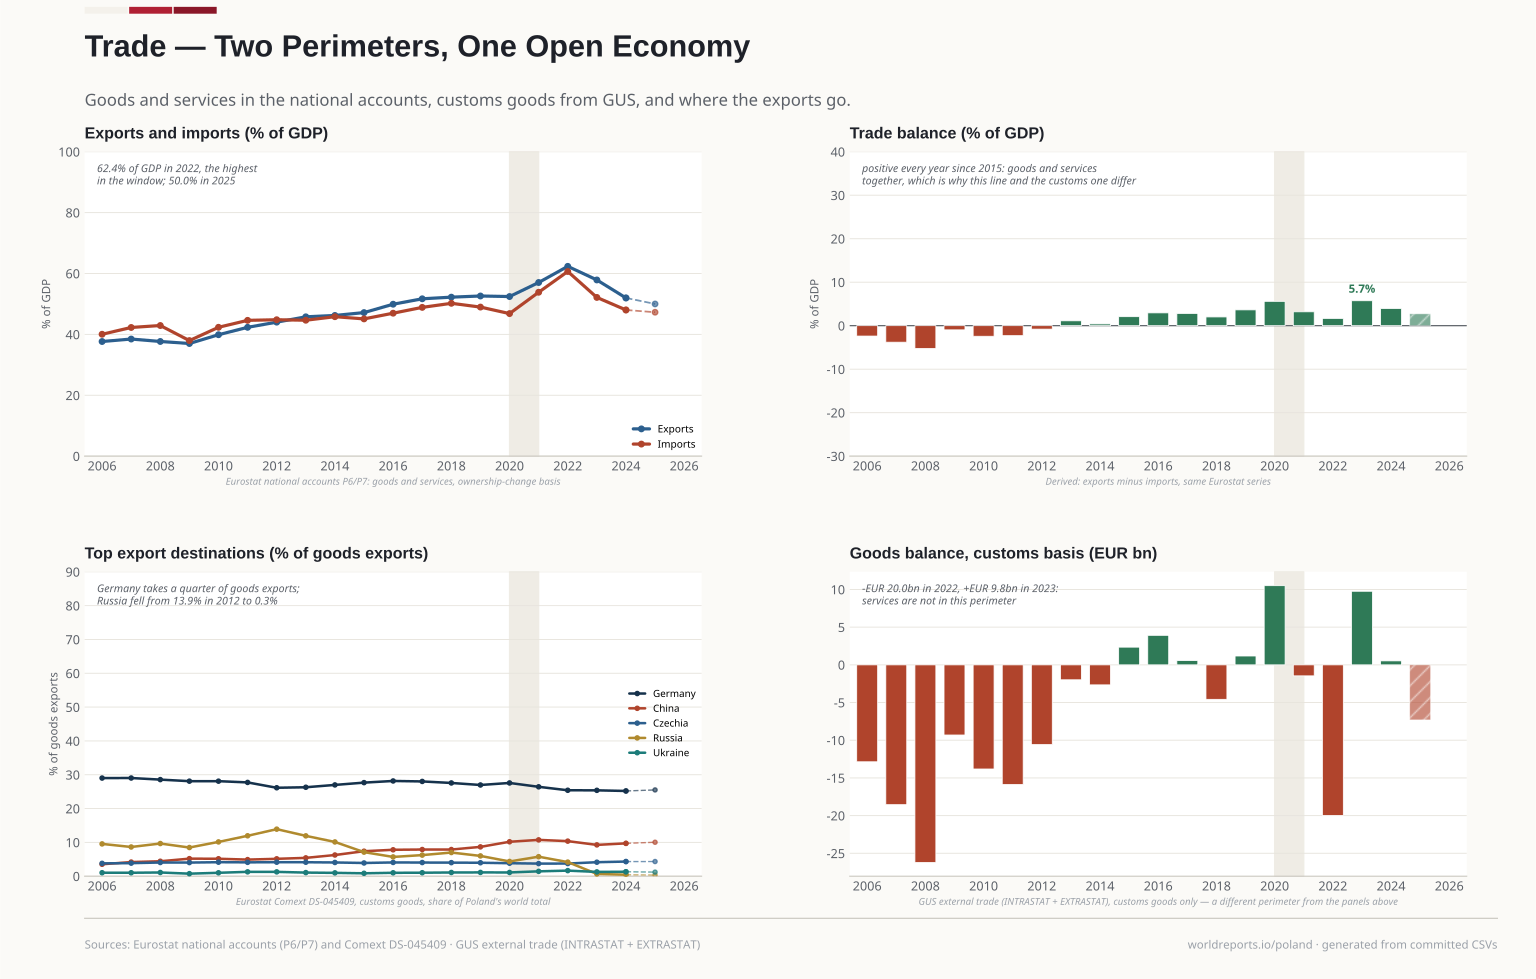
  4. Four panels on trade. Germany takes about a quarter of goods exports, China about 10%, and Russia falls from 13.9% in 2012 to 0.3% in 2025; the customs balance swings around zero while the national-accounts balance stays in surplus. Plate 04

    Trade — Two Perimeters, One Open Economy

    Goods and services exports reached 62.4% of GDP in 2022, imports 60.7%. On the customs perimeter the goods balance fell to -EUR 20.0bn in 2022 and returned to +EUR 9.8bn in 2023 — with no services in it.

    View full size Download vector (SVG)
    Drawn from · 2

    The committed files this plate was read from, as recorded while it was drawn.

    • trade/partners.csvEurostat Comext DS-045409 — Poland's goods exports by partner, all products, EUR · 2006-2026
    • trade/trade.csvEurostat nama_10_gdp P6/P7 (goods and services, national accounts); GUS external trade (customs goods, INTRASTAT/EXTRASTAT) · 2006-2026
    20062024
    52.0% GDP Trade — Two Perimeters, One Open Economy 2024
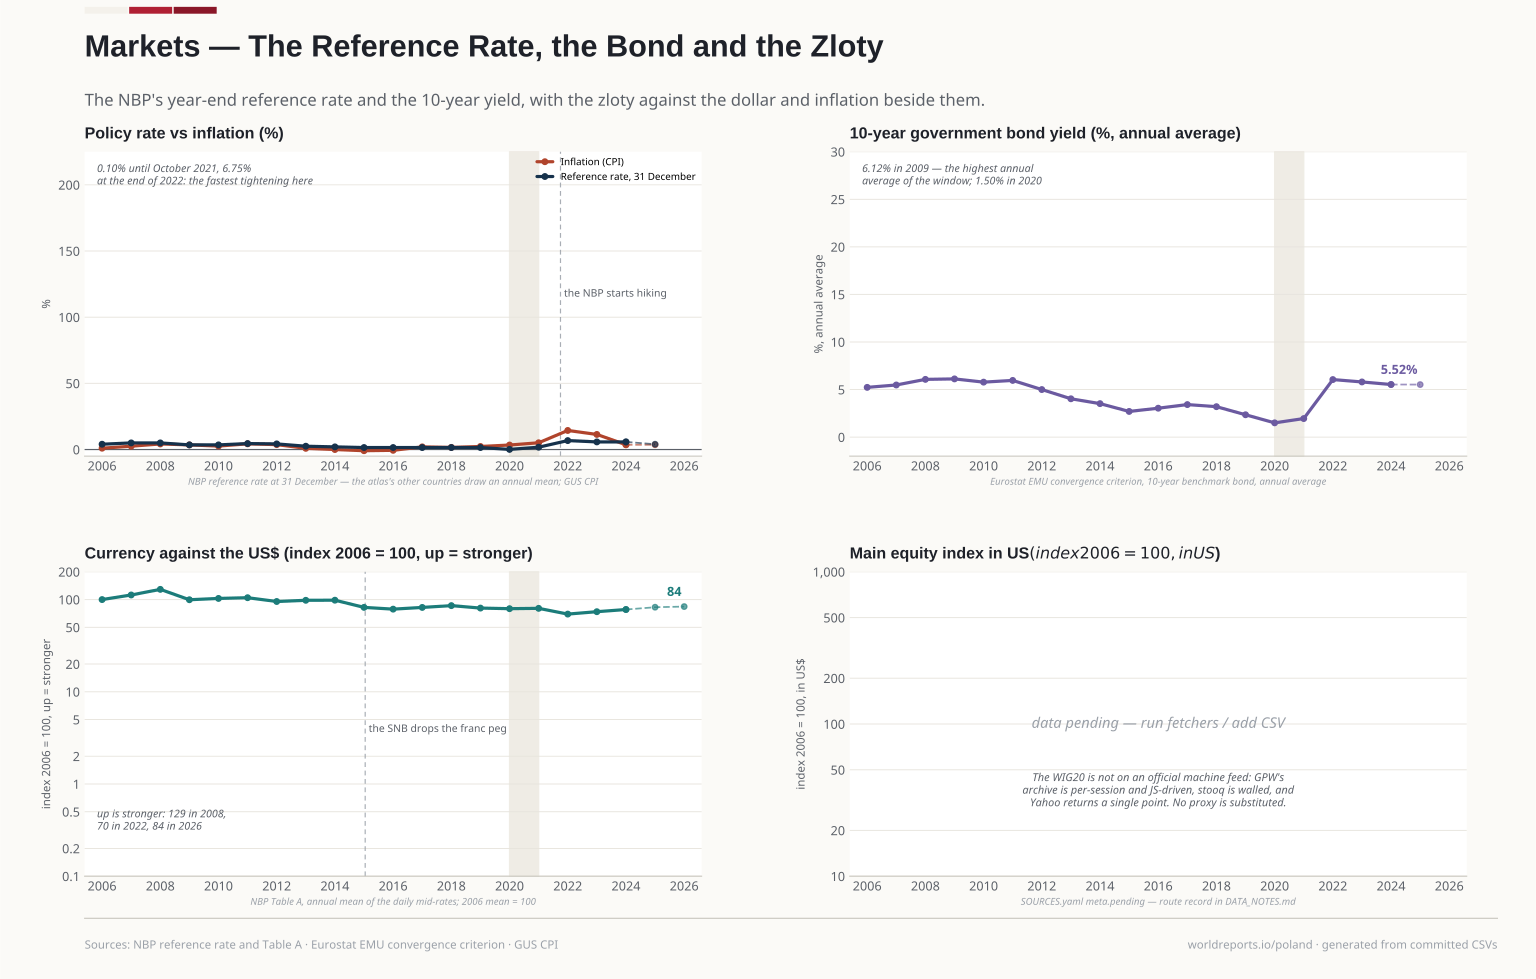
  5. Four panels on Polish markets. The rate and inflation on one scale; the 10-year yield peaks at 6.05% in 2022; the currency index is drawn so that up means stronger; the equity panel stays empty with its reason stated. Plate 05

    Markets — The Reference Rate, the Bond and the Zloty

    The NBP reference rate sat at 0.10% until October 2021 and reached 6.75% at the end of 2022 — against 14.4% inflation. The zloty index fell from 129 in 2008 to 70 in 2022.

    View full size Download vector (SVG)
    Drawn from · 2

    The committed files this plate was read from, as recorded while it was drawn.

    • macro/economy.csvGUS — Roczne wskaźniki makroekonomiczne (ESA 2010 national accounts, prices, labour market); Eurostat — nama_10_gdp, prc_hicp_aind, une_rt_a · 2006-2026
    • markets/markets.csvGUS money table (NBP reference rate at 31 December, official mid-rates); Eurostat irt_lt_mcby_a; NBP Web API Table A (daily mid-rates, annual mean) · 2006-2026
    20062024
    5.8% Markets — The Reference Rate, the Bond and the Zloty 2024
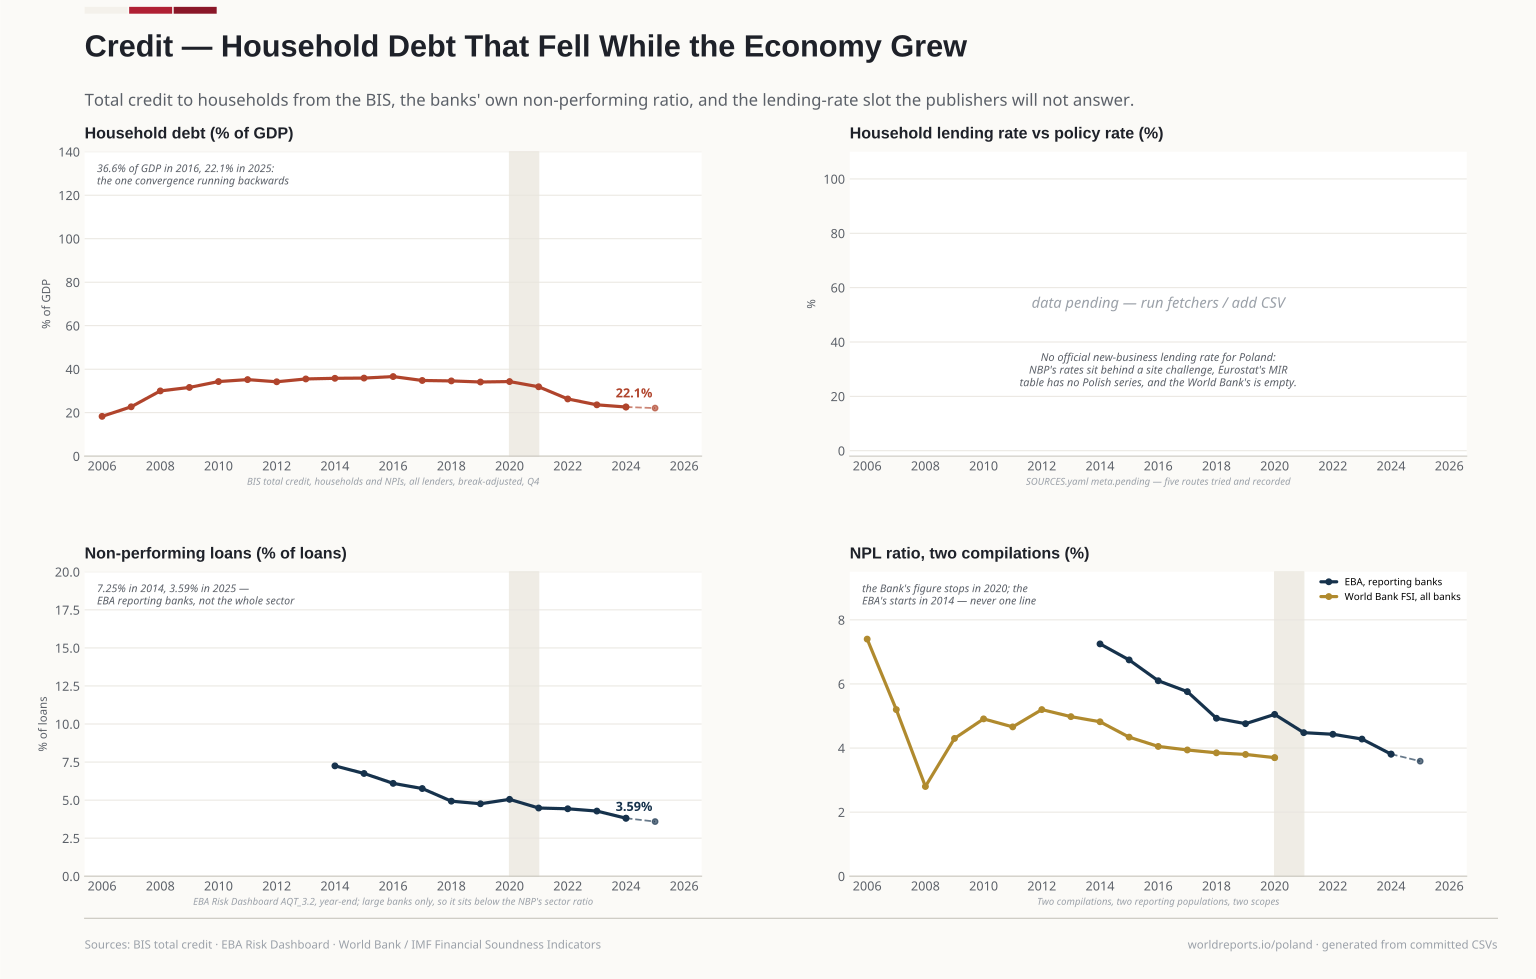
  6. Four panels on household credit. Debt as a share of GDP rises to 35.9% in 2015 and falls to 22.1%; the lending-rate panel stays empty because no official series is on a machine feed; non-performing loans fall from 7.25% to 3.59%. Plate 06

    Credit — Household Debt That Fell While the Economy Grew

    Household debt rose from 18.3% of GDP in 2006 to 35.9% in 2015 and fell to 22.1% in 2025 — the one convergence running backwards. Non-performing loans: 7.25% in 2014, 3.59% in 2025.

    View full size Download vector (SVG)
    Drawn from · 1

    The committed files this plate was read from, as recorded while it was drawn.

    • credit/credit.csvBIS total credit WS_TC (household debt, % of GDP); EBA Risk Dashboard AQT_3.2 (NPL ratio); World Bank GFDD.SI.02 (cross-check, ends 2020) · 2006-2026
    20062024
    22.6% GDP Credit — Household Debt That Fell While the Economy Grew 2024
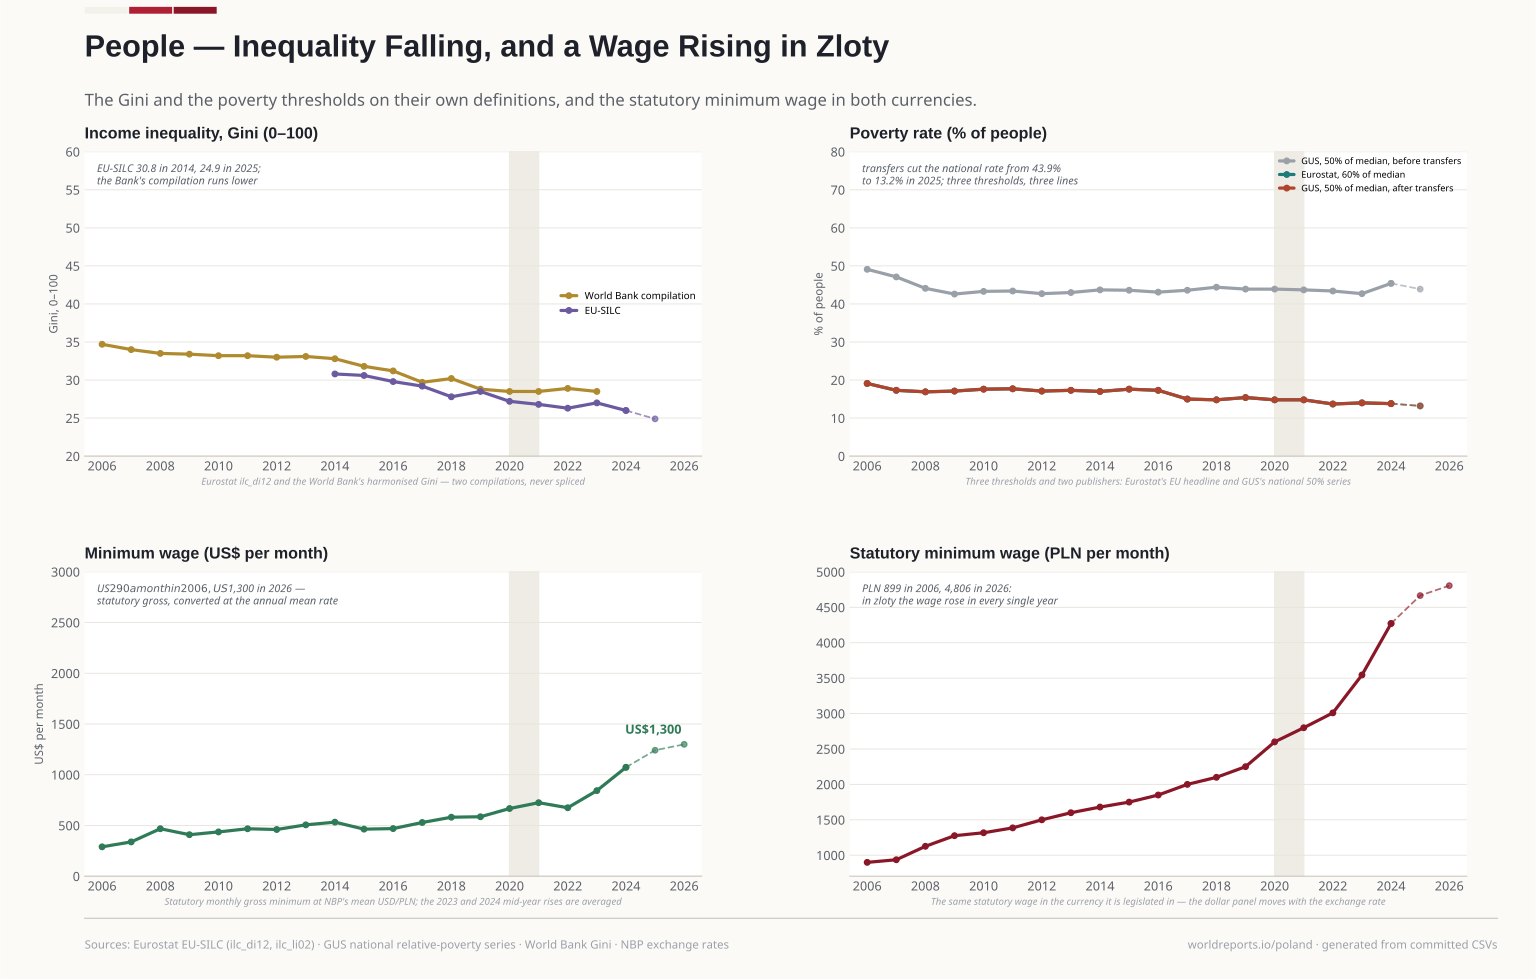
  7. Four panels on incomes. The Gini falls, relative poverty falls, the minimum wage in dollars rises from US$290 to US$1,241, and in zloty it rises in every year without exception. Plate 07

    People — Inequality Falling, and a Wage Rising in Zloty

    The EU-SILC Gini fell from 30.8 in 2014 to 24.9 in 2025. Transfers cut the national poverty rate from 45.4% to 13.8% in 2024, and the minimum wage rises from 899 to 4,666 zloty a month.

    View full size Download vector (SVG)
    Drawn from · 1

    The committed files this plate was read from, as recorded while it was drawn.

    • people/people.csvEurostat ilc_di12 (Gini) and ilc_li02 (AROP 60%); GUS EU-SILC relative poverty at 50% of median; Eurostat earn_mw_cur (statutory minimum wage, national currency) · 2006-2026
    20142024
    26.00 People — Inequality Falling, and a Wage Rising in Zloty 2024
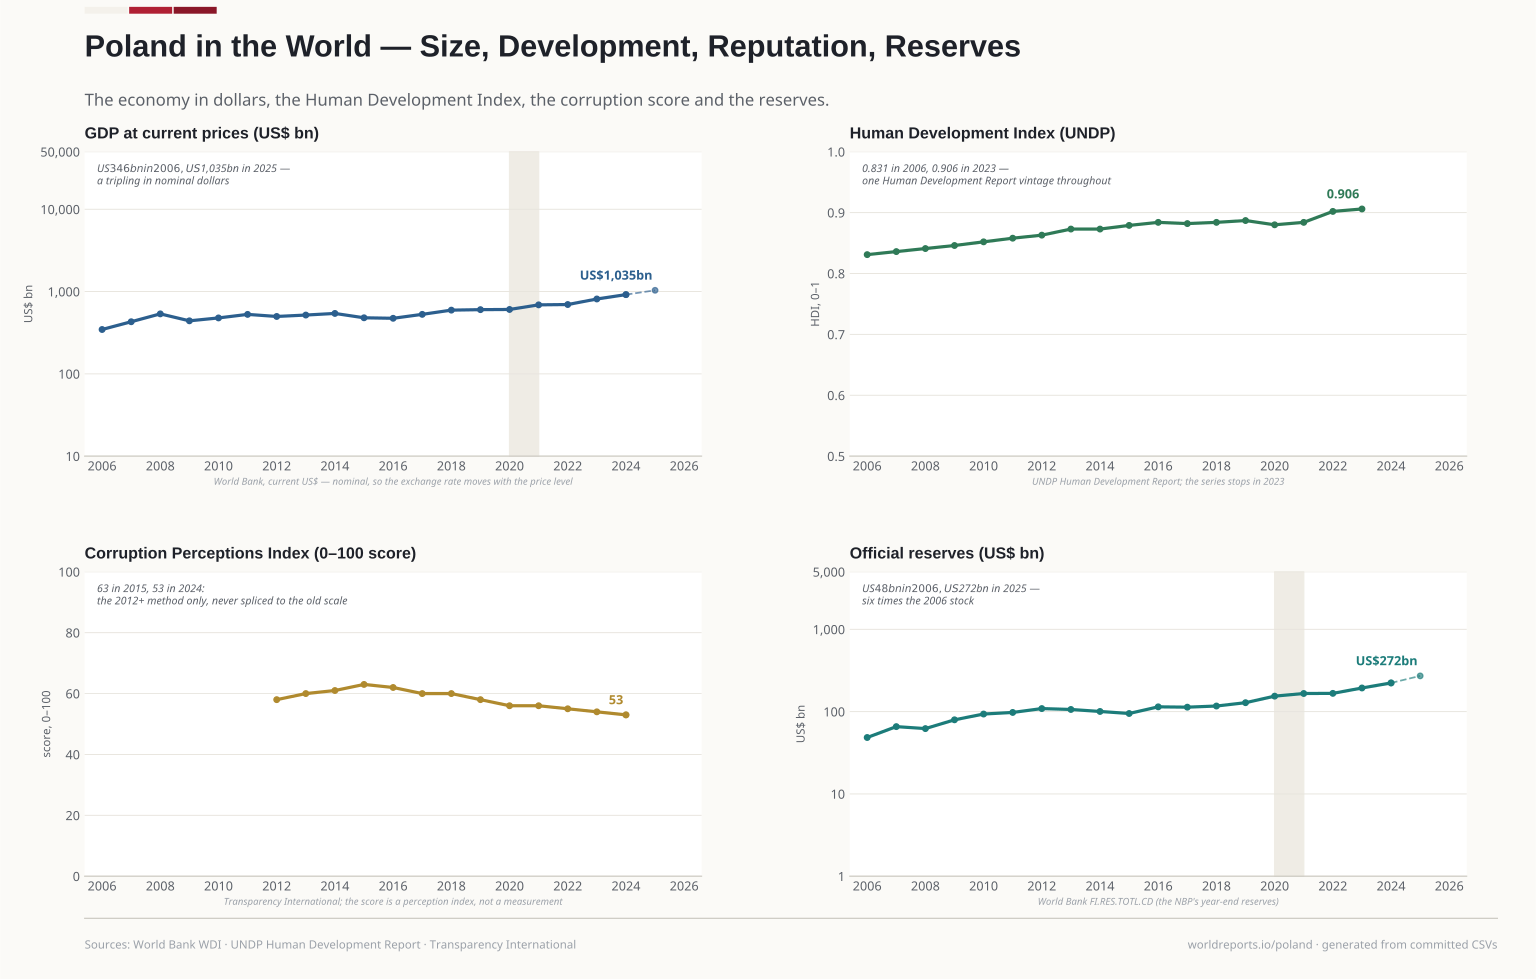
  8. Four panels on Poland's place in the world. GDP in dollars on a log scale, the HDI from 0.831 to 0.906, the corruption score 58 to 53 (post-2012 method only), reserves from US$48bn to US$272bn. Plate 08

    Poland in the World — Size, Development, Reputation, Reserves

    GDP in current dollars rose from US$346bn in 2006 to US$1,035bn in 2025, and the Human Development Index reached 0.906 in 2023. Reserves rose sixfold.

    View full size Download vector (SVG)
    Drawn from · 1

    The committed files this plate was read from, as recorded while it was drawn.

    • world/world.csvWorld Bank WDI (NY.GDP.MKTP.CD, FI.RES.TOTL.CD); UNDP HDR 2025 (HDI); Transparency International CPI 2024 edition (score) · 2006-2026
    20062024
    US$ 918bn Poland in the World — Size, Development, Reputation, Reserves 2024
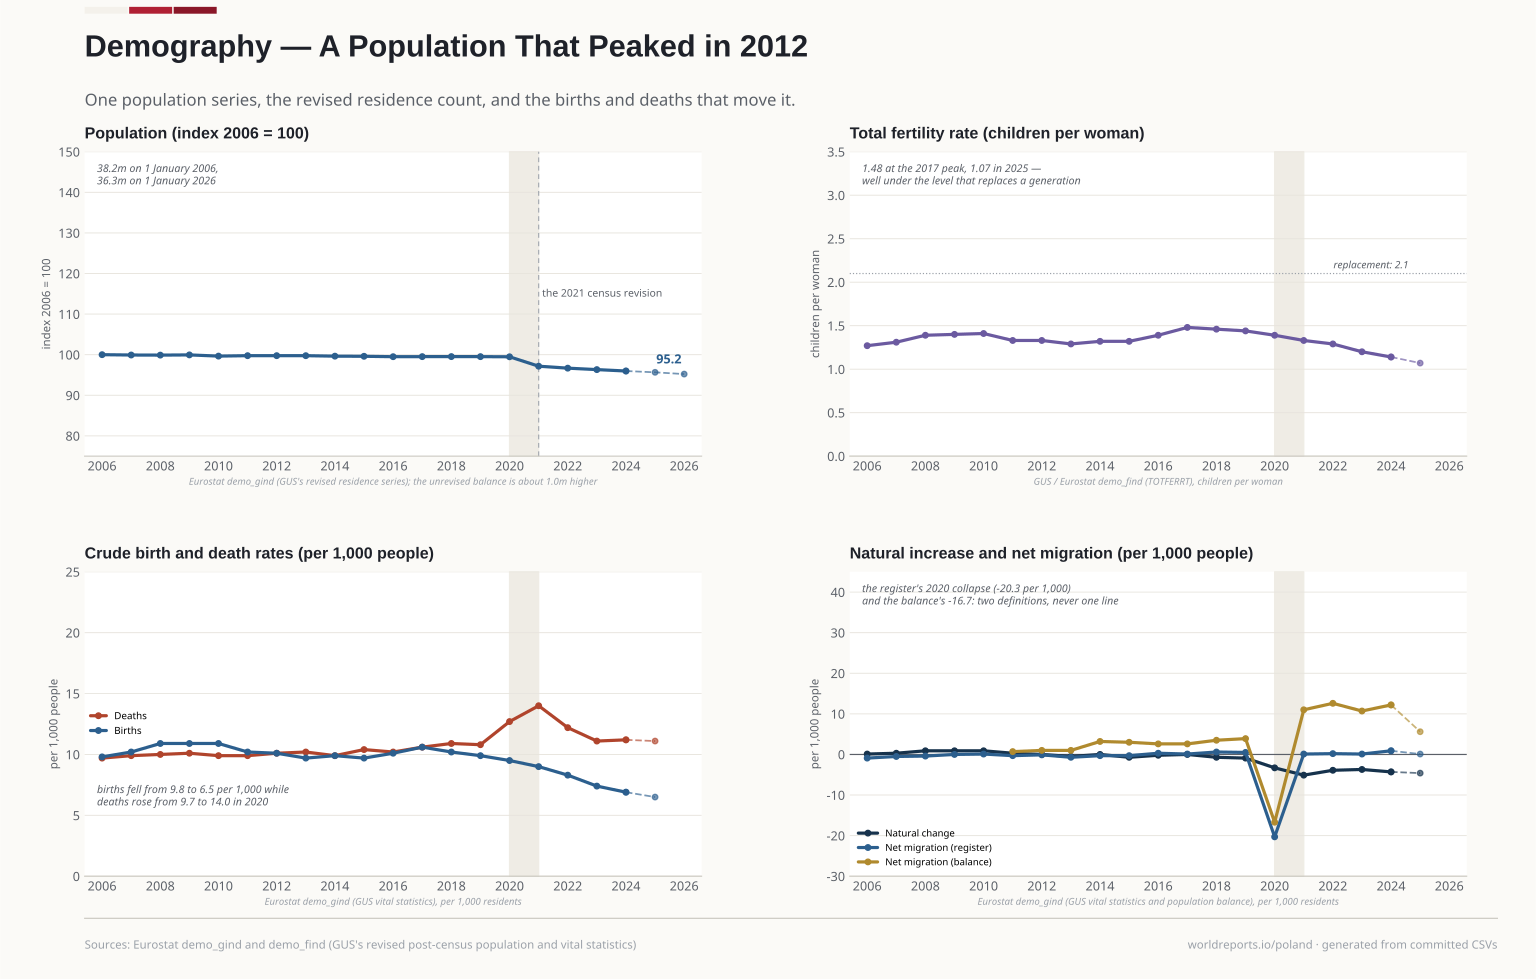
  9. Four panels on population. The index falls from 100 to 95.2; the 2021 step is the census revision, not a demographic event; births per 1,000 fall and deaths rise to 14.0 in 2021; the migration panel stays empty with its reason stated. Plate 09

    Demography — A Population That Peaked in 2012

    38.2m residents on 1 January 2006, 36.3m on 1 January 2026. Fertility fell from 1.41 to 1.07 children per woman — far below replacement.

    View full size Download vector (SVG)
    Drawn from · 1

    The committed files this plate was read from, as recorded while it was drawn.

    • demography/demography.csvEurostat demo_gind (population 1 January, birth/death/natural-change/migration rates on the revised residence definition) and demo_find (TFR); GUS births, TFR and life expectancy · 2006-2026
    20062024
    95.97 Demography — A Population That Peaked in 2012 2024
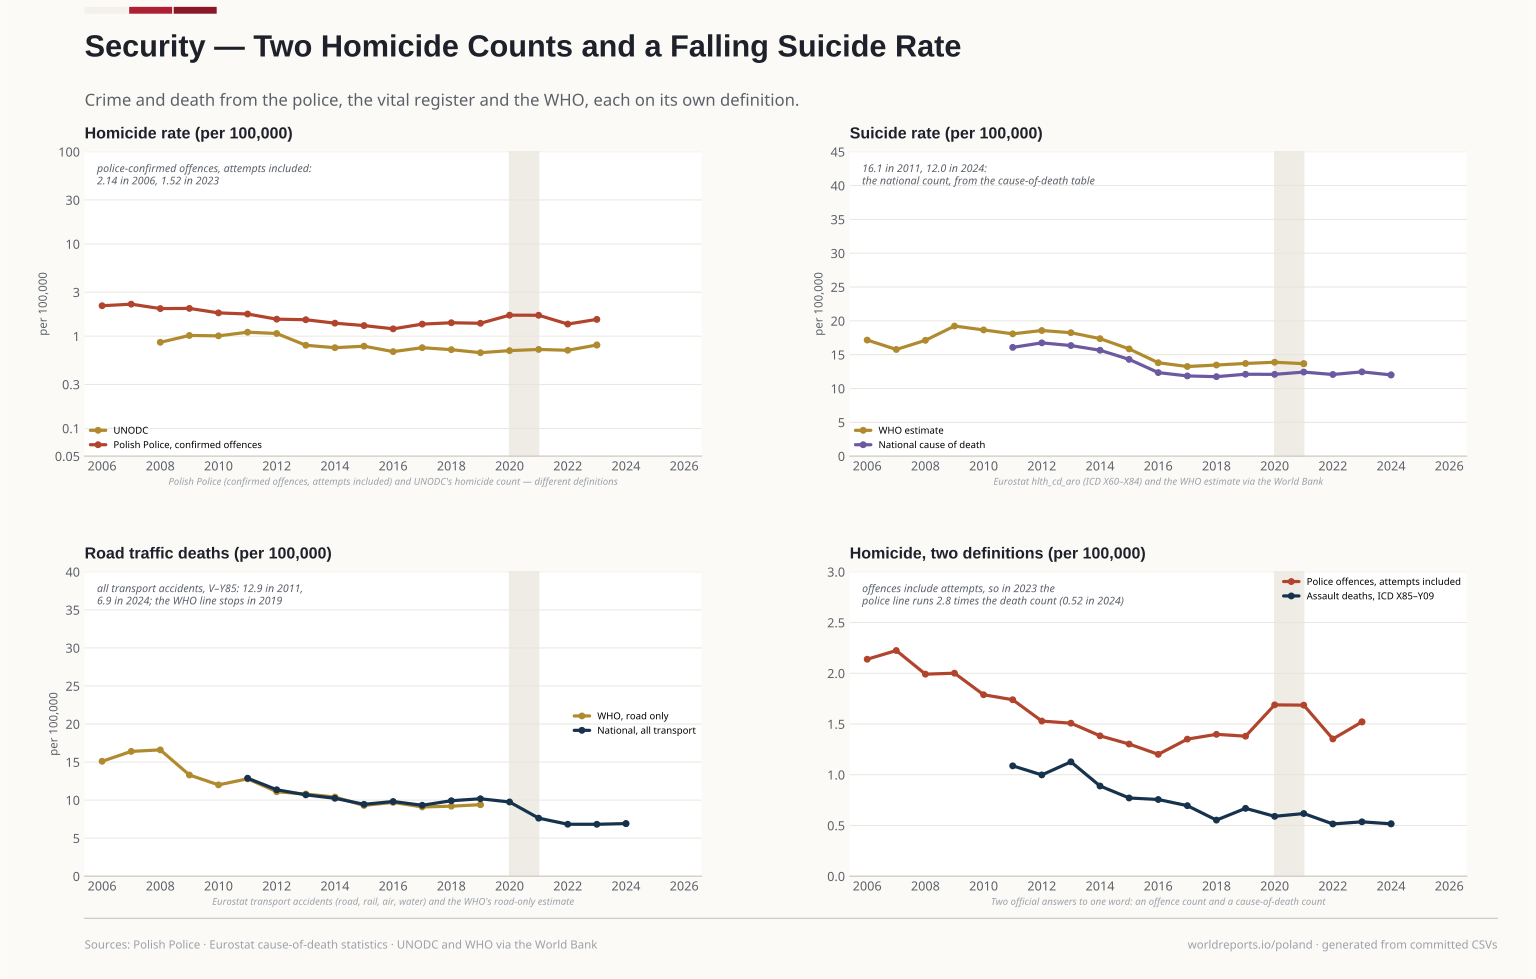
  10. Four panels on violence and accidents. Police homicides fall from 2.14 to 1.52 per 100,000; suicides from 16.7 to 12.0; transport deaths from 12.9 to 6.9; the lens shows the police count running about three times the death count. Plate 10

    Security — Two Homicide Counts and a Falling Suicide Rate

    The police recorded 2.14 confirmed homicide offences per 100,000 in 2006 and 1.52 in 2023. Assault deaths are a different number entirely — and a different line.

    View full size Download vector (SVG)
    Drawn from · 1

    The committed files this plate was read from, as recorded while it was drawn.

    • security/security.csvPolish Police (homicide, confirmed offences); Eurostat hlth_cd_aro (assault, self-harm and transport deaths); World Bank/WHO-UNODC estimates for the comparable rates · 2006-2026
    20062023
    1.52/100k Security — Two Homicide Counts and a Falling Suicide Rate 2023
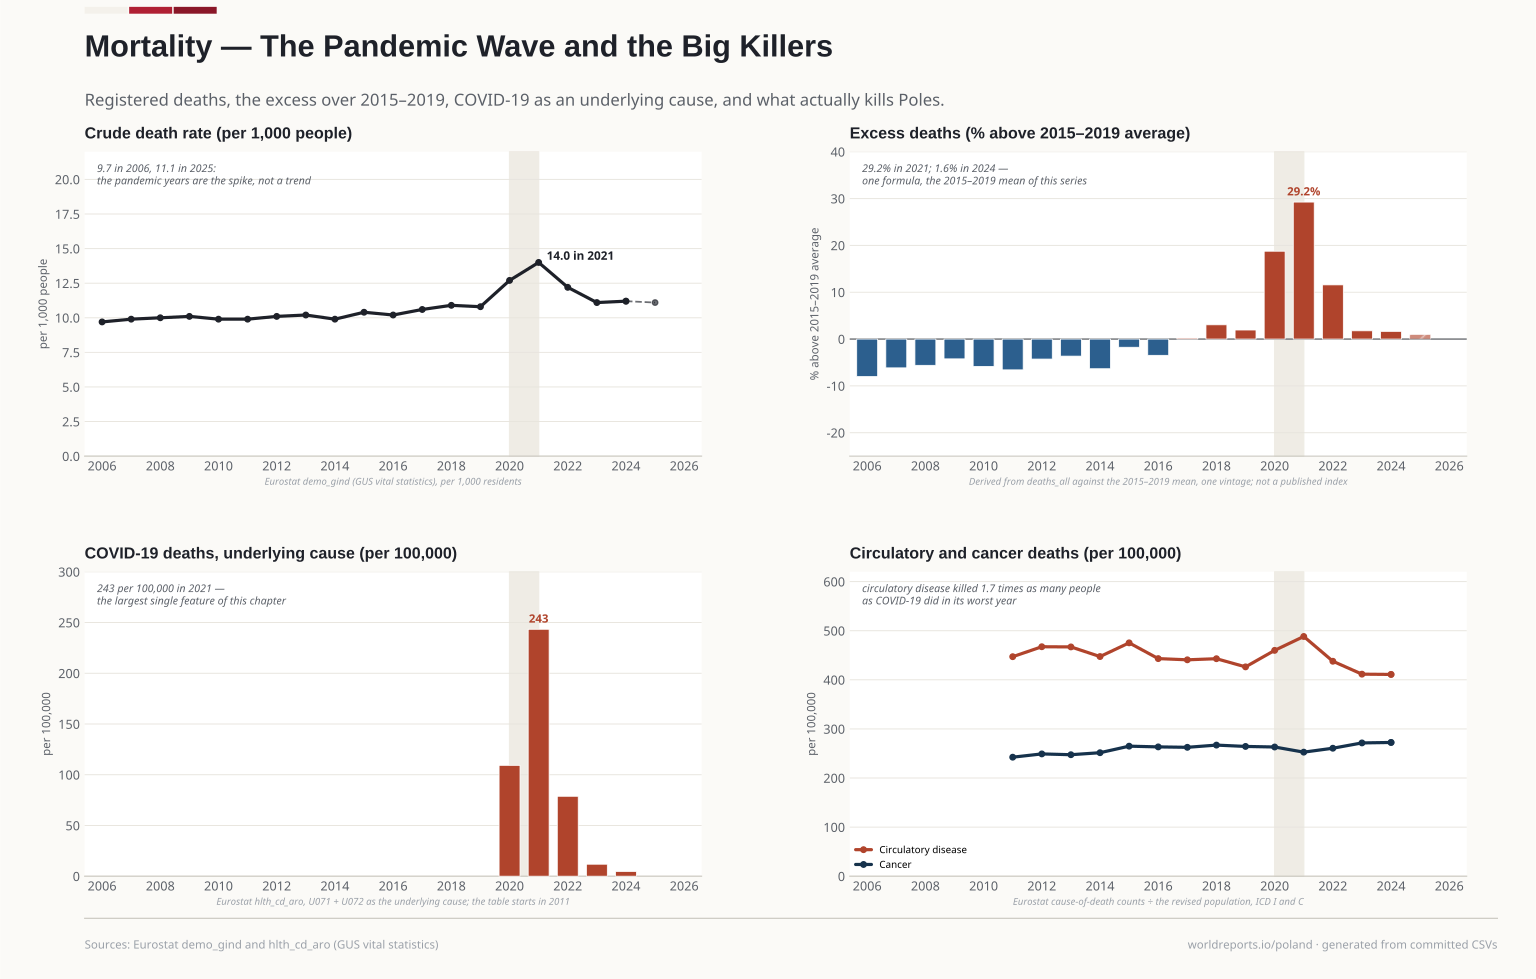
  11. Four panels on mortality. The death rate rises from 9.7 to 14.0 in 2021 and falls to 11.2; excess deaths reach 29.2%; COVID-19 is 243 per 100,000; circulatory disease and cancer kill far more. Plate 11

    Mortality — The Pandemic Wave and the Big Killers

    Deaths per 1,000 rose to 14.0 in 2021, 29.2% above the 2015–2019 average. COVID-19 as an underlying cause killed 243 people per 100,000.

    View full size Download vector (SVG)
    Drawn from · 2

    The committed files this plate was read from, as recorded while it was drawn.

    • demography/demography.csvEurostat demo_gind (population 1 January, birth/death/natural-change/migration rates on the revised residence definition) and demo_find (TFR); GUS births, TFR and life expectancy · 2006-2026
    • mortality/mortality.csvEurostat demo_gind (deaths, crude rate) and hlth_cd_aro (deaths by underlying cause, ICD-10) · 2006-2026
    20062024
    408,504 Mortality — The Pandemic Wave and the Big Killers 2024
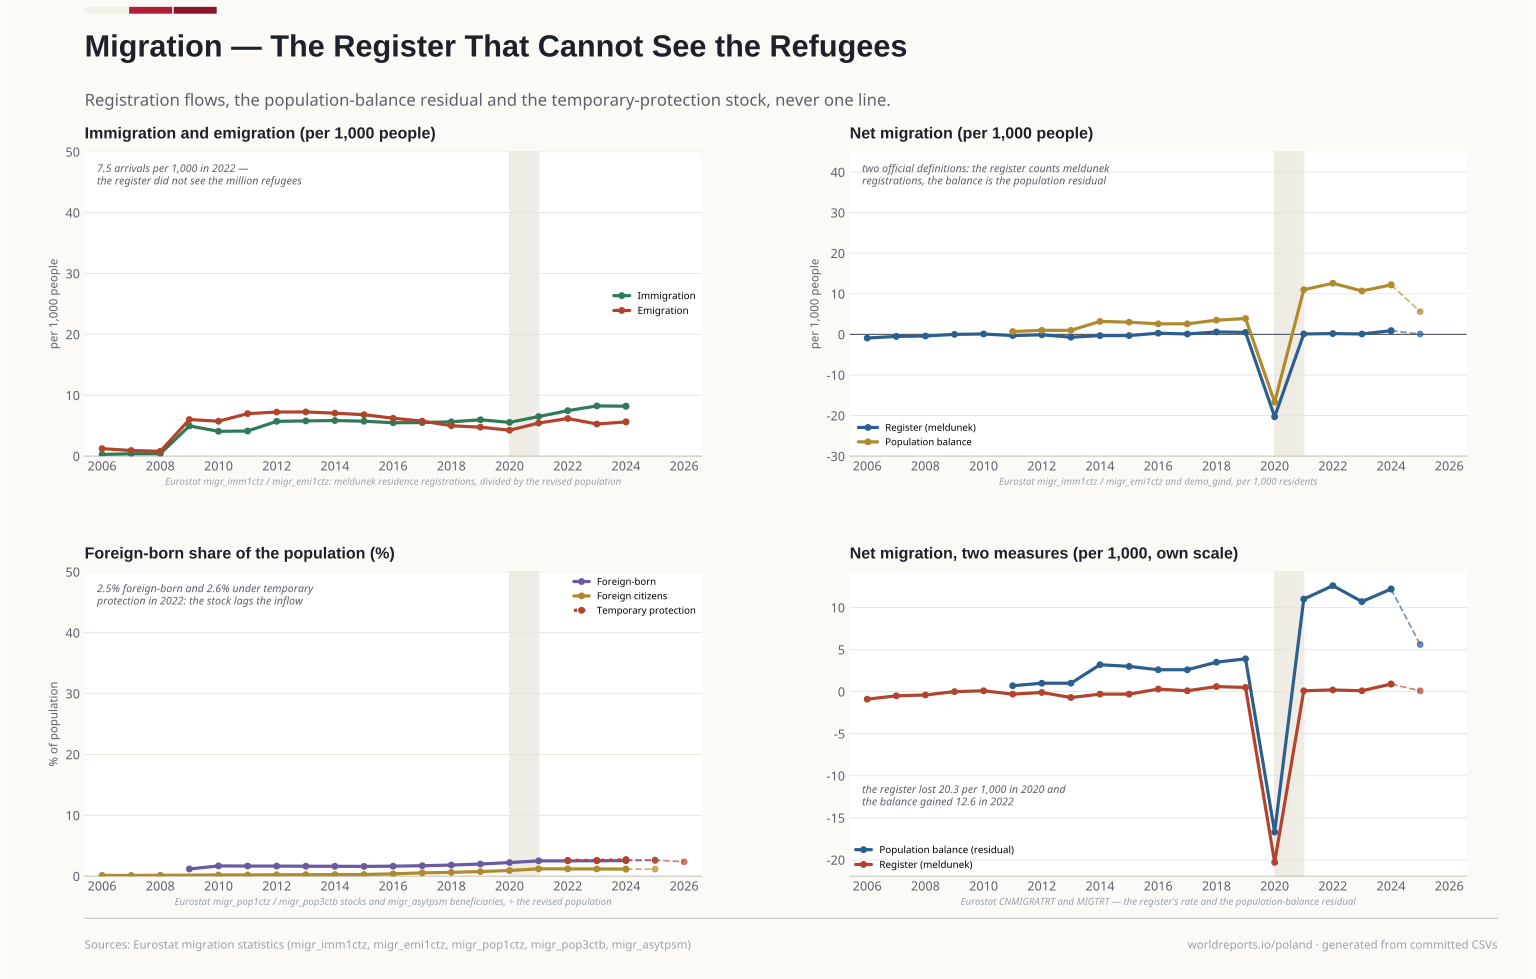
  12. Four panels on migration. The register sees 7.5 arrivals per 1,000 in 2022; the net-migration panel stays empty because both official series leave the shared scale in 2020; the lens draws both on their own scale. Plate 12

    Migration — The Register That Cannot See the Refugees

    The residence register recorded 7.5 arrivals per 1,000 in 2022 — about a tenth of the inflow. Foreign-born residents are 2.5% of the population, and people under temporary protection 2.6%.

    View full size Download vector (SVG)
    Drawn from · 2

    The committed files this plate was read from, as recorded while it was drawn.

    • demography/demography.csvEurostat demo_gind (population 1 January, birth/death/natural-change/migration rates on the revised residence definition) and demo_find (TFR); GUS births, TFR and life expectancy · 2006-2026
    • migration/migration.csvEurostat migr_imm1ctz / migr_emi1ctz (registered flows), migr_pop1ctz / migr_pop3ctb (citizenship and country-of-birth stocks), migr_asytpsm (temporary protection), migr_asyappctza, migr_resfirst, migr_acq · 2006-2026
    20062024
    8.21 Migration — The Register That Cannot See the Refugees 2024