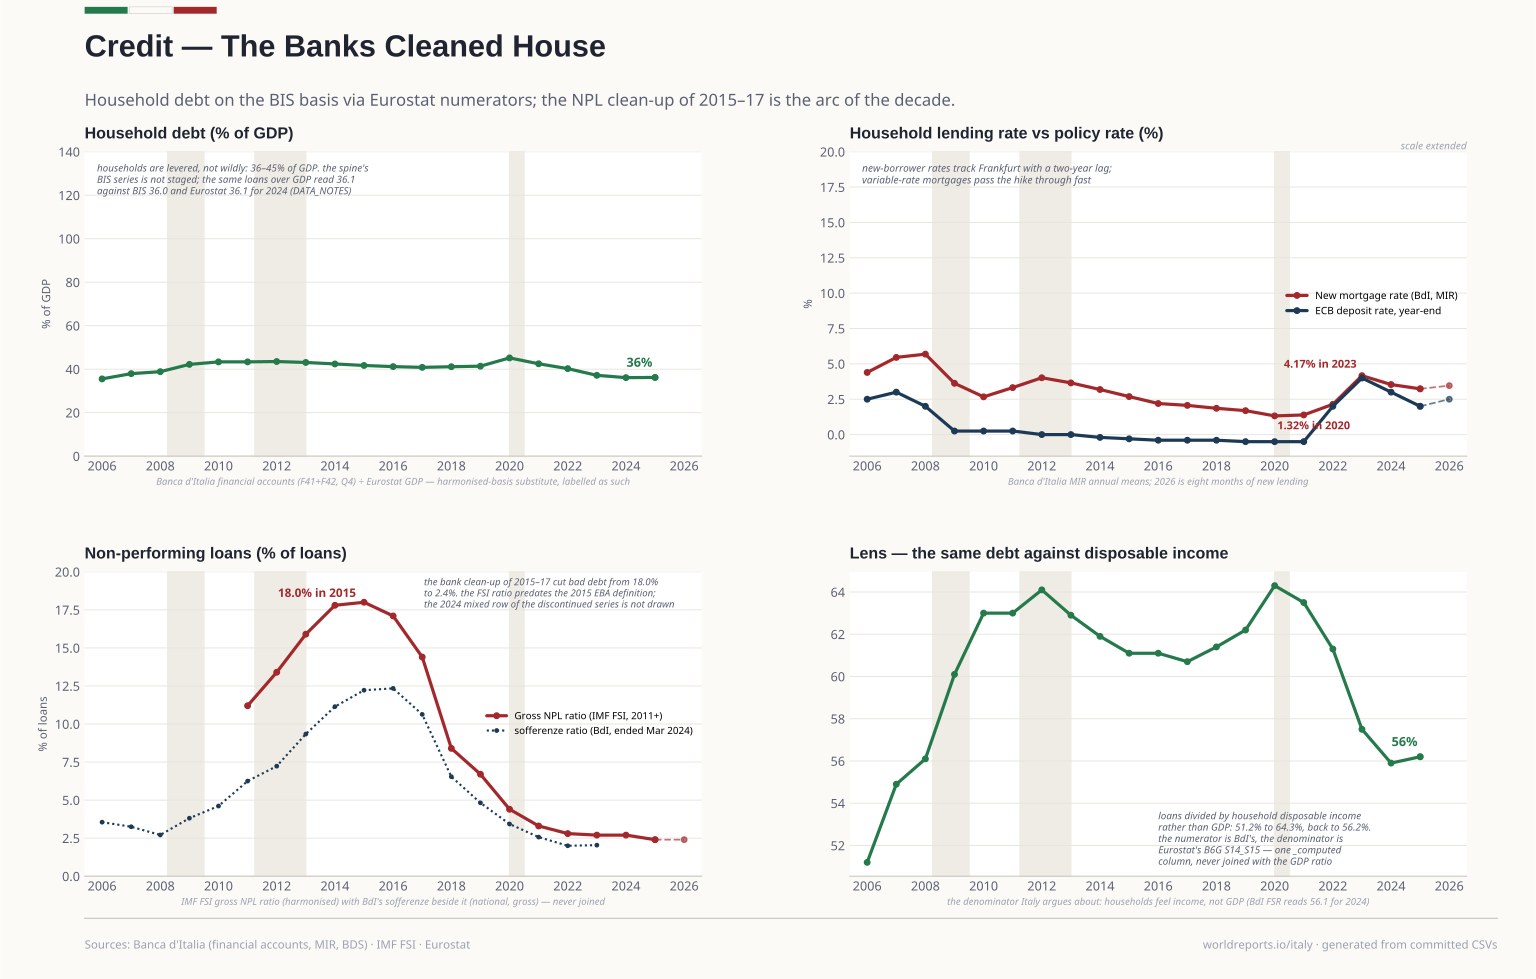
credit/household_debt.csv | Households+NPISH LOAN liabilities (F41 short-term + F42 long-term, financial accounts, quarterly stocks, CFI_FA.Q.S1M.IT.F41/F42...) read at Q4, €bn… | Banca d'Italia — Base Dati Statistica (Conti finanziari: household + NPISH debt / disposable income) | 2006-2026 | Official |
|---|
credit/household_debt_from_bdi.csv | Households+NPISH LOAN liabilities (F41 short-term + F42 long-term, financial accounts, quarterly stocks, CFI_FA.Q.S1M.IT.F41/F42...) read at Q4, €bn… | Banca d'Italia — Base Dati Statistica (Conti finanziari: household + NPISH debt / disposable income) | 2006-2026 | Official |
|---|
credit/lending_rate.csv | MIR harmonised bank interest rates, %, monthly: new-business house purchase (BAM_MIR...MIR5411...110.212) as annual mean (house_new_avg, count in… | Banca d'Italia — Base Dati Statistica (TUB/TAE lending rates, new business to households) | 2006-2026 | Official |
|---|
credit/lending_rate_from_bdi.csv | MIR harmonised bank interest rates, %, monthly: new-business house purchase (BAM_MIR...MIR5411...110.212) as annual mean (house_new_avg, count in… | Banca d'Italia — Base Dati Statistica (TUB/TAE lending rates, new business to households) | 2006-2026 | Official |
|---|
credit/npl.csv | Two NPL measures, never spliced. PRIMARY: npl_gross_ratio_fsi, the IMF FSI gross non-performing loans ÷ total loans (SDDS_FS.Q.3700001. NPLL.902), %… | Banca d'Italia — Base Dati Statistica (sofferenze e crediti, banks' balance-sheet quality) | 2006-2026 | Official |
|---|
credit/npl_from_bdi.csv | Two NPL measures, never spliced. PRIMARY: npl_gross_ratio_fsi, the IMF FSI gross non-performing loans ÷ total loans (SDDS_FS.Q.3700001. NPLL.902), %… | Banca d'Italia — Base Dati Statistica (sofferenze e crediti, banks' balance-sheet quality) | 2006-2026 | Official |
|---|
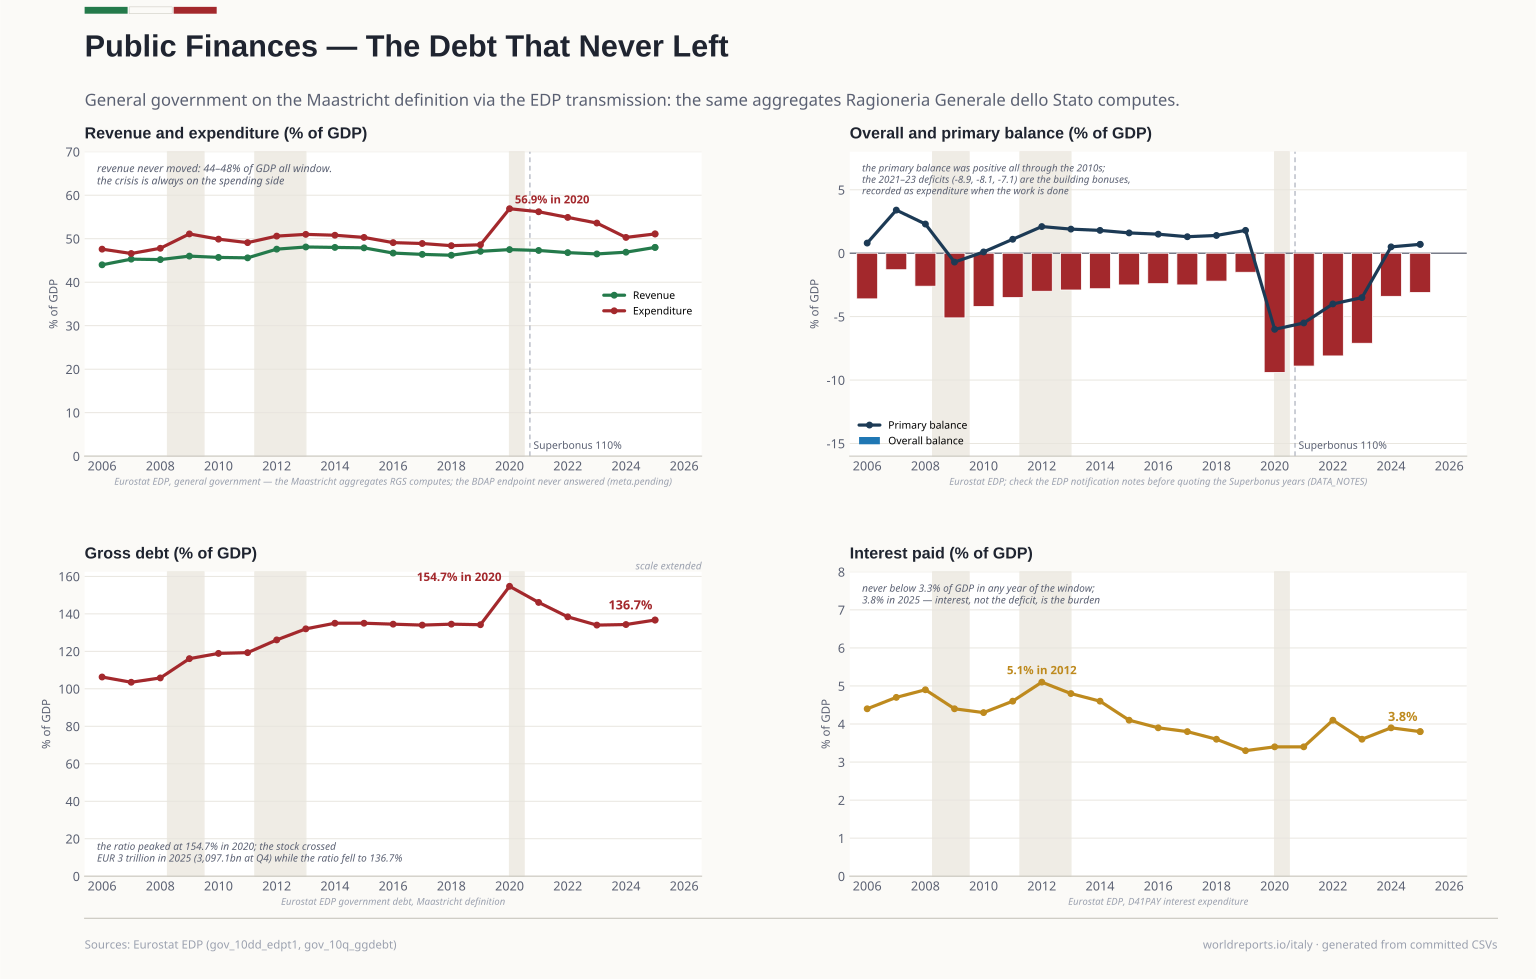
fiscal/debt.csv | Maastricht gross debt, general government, % of GDP (annual) and € (quarterly, read at Q4). This is the EDP/ESA definition: consolidated, all levels… | Eurostat — gov_10dd_edpt1 (EDP notification debt) and gov_10q_ggdebt | 2006-2026 | Official |
|---|
fiscal/debt_from_estat.csv | Maastricht gross debt, general government, % of GDP (annual) and € (quarterly, read at Q4). This is the EDP/ESA definition: consolidated, all levels… | Eurostat — gov_10dd_edpt1 (EDP notification debt) and gov_10q_ggdebt | 2006-2026 | Official |
|---|
fiscal/deficit.csv | Net lending/borrowing % GDP; primary = deficit + interest, computed here (what the budget would be if the debt were free — the plate's story, since… | Eurostat — gov_10dd_edpt1 (B9) and gov_10a_main (D41PAY) | 2006-2026 | Official |
|---|
fiscal/deficit_from_estat.csv | Net lending/borrowing % GDP; primary = deficit + interest, computed here (what the budget would be if the debt were free — the plate's story, since… | Eurostat — gov_10dd_edpt1 (B9) and gov_10a_main (D41PAY) | 2006-2026 | Official |
|---|
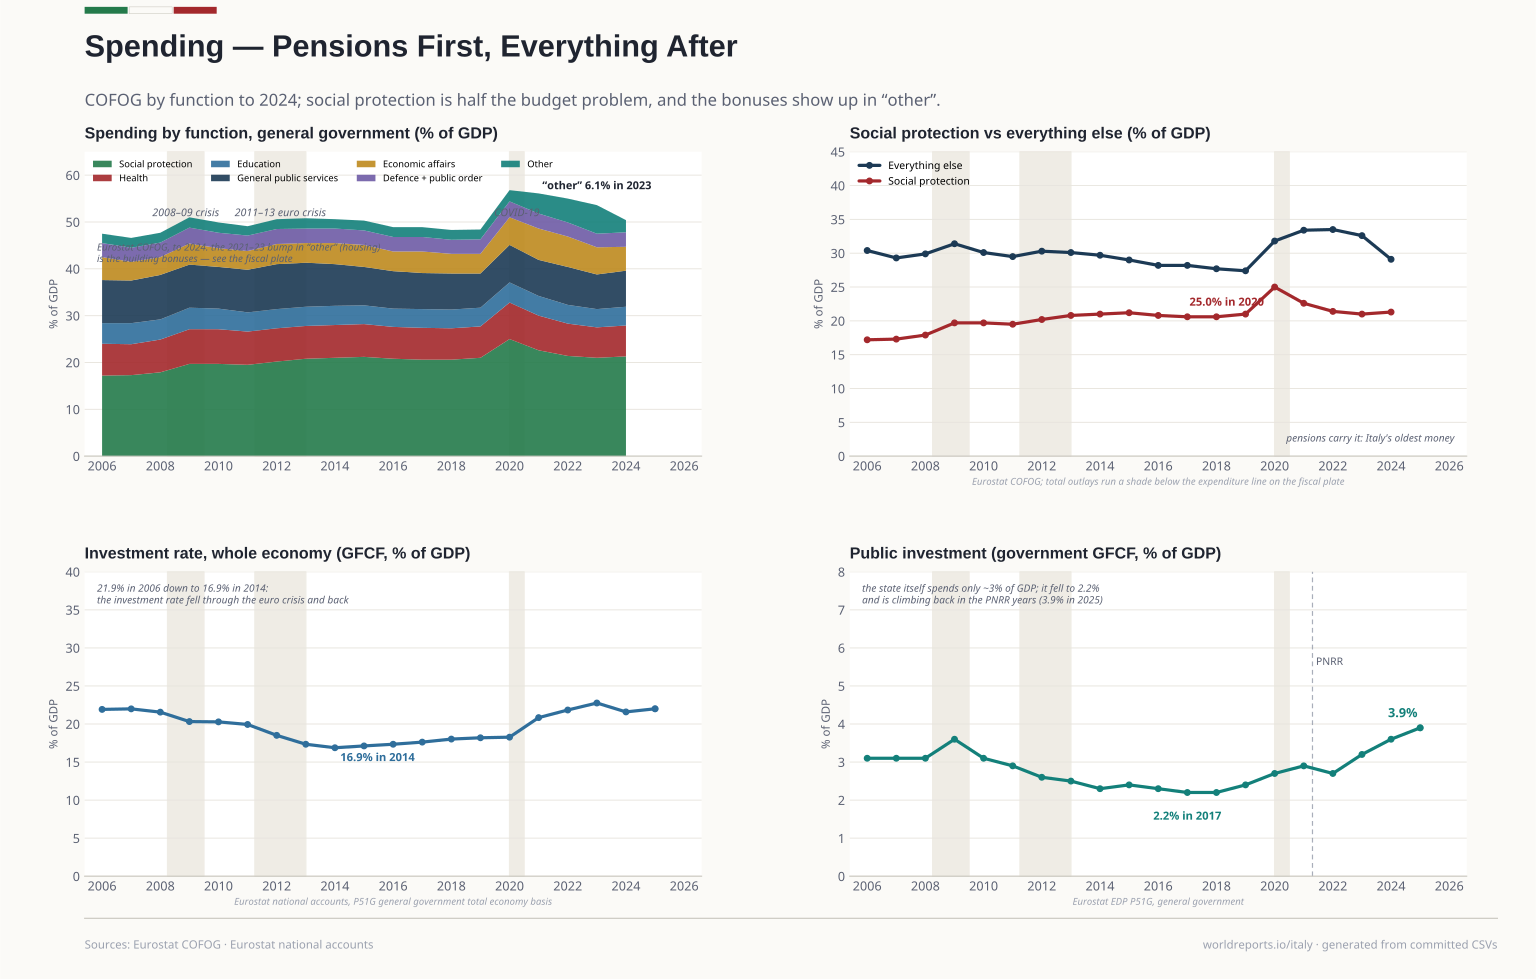
fiscal/investment.csv | Gross fixed capital formation, whole economy (€bn and % GDP) and general government (% GDP): three concepts, kept apart. Columns gfcf_eurbn… | Eurostat — nama_10_gdp (P51G) and gov_10a_main (P51G) | 2006-2026 | Official |
|---|
fiscal/investment_from_estat.csv | Gross fixed capital formation, whole economy (€bn and % GDP) and general government (% GDP): three concepts, kept apart. Columns gfcf_eurbn… | Eurostat — nama_10_gdp (P51G) and gov_10a_main (P51G) | 2006-2026 | Official |
|---|
fiscal/revenue.csv | Total revenue and total expenditure of general government, % of GDP, national-accounts basis. Verified: revenue 2024 46.9%, 2025 48.0%. The pair… | Eurostat — gov_10a_main (TR, TE) | 2006-2026 | Official |
|---|
fiscal/revenue_from_estat.csv | Total revenue and total expenditure of general government, % of GDP, national-accounts basis. Verified: revenue 2024 46.9%, 2025 48.0%. The pair… | Eurostat — gov_10a_main (TR, TE) | 2006-2026 | Official |
|---|
fiscal/spending_by_function.csv | Spending by COFOG division. GF01 carries debt interest, which is why it is not simply "administration". defence_order = GF02+GF03 and other =… | Eurostat — gov_10a_exp (COFOG divisions, TE, % GDP) | 2006-2026 | Official |
|---|
fiscal/spending_by_function_from_estat.csv | Spending by COFOG division. GF01 carries debt interest, which is why it is not simply "administration". defence_order = GF02+GF03 and other =… | Eurostat — gov_10a_exp (COFOG divisions, TE, % GDP) | 2006-2026 | Official |
|---|
fiscal/tax_burden.csv | Eurostat's harmonised taxes-and-social-contributions ratio (na_item=D2_D5_D91_D61_M_D995, sector=S13_S212 — the working key from Spain's fetcher… | Eurostat — gov_10a_taxag (D2+D5+D91+D61 net of D995) | 2006-2026 | Official |
|---|
fiscal/tax_burden_from_estat.csv | Eurostat's harmonised taxes-and-social-contributions ratio (na_item=D2_D5_D91_D61_M_D995, sector=S13_S212 — the working key from Spain's fetcher… | Eurostat — gov_10a_taxag (D2+D5+D91+D61 net of D995) | 2006-2026 | Official |
|---|
international/gdp_pc.csv | Current US$ per person, harmonised across countries. WB 2024-25 GDP is 0.4% below Eurostat × the ECB mean rate (older national- accounts vintage… | World Bank — NY.GDP.PCAP.CD | 2006-2025 | Other |
|---|
international/gdp_pc_from_wb.csv | Current US$ per person, harmonised across countries. WB 2024-25 GDP is 0.4% below Eurostat × the ECB mean rate (older national- accounts vintage… | World Bank — NY.GDP.PCAP.CD | 2005-2025 | Other |
|---|
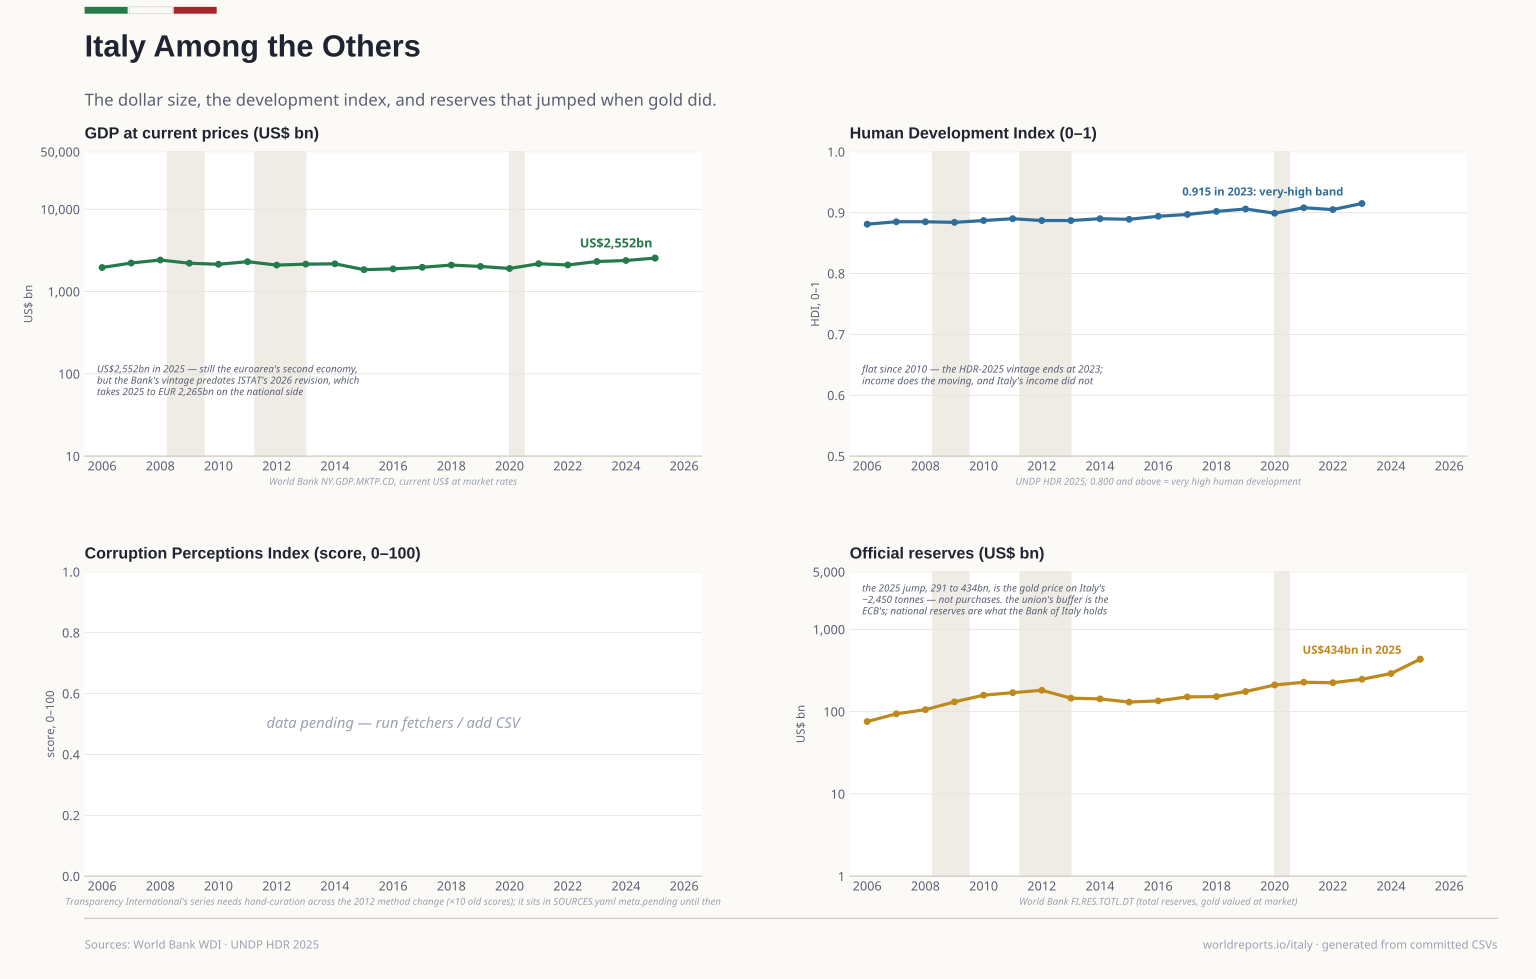
international/gdp_usd.csv | GDP in current US$ (units, not bn) — the comparables layer and a magnitude check on the national accounts (verified 2024: US$2,383bn against €2,211bn… | World Bank — NY.GDP.MKTP.CD | 2006-2025 | Other |
|---|
international/gdp_usd_from_wb.csv | GDP in current US$ (units, not bn) — the comparables layer and a magnitude check on the national accounts (verified 2024: US$2,383bn against €2,211bn… | World Bank — NY.GDP.MKTP.CD | 2005-2025 | Other |
|---|
international/hdi.csv | One file, one vintage, every year (verified 2026-10-22: Italy HDI 2023 = 0.915). The HDR recomputes the whole back-series at each methodology change… | UNDP — Human Development Report 2025, composite indices complete time series | 2006-2023 | Other |
|---|
international/hdi_from_undp.csv | One file, one vintage, every year (verified 2026-10-22: Italy HDI 2023 = 0.915). The HDR recomputes the whole back-series at each methodology change… | UNDP — Human Development Report 2025, composite indices complete time series | 2005-2023 | Other |
|---|
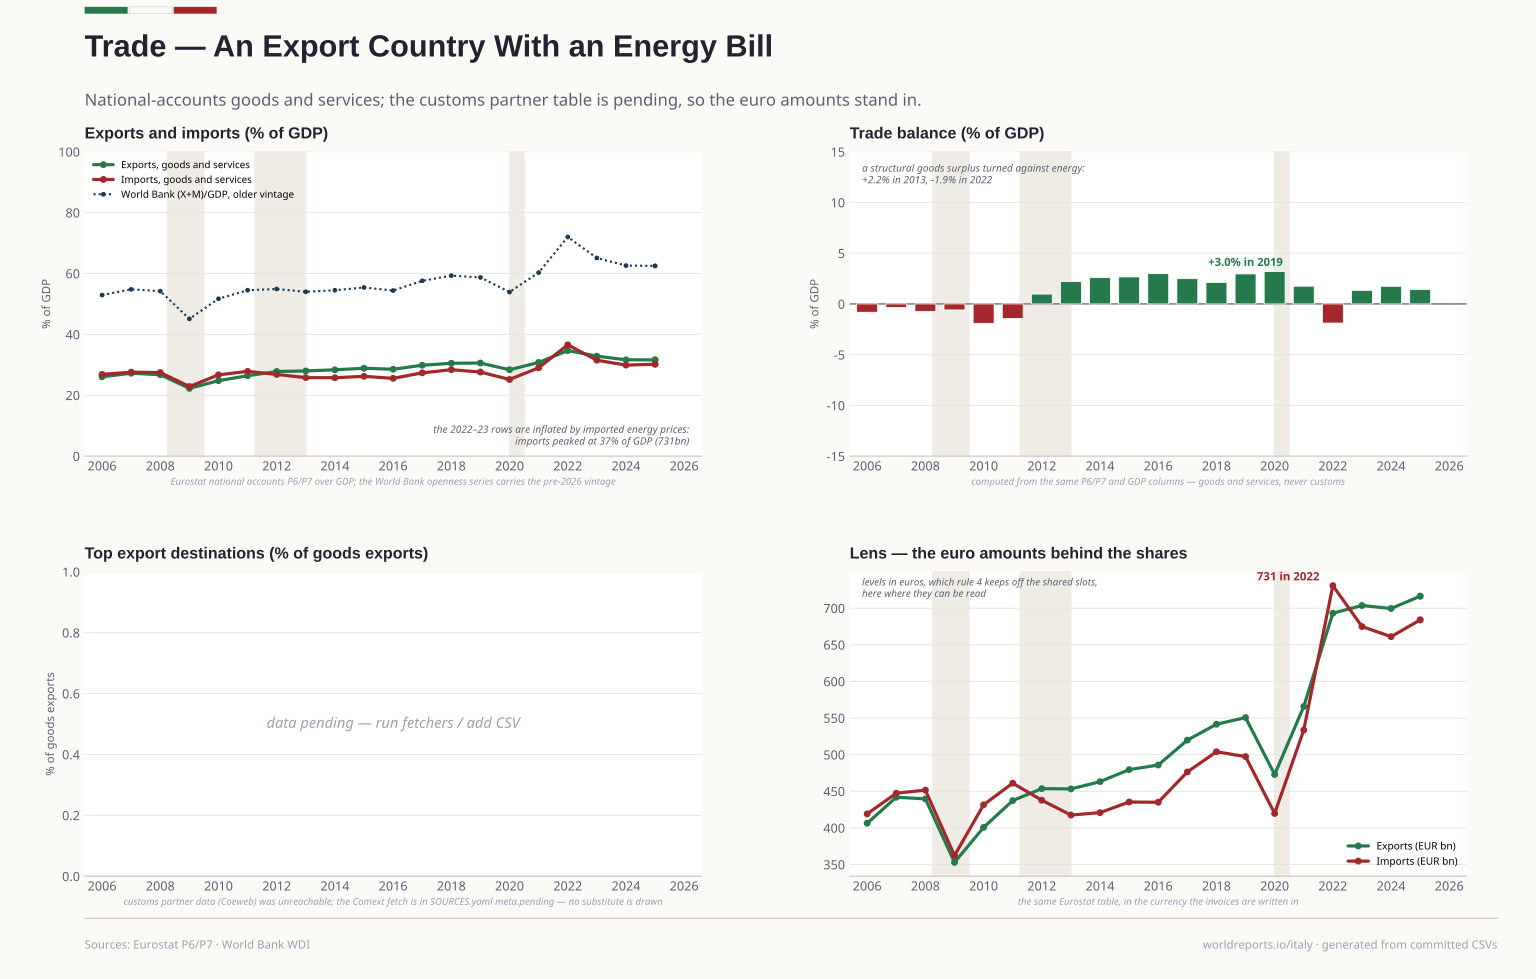
international/openness.csv | Exports plus imports of goods and services as a share of GDP, national-accounts basis — not the customs-value trade the pending Coeweb chapter will… | World Bank — NE.TRD.GNFS.ZS | 2006-2025 | Other |
|---|
international/openness_from_wb.csv | Exports plus imports of goods and services as a share of GDP, national-accounts basis — not the customs-value trade the pending Coeweb chapter will… | World Bank — NE.TRD.GNFS.ZS | 2005-2025 | Other |
|---|
international/population.csv | Cross-check only, MID-YEAR (the others are 1 January). The population series of record is ISTAT's reconstructed resident population at 1 January… | World Bank — SP.POP.TOTL | 2006-2025 | Other |
|---|
international/population_from_wb.csv | Cross-check only, MID-YEAR (the others are 1 January). The population series of record is ISTAT's reconstructed resident population at 1 January… | World Bank — SP.POP.TOTL | 2005-2025 | Other |
|---|
international/reserves.csv | Total reserves including gold, current US$ (units, not bn). The 2025 jump (US$290.5bn → 434.0bn) is the gold price on Italy's ~2,450 t, not a… | World Bank — FI.RES.TOTL.CD (IMF IFS) | 2006-2025 | Other |
|---|
international/reserves_from_wb.csv | Total reserves including gold, current US$ (units, not bn). The 2025 jump (US$290.5bn → 434.0bn) is the gold price on Italy's ~2,450 t, not a… | World Bank — FI.RES.TOTL.CD (IMF IFS) | 2005-2025 | Other |
|---|
macro/gdp.csv | Curated annual publication copy used by the page; national and harmonised twins remain separately listed below. | ISTAT and Eurostat — reviewed annual GDP publication table | 2006-2026 | Official |
|---|
macro/gdp_estat.csv | GDP at current prices (CP_MEUR, written as €bn) and real growth (CLV_PCH_PRE, % per year). Equal to the ISTAT quarterly sum within €5mn every year… | Eurostat — nama_10_gdp (ESA 2010, Italy's transmission) | 2006-2026 | Official |
|---|
macro/gdp_from_estat.csv | GDP at current prices (CP_MEUR, written as €bn) and real growth (CLV_PCH_PRE, % per year). Equal to the ISTAT quarterly sum within €5mn every year… | Eurostat — nama_10_gdp (ESA 2010, Italy's transmission) | 2006-2026 | Official |
|---|
macro/gdp_from_istat.csv | Quarterly GDP, Italy, in quarterly LEVELS (millions of euro, not annualised rates — the annual level is the SUM of the raw quarters, as in Spain; €… | ISTAT — I.Stat SDMX, flow 163_156 (Conto economico delle risorse e degli impieghi) | 2006-2026 | Official |
|---|
macro/gdp_istat.csv | Quarterly GDP, Italy, in quarterly LEVELS (millions of euro, not annualised rates — the annual level is the SUM of the raw quarters, as in Spain; €… | ISTAT — I.Stat SDMX, flow 163_156 (Conto economico delle risorse e degli impieghi) | 2006-2026 | Official |
|---|
macro/hicp.csv | The harmonised consumer-price rate. NOT the same series as ISTAT's NIC: different basket and owner-occupier treatment (2024: HICP 1.1 vs NIC 1.5… | Eurostat — prc_hicp_aind (HICP annual rate of change) | 2006-2026 | Official |
|---|
macro/hicp_from_estat.csv | The harmonised consumer-price rate. NOT the same series as ISTAT's NIC: different basket and owner-occupier treatment (2024: HICP 1.1 vs NIC 1.5… | Eurostat — prc_hicp_aind (HICP annual rate of change) | 2006-2026 | Official |
|---|
macro/nic.csv | The NIC (consumer prices for the whole community), the CPI Italians read in the news — NOT the HICP. General index: ECOICOP_2=00, REF_AREA=IT… | ISTAT — CPI/NIC, flows 167_747_DCSP_NIC2B2025_1 (annual means 1996-2025, base 2015) and 167_745_DF_DCSP_NIC1B2025_1 (monthly from 2026, base 2025) | 2006-2026 | Official |
|---|
macro/nic_from_istat.csv | The NIC (consumer prices for the whole community), the CPI Italians read in the news — NOT the HICP. General index: ECOICOP_2=00, REF_AREA=IT… | ISTAT — CPI/NIC, flows 167_747_DCSP_NIC2B2025_1 (annual means 1996-2025, base 2015) and 167_745_DF_DCSP_NIC1B2025_1 (monthly from 2026, base 2025) | 2006-2026 | Official |
|---|
macro/unemployment.csv | Curated annual unemployment copy; the ISTAT and Eurostat source-specific files remain separate below. | ISTAT — Rilevazione sulle forze di lavoro, reviewed annual publication table | 2006-2026 | Official |
|---|
macro/unemployment_estat.csv | The harmonised LFS rate. STARTS 2009 for Italy — 2006-2008 are blank in the source, carried as blanks, exactly as Spain (the ISTAT old-regulation RFL… | Eurostat — une_rt_a (LFS unemployment rate, 15-74) | 2006-2026 | Official |
|---|
macro/unemployment_from_estat.csv | The harmonised LFS rate. STARTS 2009 for Italy — 2006-2008 are blank in the source, carried as blanks, exactly as Spain (the ISTAT old-regulation RFL… | Eurostat — une_rt_a (LFS unemployment rate, 15-74) | 2006-2026 | Official |
|---|
macro/unemployment_from_istat.csv | National unemployment rate, quarterly seasonally adjusted, SEX=9 (total), AGE=Y15-74; the annual figure is the MEAN of the four quarters. Carries an… | ISTAT — Rilevazione sulle forze di lavoro, flow 151_884 (tasso di disoccupazione, trimestrale destagionalizzato) | 2006-2026 | Official |
|---|
macro/unemployment_istat.csv | National unemployment rate, quarterly seasonally adjusted, SEX=9 (total), AGE=Y15-74; the annual figure is the MEAN of the four quarters. Carries an… | ISTAT — Rilevazione sulle forze di lavoro, flow 151_884 (tasso di disoccupazione, trimestrale destagionalizzato) | 2006-2026 | Official |
|---|
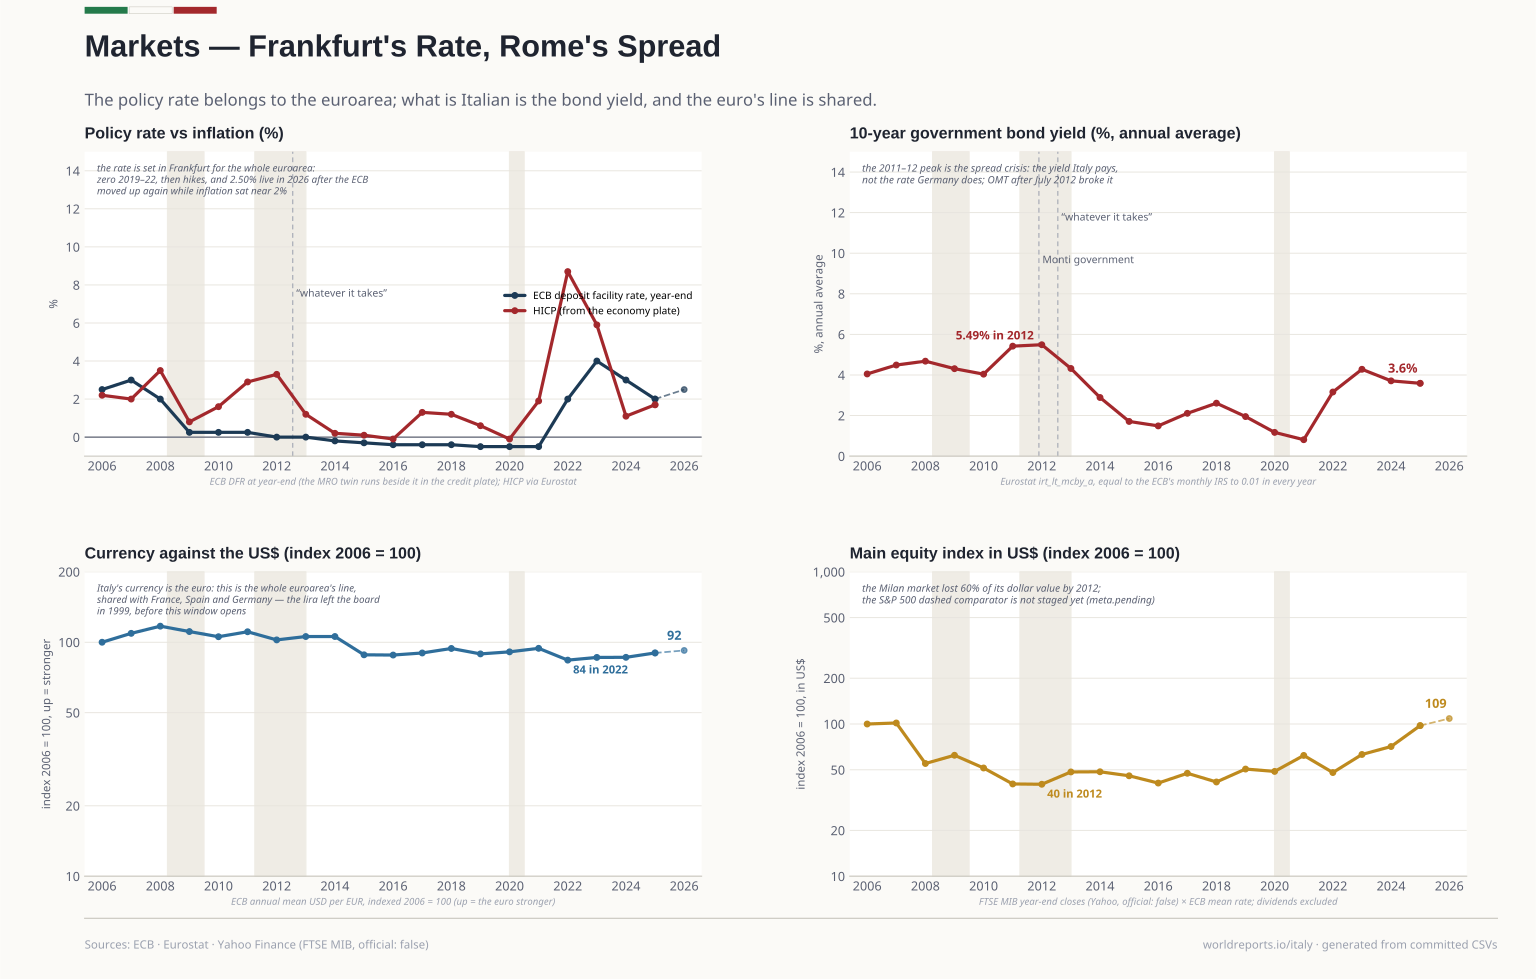
markets/eurusd.csv | Annual mean and year-end of the daily ECB reference rate. USD per EUR: a FALLING line is a weaker euro (already the spine's "up = stronger" direction… | ECB Data Portal — EXR (USD per EUR reference rate, daily) | 2006-2026 | Official |
|---|
markets/eurusd_from_ecb.csv | Annual mean and year-end of the daily ECB reference rate. USD per EUR: a FALLING line is a weaker euro (already the spine's "up = stronger" direction… | ECB Data Portal — EXR (USD per EUR reference rate, daily) | 2006-2026 | Official |
|---|
markets/ftsemib.csv | Nobody official publishes an index close. PRICE index — it excludes dividends, and the FTSE MIB's dividend yield is among the highest in Europe, so a… | Yahoo Finance (redistributor) — FTSEMIB.MI, year-end closes from monthly bars | 2006-2026 | Other |
|---|
markets/ftsemib_from_yahoo.csv | Nobody official publishes an index close. PRICE index — it excludes dividends, and the FTSE MIB's dividend yield is among the highest in Europe, so a… | Yahoo Finance (redistributor) — FTSEMIB.MI, year-end closes from monthly bars | 2005-2026 | Other |
|---|
markets/policy_rate.csv | Italy has no monetary policy of its own; the policy rate is the ECB's. The deposit facility rate is the one that has steered money-market rates since… | ECB Data Portal — FM (DFR and MRO, daily, year-end) | 2006-2026 | Official |
|---|
markets/policy_rate_from_ecb.csv | Italy has no monetary policy of its own; the policy rate is the ECB's. The deposit facility rate is the one that has steered money-market rates since… | ECB Data Portal — FM (DFR and MRO, daily, year-end) | 2006-2026 | Official |
|---|
markets/yield_10y.csv | Annual average of the 10-year benchmark government bond yield used for the convergence criterion — the BTP. Verified: 2012 5.49% (the spread crisis… | Eurostat — irt_lt_mcby_a (Maastricht criterion bond yield) | 2006-2026 | Official |
|---|
markets/yield_10y_from_estat.csv | Annual average of the 10-year benchmark government bond yield used for the convergence criterion — the BTP. Verified: 2012 5.49% (the spread crisis… | Eurostat — irt_lt_mcby_a (Maastricht criterion bond yield) | 2006-2026 | Official |
|---|
migration/asylum.csv | Applications (unit=PER mandatory — with unit=NR the cube returns well-formed and EMPTY, Spain's trap, confirmed for IT). Starts 2008; runs THROUGH… | Eurostat — migr_asyappctza (asylum applicants) | 2006-2026 | Official |
|---|
migration/asylum_from_estat.csv | Applications (unit=PER mandatory — with unit=NR the cube returns well-formed and EMPTY, Spain's trap, confirmed for IT). Starts 2008; runs THROUGH… | Eurostat — migr_asyappctza (asylum applicants) | 2006-2026 | Official |
|---|
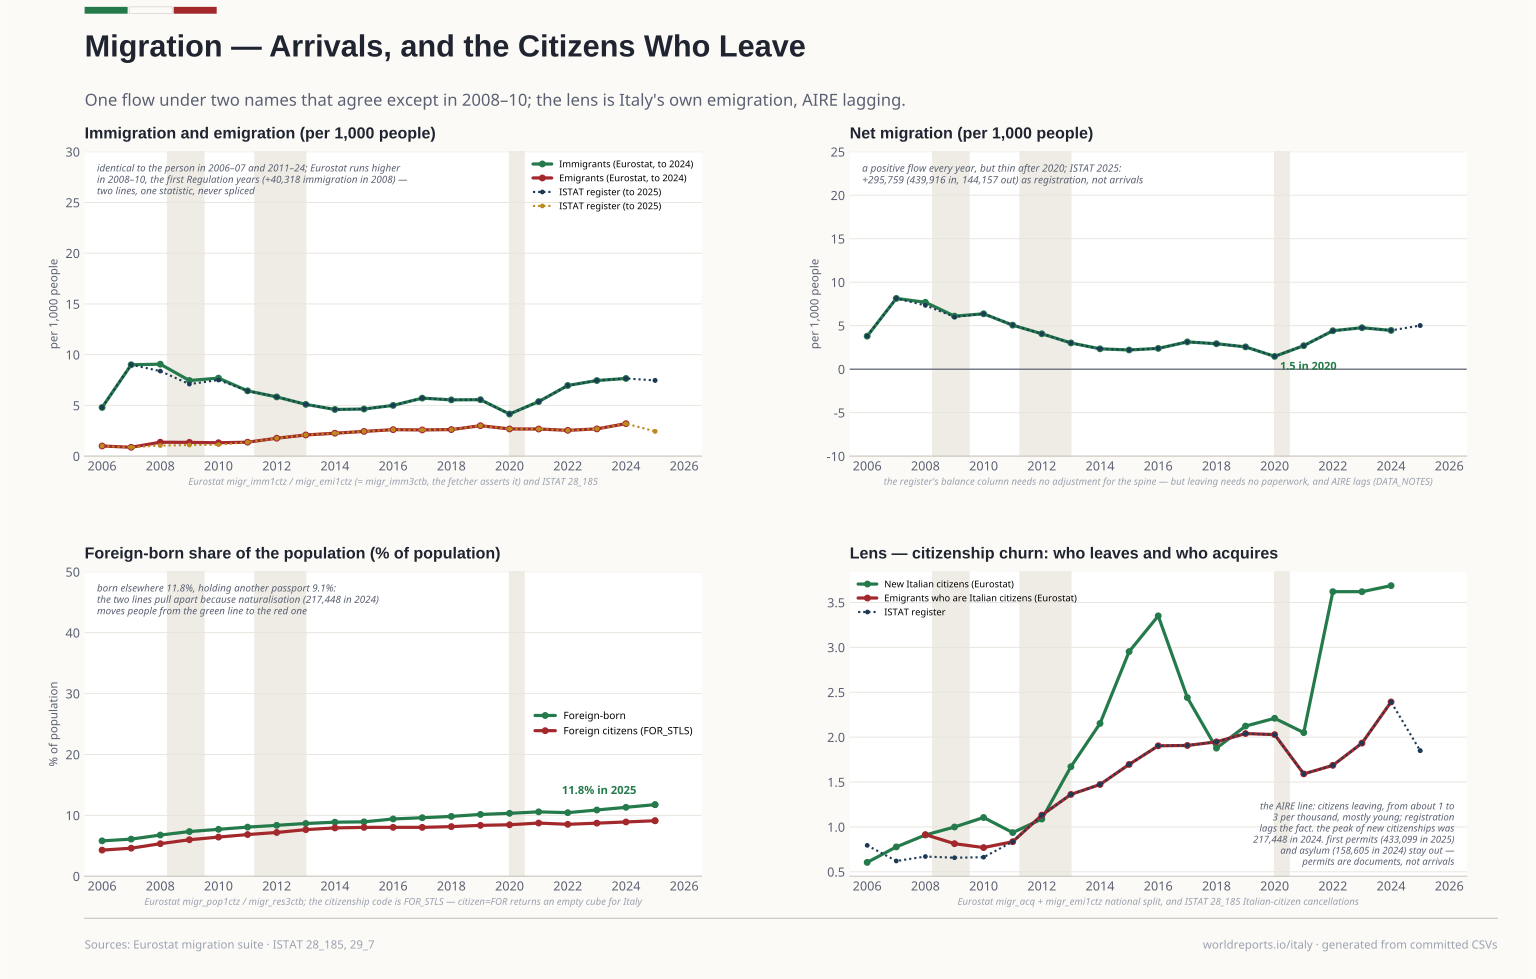
migration/emigration.csv | Emigration flow, by citizenship (total, national, eu27, non_eu27), to 2024 (2024: 188,903); the EU/non-EU split exists from 2020 and the national… | Eurostat — migr_emi1ctz (by citizenship) | 2006-2026 | Official |
|---|
migration/emigration_from_estat.csv | Emigration flow, by citizenship (total, national, eu27, non_eu27), to 2024 (2024: 188,903); the EU/non-EU split exists from 2020 and the national… | Eurostat — migr_emi1ctz (by citizenship) | 2006-2026 | Official |
|---|
migration/foreign_residents.csv | Foreign-citizen residents at 1 January, national. Key verified 2026-10-22: dims FREQ.REF_AREA.DATA_TYPE(JAN).SEX.AGE — the wildcard form A.IT...TOTAL… | ISTAT — flow 29_7 (Stranieri residenti al 1° gennaio) | 2006-2026 | Official |
|---|
migration/foreign_residents_from_istat.csv | Foreign-citizen residents at 1 January, national. Key verified 2026-10-22: dims FREQ.REF_AREA.DATA_TYPE(JAN).SEX.AGE — the wildcard form A.IT...TOTAL… | ISTAT — flow 29_7 (Stranieri residenti al 1° gennaio) | 2006-2026 | Official |
|---|
migration/immigration.csv | Immigration FLOW, both definitions. ITALY-SPECIFIC FINDING (verified 2026-10-22): the TOTALS are identical on the two cuts for every year 2008-2024… | Eurostat — migr_imm1ctz (by citizenship) and migr_imm3ctb (by country of birth) | 2006-2026 | Official |
|---|
migration/immigration_from_estat.csv | Immigration FLOW, both definitions. ITALY-SPECIFIC FINDING (verified 2026-10-22): the TOTALS are identical on the two cuts for every year 2008-2024… | Eurostat — migr_imm1ctz (by citizenship) and migr_imm3ctb (by country of birth) | 2006-2026 | Official |
|---|
migration/migration_flows.csv | The national twin of the Eurostat flow files: anagraphic registrations for change of residence from/to abroad (CHANGE_OF_RESIDENCE=FREIGN), by… | ISTAT — flow 28_185 (Migrazioni / trasferimenti di residenza), subflows DF_DCIS_MIGRAZIONI_2/3 (immigrati) and _5/6 (emigrati) | 2006-2026 | Official |
|---|
migration/migration_flows_from_istat.csv | The national twin of the Eurostat flow files: anagraphic registrations for change of residence from/to abroad (CHANGE_OF_RESIDENCE=FREIGN), by… | ISTAT — flow 28_185 (Migrazioni / trasferimenti di residenza), subflows DF_DCIS_MIGRAZIONI_2/3 (immigrati) and _5/6 (emigrati) | 2006-2026 | Official |
|---|
migration/naturalisation.csv | People who became Italian in the year (2024: 217,448; the 2013-2016 wave peaks at 201,591 in 2016). This is the series that makes the citizenship-cut… | Eurostat — migr_acq (acquisitions of citizenship) | 2006-2026 | Official |
|---|
migration/naturalisation_from_estat.csv | People who became Italian in the year (2024: 217,448; the 2013-2016 wave peaks at 201,591 in 2016). This is the series that makes the citizenship-cut… | Eurostat — migr_acq (acquisitions of citizenship) | 2006-2026 | Official |
|---|
migration/permits.csv | First permits ISSUED in the year — administrative events, not arrivals: a status change issues a new first permit without a new arrival. Starts 2008… | Eurostat — migr_resfirst (first residence permits, unit=PER) | 2006-2026 | Official |
|---|
migration/permits_from_estat.csv | First permits ISSUED in the year — administrative events, not arrivals: a status change issues a new first permit without a new arrival. Starts 2008… | Eurostat — migr_resfirst (first residence permits, unit=PER) | 2006-2026 | Official |
|---|
migration/stock.csv | Resident population on 1 January on BOTH definitions. ITALY QUIRK (verified 2026-10-22): the foreign-citizen aggregate code here is FOR_STLS, not FOR… | Eurostat — migr_pop1ctz (by citizenship) and migr_pop3ctb (by country of birth) | 2006-2026 | Official |
|---|
migration/stock_from_estat.csv | Resident population on 1 January on BOTH definitions. ITALY QUIRK (verified 2026-10-22): the foreign-citizen aggregate code here is FOR_STLS, not FOR… | Eurostat — migr_pop1ctz (by citizenship) and migr_pop3ctb (by country of birth) | 2006-2026 | Official |
|---|
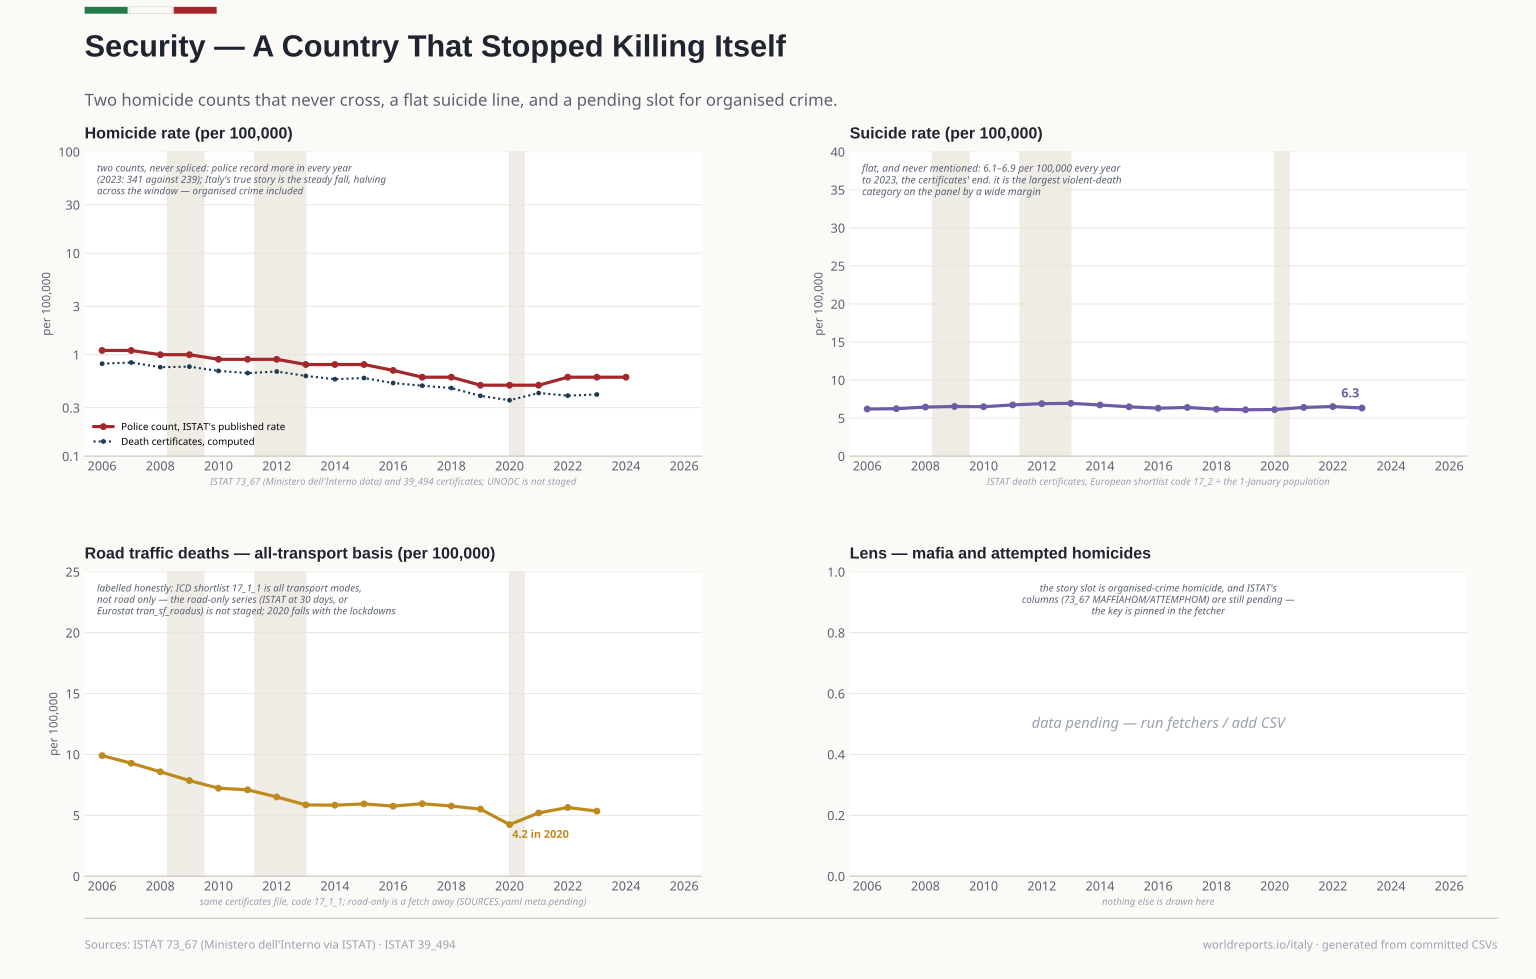
security/homicide_police.csv | Police-recorded crime, national (REF_AREA=IT; provinces carry the bulk — 22MB for two years unkeyed). TYPE_CRIME carries INTENHOM (omicidi volontari… | ISTAT — flow 73_67 (Delitti denunciati dalle forze di polizia all'autorità giudiziaria; source data Ministero dell'Interno SDI) | 2006-2026 | Official |
|---|
security/homicide_police_from_istat.csv | Police-recorded crime, national (REF_AREA=IT; provinces carry the bulk — 22MB for two years unkeyed). TYPE_CRIME carries INTENHOM (omicidi volontari… | ISTAT — flow 73_67 (Delitti denunciati dalle forze di polizia all'autorità giudiziaria; source data Ministero dell'Interno SDI) | 2006-2026 | Official |
|---|
security/homicide_vital.csv | The death-certificate count of homicide, counted at the victim's residence, against the police count at the place of occurrence — the two disagree in… | ISTAT — from causes_of_death (39_494, assault codes X85-Y09 in the European shortlist) | 2006-2026 | Official |
|---|
security/homicide_vital_from_istat.csv | The death-certificate count of homicide, counted at the victim's residence, against the police count at the place of occurrence — the two disagree in… | ISTAT — from causes_of_death (39_494, assault codes X85-Y09 in the European shortlist) | 2006-2026 | Official |
|---|
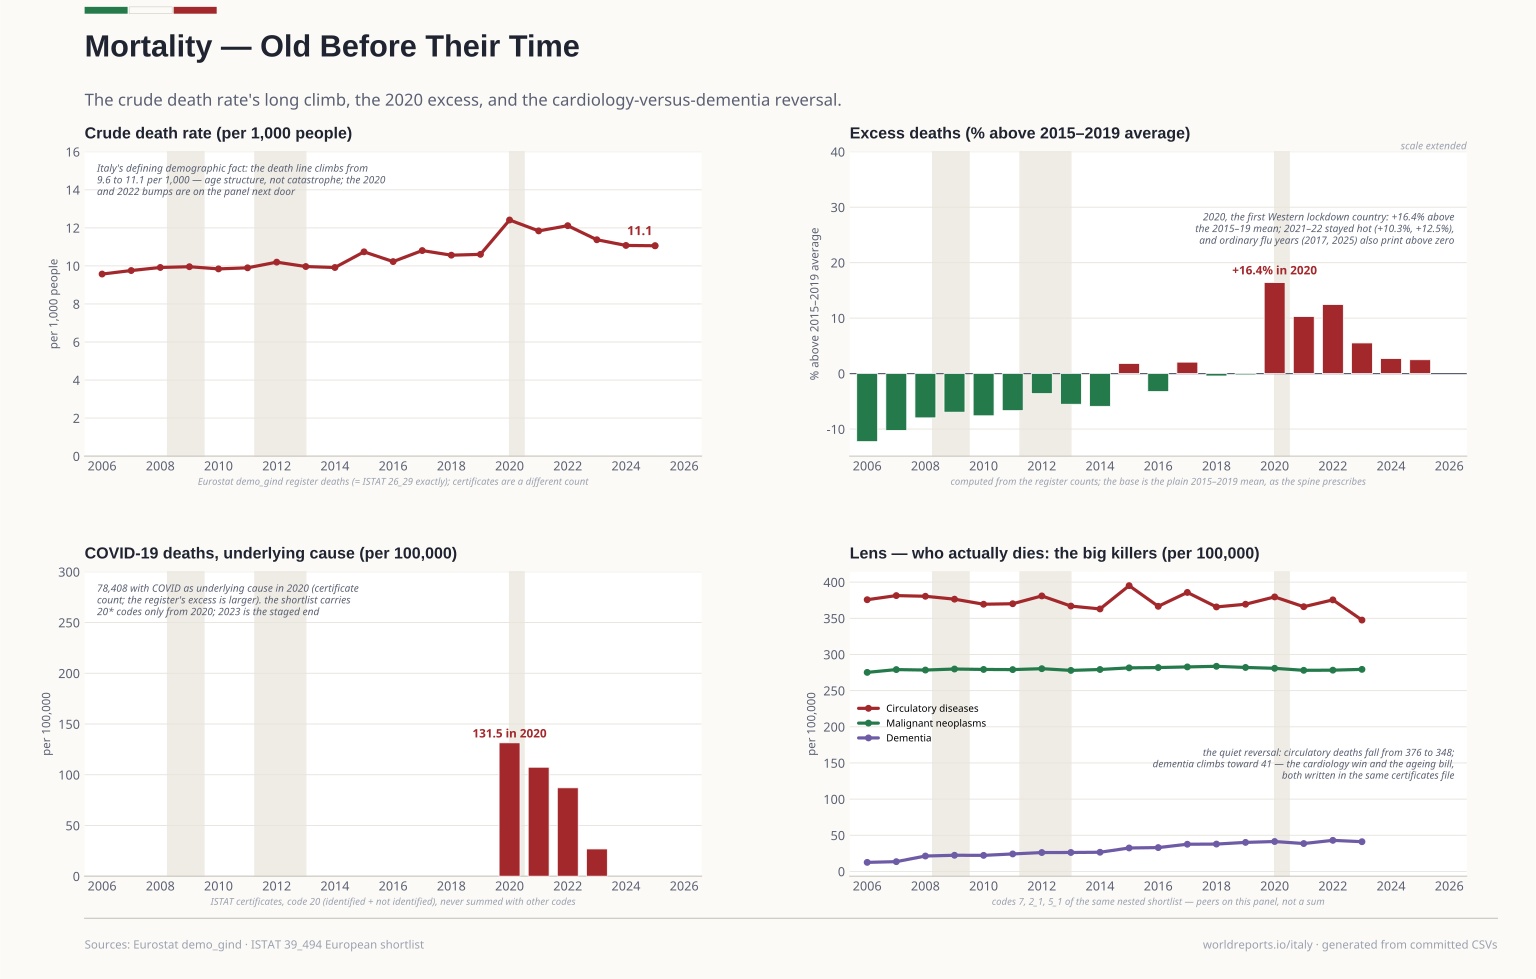
social/causes_of_death.csv | Deaths by cause, territory of RESIDENCE (the 39_493 twin is by territory of EVENT — a different count, never mixed), 13 dims, cause on… | ISTAT — flow 39_494_DF_DCIS_CMORTE1_RES_1 (Mortalità per territorio di residenza, causa) | 2006-2023 | Official |
|---|
social/causes_of_death_from_istat.csv | Deaths by cause, territory of RESIDENCE (the 39_493 twin is by territory of EVENT — a different count, never mixed), 13 dims, cause on… | ISTAT — flow 39_494_DF_DCIS_CMORTE1_RES_1 (Mortalità per territorio di residenza, causa) | 2006-2023 | Official |
|---|
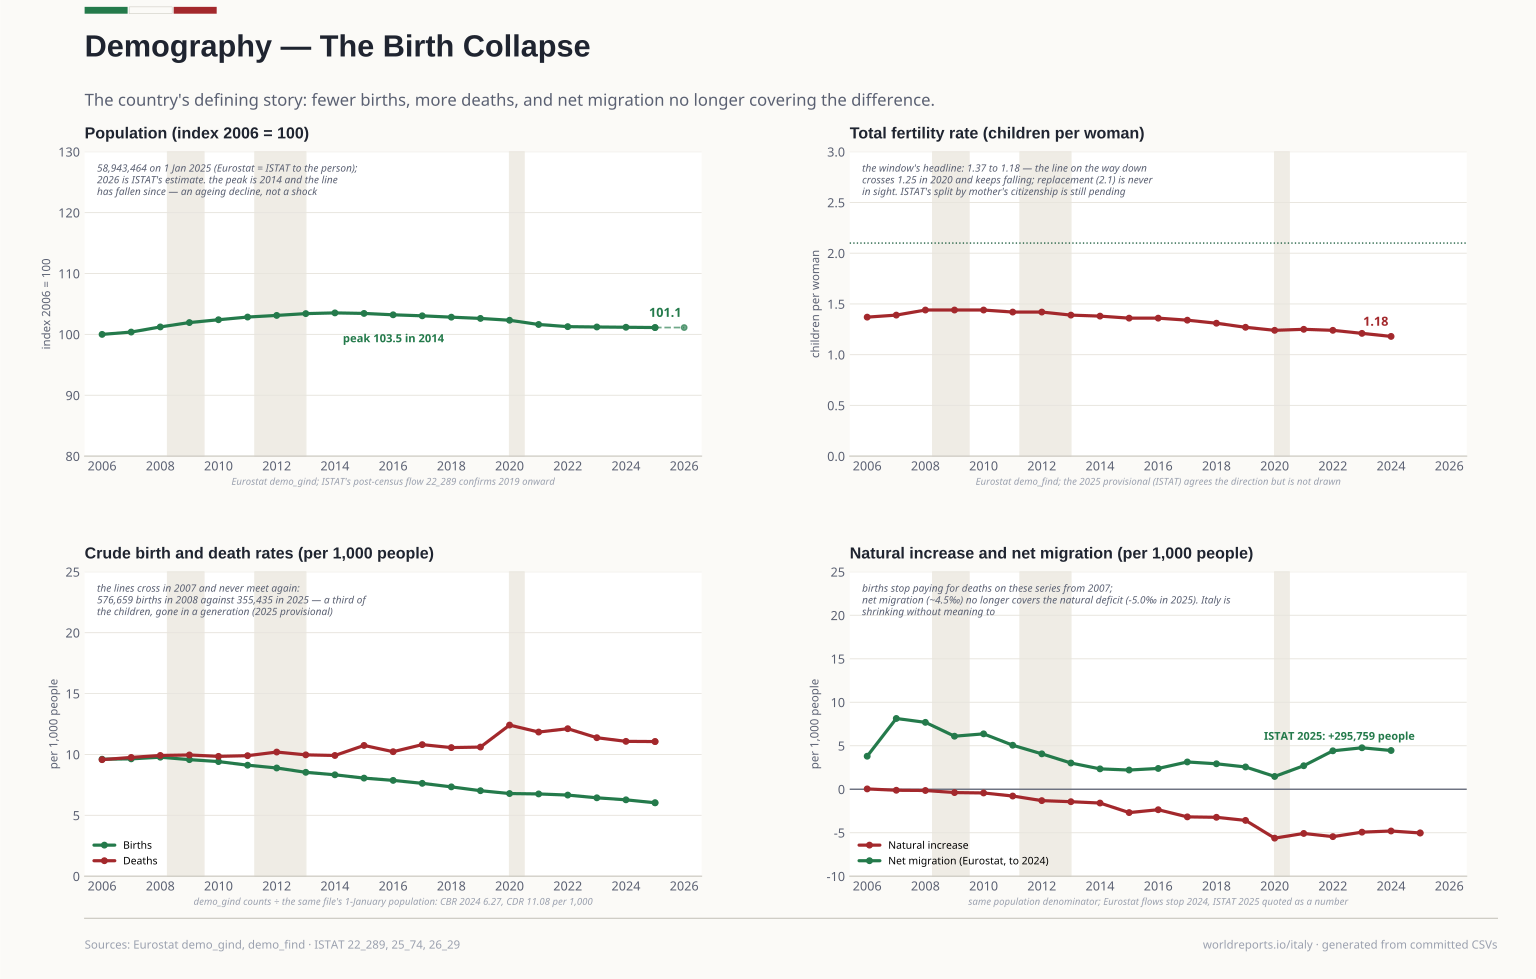
social/demography.csv | Population on 1 January, live births, deaths, total fertility rate — the harmonised cut, drawn beside ISTAT's own, never spliced. Verified… | Eurostat — demo_gind (JAN, LBIRTH, DEATH) and demo_find (TOTFERRT) | 2006-2026 | Official |
|---|
social/demography_from_estat.csv | Population on 1 January, live births, deaths, total fertility rate — the harmonised cut, drawn beside ISTAT's own, never spliced. Verified… | Eurostat — demo_gind (JAN, LBIRTH, DEATH) and demo_find (TOTFERRT) | 2006-2026 | Official |
|---|
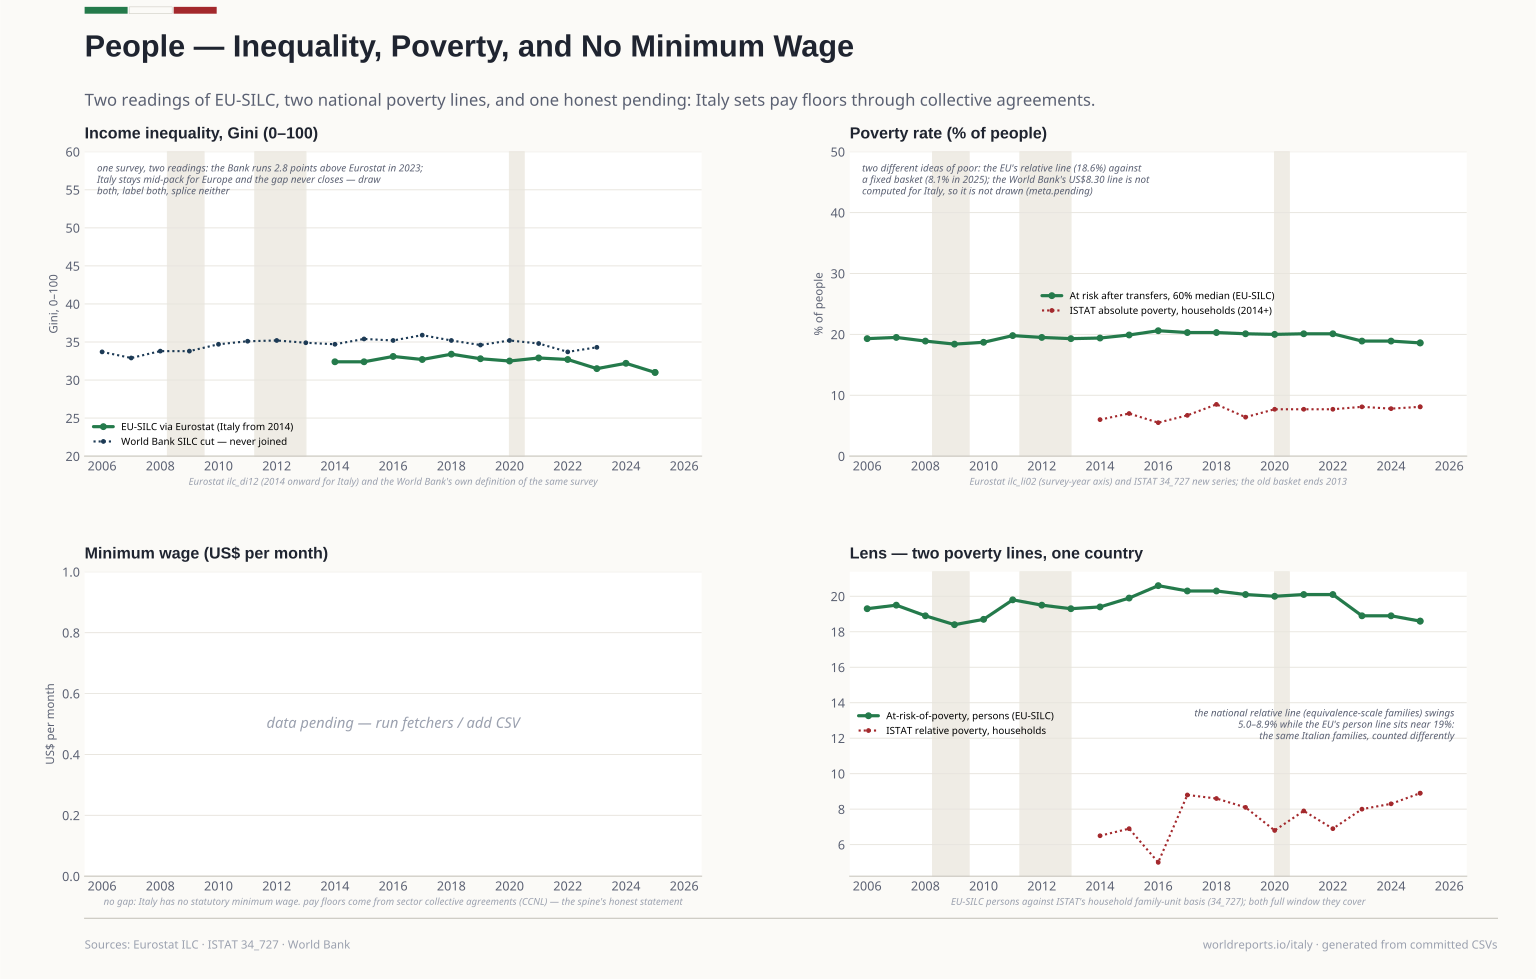
social/gini.csv | Curated comparison table; source-specific Eurostat and World Bank series remain separately labelled. | Eurostat and World Bank — reviewed inequality publication table | 2006-2026 | Official |
|---|
social/gini_estat.csv | EU-SILC Gini. NOTE the dimension is statinfo=GINI_HND, not indic_il (the indic_il query returns HTTP 400 "Dimension INDIC_IL is not defined")… | Eurostat — ilc_di12 (EU-SILC Gini of equivalised disposable income) | 2006-2026 | Official |
|---|
social/gini_from_estat.csv | EU-SILC Gini. NOTE the dimension is statinfo=GINI_HND, not indic_il (the indic_il query returns HTTP 400 "Dimension INDIC_IL is not defined")… | Eurostat — ilc_di12 (EU-SILC Gini of equivalised disposable income) | 2006-2026 | Official |
|---|
social/gini_from_wb.csv | The Bank's harmonised Gini for Italy is EU-SILC-derived — the same survey as the Eurostat series through a different income definition (verified… | World Bank — SI.POV.GINI | 2005-2023 | Other |
|---|
social/gini_wb.csv | The Bank's harmonised Gini for Italy is EU-SILC-derived — the same survey as the Eurostat series through a different income definition (verified… | World Bank — SI.POV.GINI | 2005-2023 | Other |
|---|
social/population.csv | Resident population at 1 January, national (REF_AREA=IT; the flow also carries every comune — unkeyed it is 5MB for two years). ISTAT re-based the… | ISTAT — flow 22_289 (Popolazione residente al 1° gennaio) | 2006-2026 | Official |
|---|
social/population_from_istat.csv | Resident population at 1 January, national (REF_AREA=IT; the flow also carries every comune — unkeyed it is 5MB for two years). ISTAT re-based the… | ISTAT — flow 22_289 (Popolazione residente al 1° gennaio) | 2006-2026 | Official |
|---|
social/poverty.csv | Share below 60% of the national median equivalised income. A relative threshold: it does not fall in a recession where everyone's income falls… | Eurostat — ilc_li02 (at-risk-of-poverty rate, 60% of median) | 2006-2026 | Official |
|---|
social/poverty_abs.csv | Italy's distinctive ABSOLUTE poverty measure (a fixed basket, not a relative threshold) — the national headline the SILC rate is not. Flow 34_727 is… | ISTAT — flow 34_727 "Povertà nuove serie" (absolute poverty incidence) | 2006-2026 | Official |
|---|
social/poverty_abs_from_istat.csv | Italy's distinctive ABSOLUTE poverty measure (a fixed basket, not a relative threshold) — the national headline the SILC rate is not. Flow 34_727 is… | ISTAT — flow 34_727 "Povertà nuove serie" (absolute poverty incidence) | 2006-2026 | Official |
|---|
social/poverty_from_estat.csv | Share below 60% of the national median equivalised income. A relative threshold: it does not fall in a recession where everyone's income falls… | Eurostat — ilc_li02 (at-risk-of-poverty rate, 60% of median) | 2006-2026 | Official |
|---|
social/vital.csv | Annual births and deaths, national. Births key VERIFIED against the published figure: the MARITAL_STATUS=99/99, CITIZEN_FOREIN_OFBIRTH= WORLD cell… | ISTAT — flows 25_74 (Nati vivi) and 26_29_DF_DCIS_DECESSI_2 (Morti) | 2006-2026 | Official |
|---|
social/vital_from_istat.csv | Annual births and deaths, national. Births key VERIFIED against the published figure: the MARITAL_STATUS=99/99, CITIZEN_FOREIN_OFBIRTH= WORLD cell… | ISTAT — flows 25_74 (Nati vivi) and 26_29_DF_DCIS_DECESSI_2 (Morti) | 2006-2026 | Official |
|---|
trade/trade.csv | Exports and imports of goods AND services, national-accounts basis, €bn (columns exports_eurbn, imports_eurbn; 2026 blank). Their sum over GDP equals… | Eurostat — nama_10_gdp (P6 exports, P7 imports) | 2006-2026 | Official |
|---|
trade/trade_from_estat.csv | Exports and imports of goods AND services, national-accounts basis, €bn (columns exports_eurbn, imports_eurbn; 2026 blank). Their sum over GDP equals… | Eurostat — nama_10_gdp (P6 exports, P7 imports) | 2006-2026 | Official |
|---|
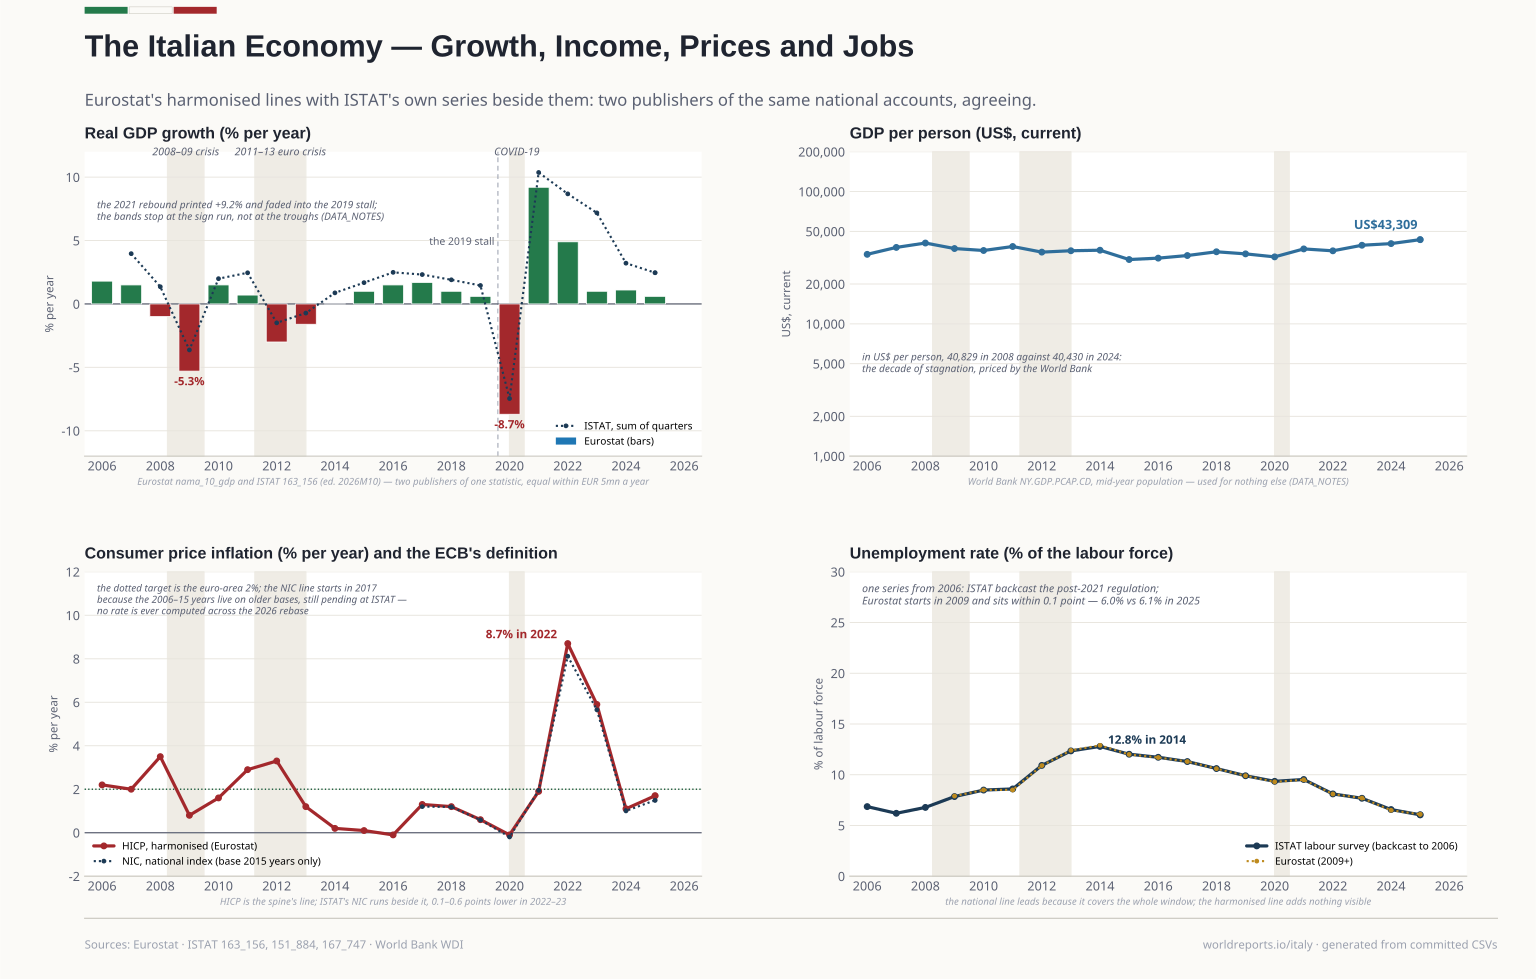 Plate 01