Ukraine

4 plates of official data, 2006-2026

Every figure on this page comes from a publisher that names its definition — the State Statistics Service of Ukraine for the population register, and the World Bank, IMF and UNDP for the harmonised layer — and every plate is regenerated from committed CSVs, so the charts and the numbers here cannot drift apart. Ukraine is a wartime country: the national statistics API, the finance ministry and the customs service all answer 403 to automated access, some national series stop in 2021 because the survey behind them was suspended, and the 2022 collapse is drawn at its real size rather than squeezed into the atlas's usual range. The register and the international estimate of the population are two different territories and are drawn as two lines, never joined.

Where things stand

The plates

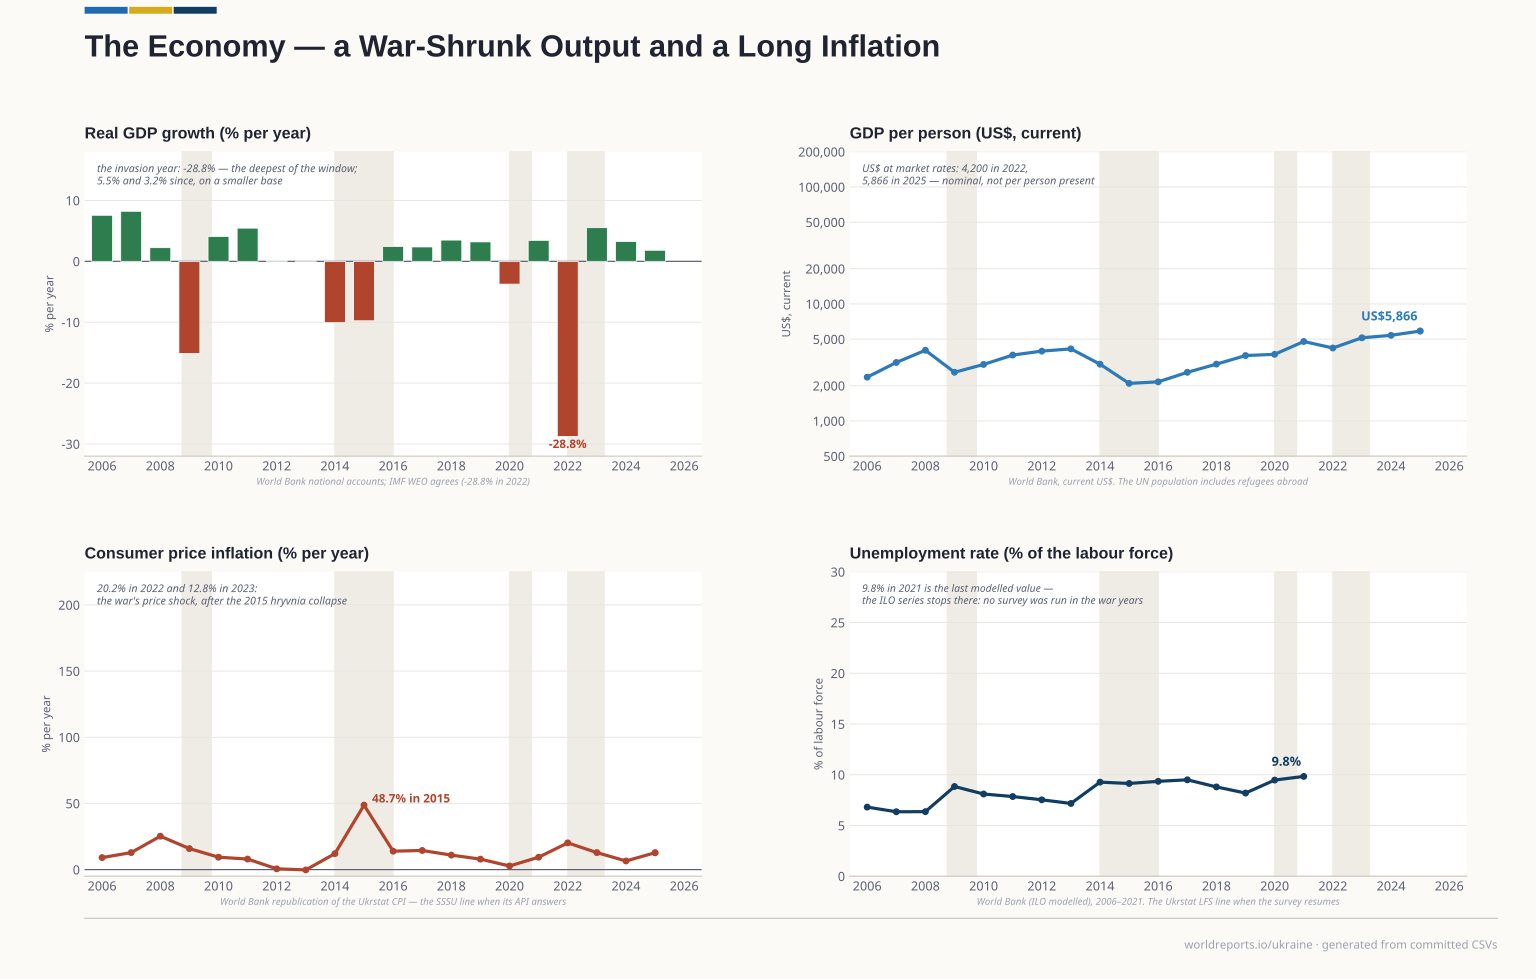
  1. Four panels for 2006–2025. GDP fell 28.8% in 2022 — the deepest drop of the window; inflation reached 48.7% in 2015; the unemployment series stops in 2021. Plate 01

    The Economy

    Growth, income, prices and jobs in comparable World Bank and IMF series.

    View full size Download vector (SVG)
    Drawn from · 3

    The committed files this plate was read from, as recorded while it was drawn.

    20062025
    12.7% The Economy 2025
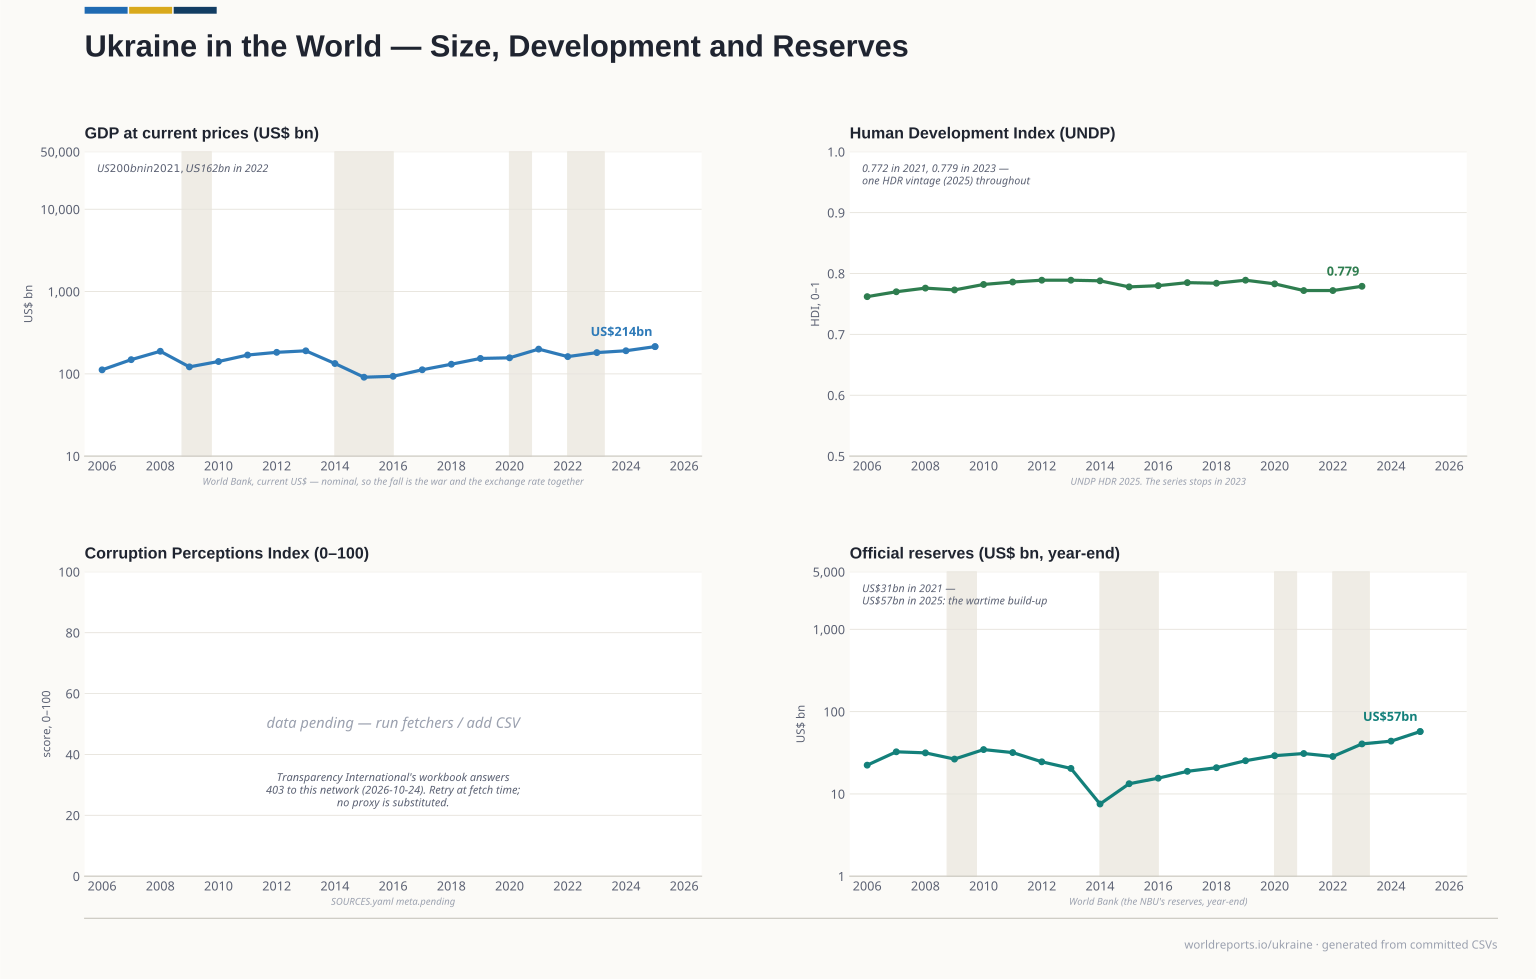
  2. Four panels. Nominal GDP in dollars fell to US$162bn in 2022 and recovered to US$214bn in 2025; reserves rose to US$57bn; the 2023 HDI is 0.779; the corruption index remains unavailable. Plate 02

    Ukraine in the World

    Economic size and reserves in US dollars and human development on international definitions.

    View full size Download vector (SVG)
    Drawn from · 3

    The committed files this plate was read from, as recorded while it was drawn.

    20062025
    US$ 214,233,313tn Ukraine in the World 2025
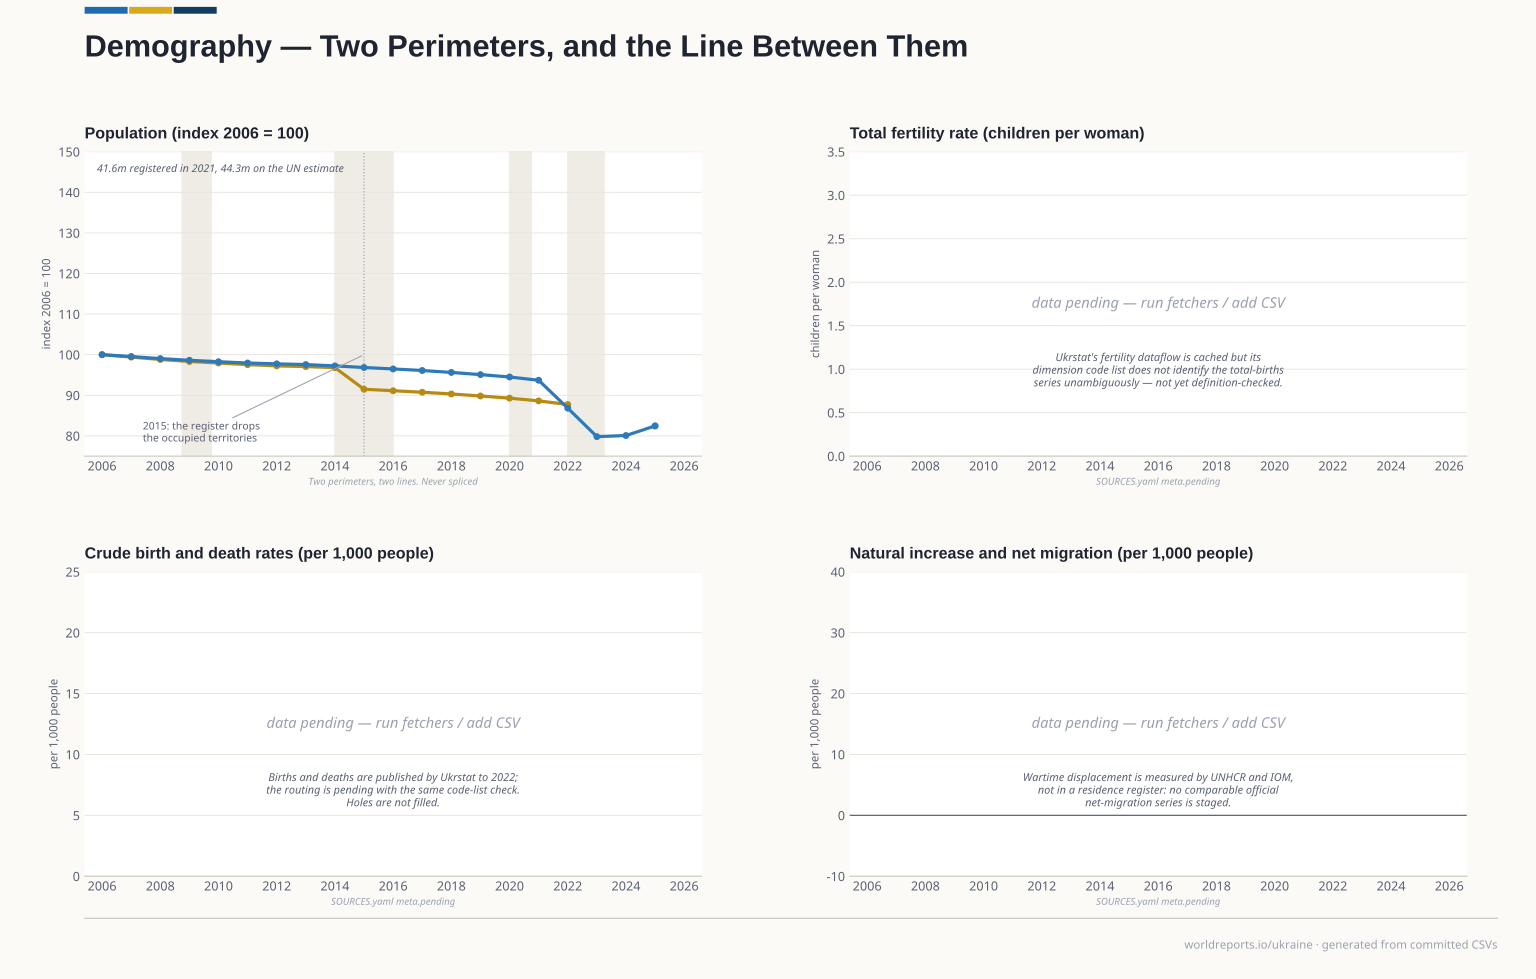
  3. Four panels. The Ukrstat register falls from 46.9m in 2006 to 41.2m in 2022, and the 2015 step is the exclusion of the occupied territories, not a demographic event; the UN estimate includes Crimea and reaches 39.0m in 2025; births, deaths and migration remain unavailable. Plate 03

    Demography

    The national register and the international estimate — two different perimeters, two separate lines.

    View full size Download vector (SVG)
    Drawn from · 2

    The committed files this plate was read from, as recorded while it was drawn.

    19892022
    41,167bn Demography 2022
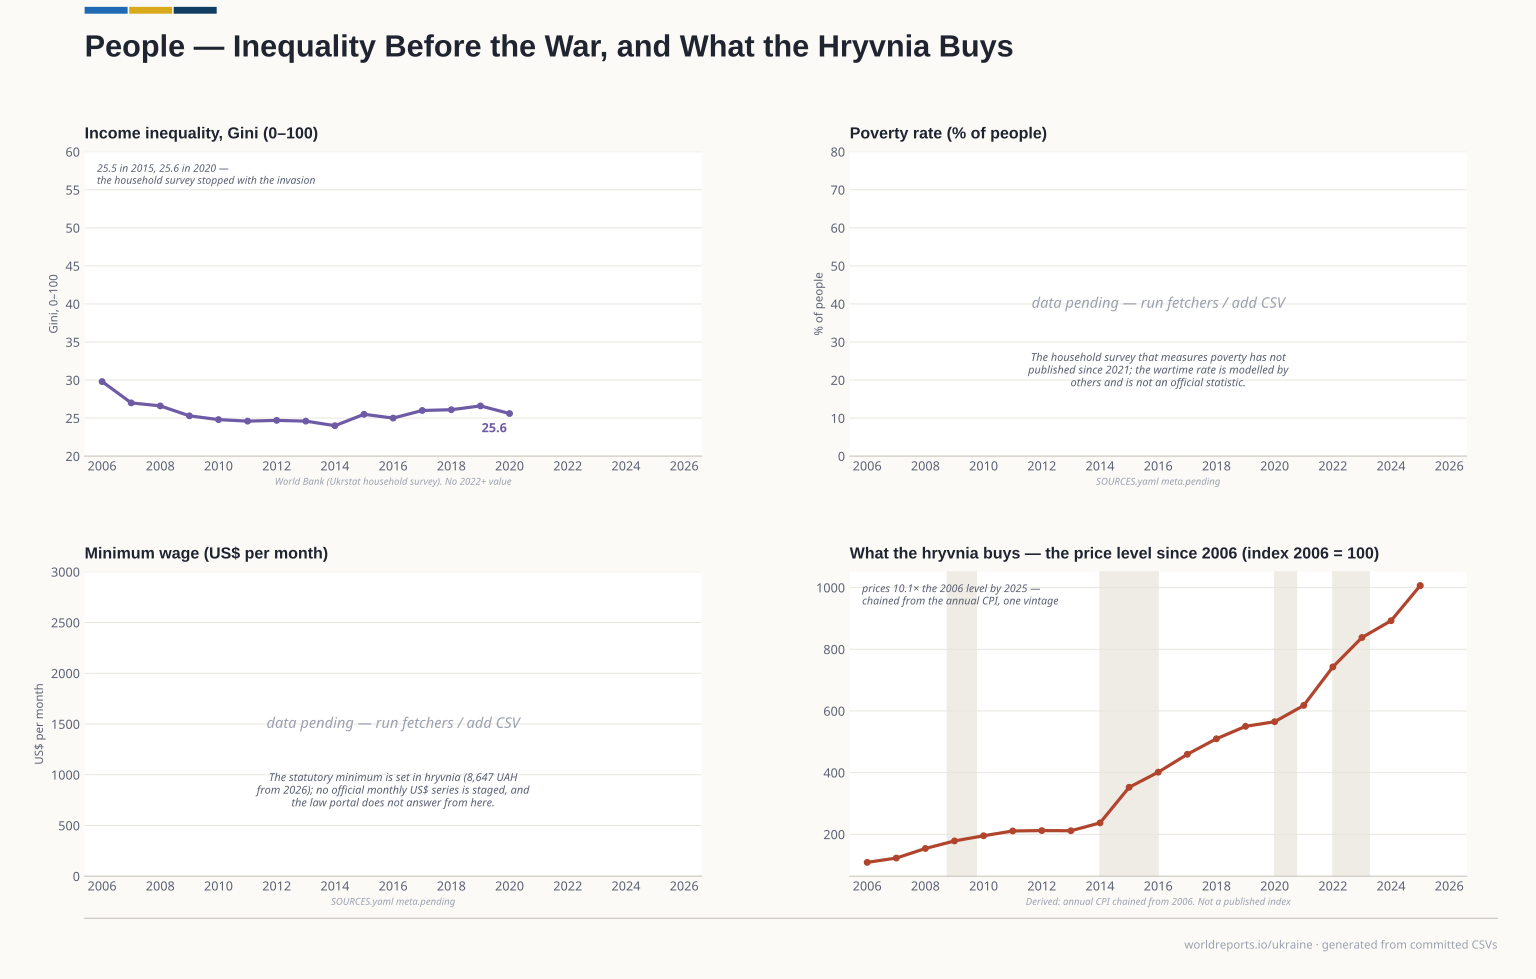
  4. Four panels. The Gini moves from 29.8 in 2006 to 25.6 in 2020, where the household survey stops; the price level chained from annual inflation rose 10.1 times over 2006–2025; poverty and the minimum wage remain unavailable. Plate 04

    People & Prices

    Inequality before the war and what the hryvnia buys — two different questions.

    View full size Download vector (SVG)
    Drawn from · 2

    The committed files this plate was read from, as recorded while it was drawn.

    • macro/economy.csvWorld Bank WDI — NY.GDP.MKTP.KD.ZG (growth), FP.CPI.TOTL.ZG (CPI), NE.GDI.FTOT.ZS (GFCF), SL.UEM.TOTL.ZS (unemployment, ILO modelled) · 2006-2025
    • people/gini.csvWorld Bank WDI — SI.POV.GINI · 2006-2020
    20062020
    25.60 People & Prices 2020