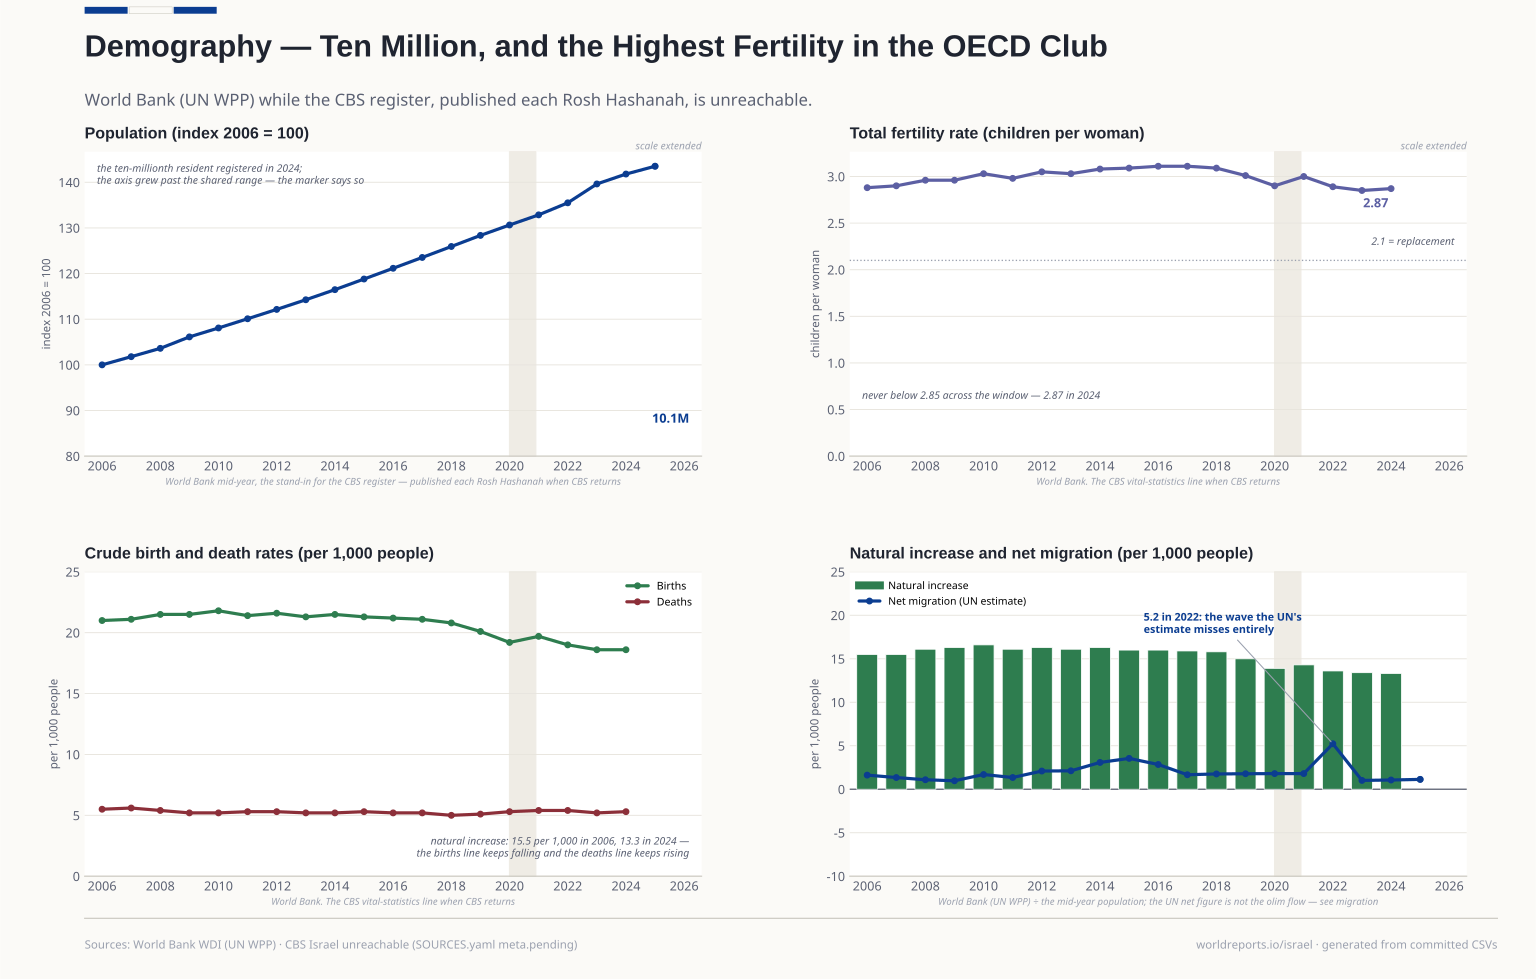
demography/demography.csv | VERIFIED 2026-10-22. Population 2024 10.0022mn, 2025 10.1228mn — Israel crossed 10mn in 2024, so the brief's 9.8-10mn band is half a year stale… | World Bank WDI — SP.POP.TOTL, SP.POP.TOTL.FE.IN, SP.DYN.TFRT.IN, SP.DYN.CBRT.IN, SP.DYN.CDRT.IN, SM.POP.NETM | 2005-2025 | Other |
|---|
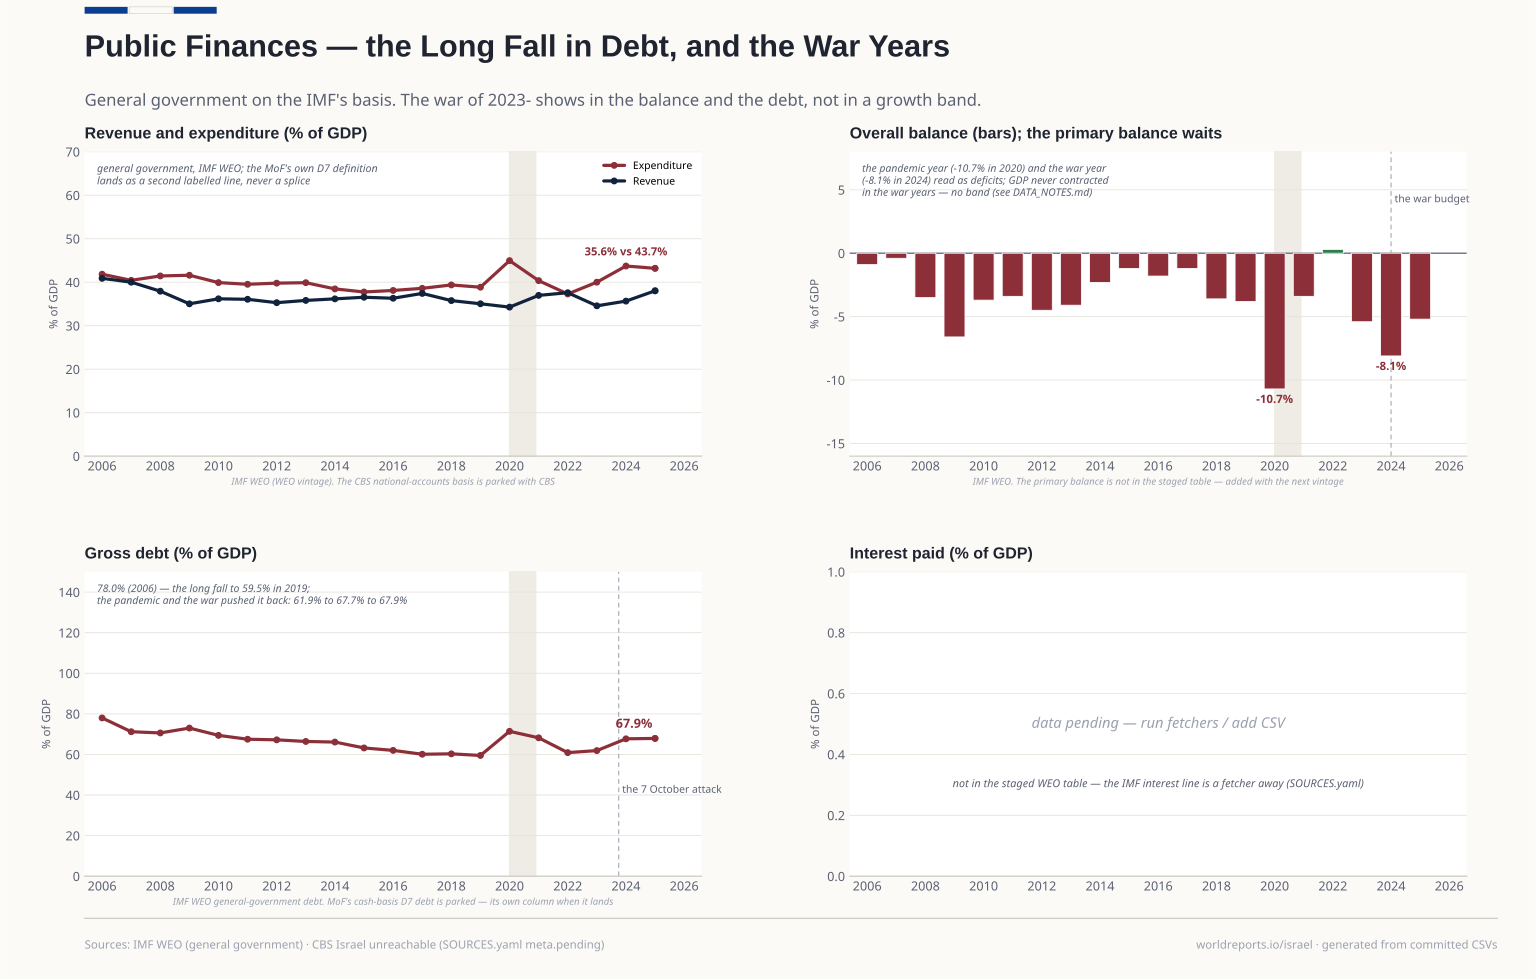
fiscal/general_government.csv | VERIFIED 2026-10-22. Gross debt (GGXWDG_NGDP, the WEO indicator the spine names for fiscal slot 3): 2015 63.2, 2019 59.5, 2020 71.4, 2022 60.9, 2023… | IMF DataMapper (WEO + Fiscal Monitor, October 2026 vintage) — GGR_G01_GDP_PT, G_X_G01_GDP_PT, GGXCNL_G01_GDP_PT, GGXWDG_NGDP | 2005-2025 | Other |
|---|
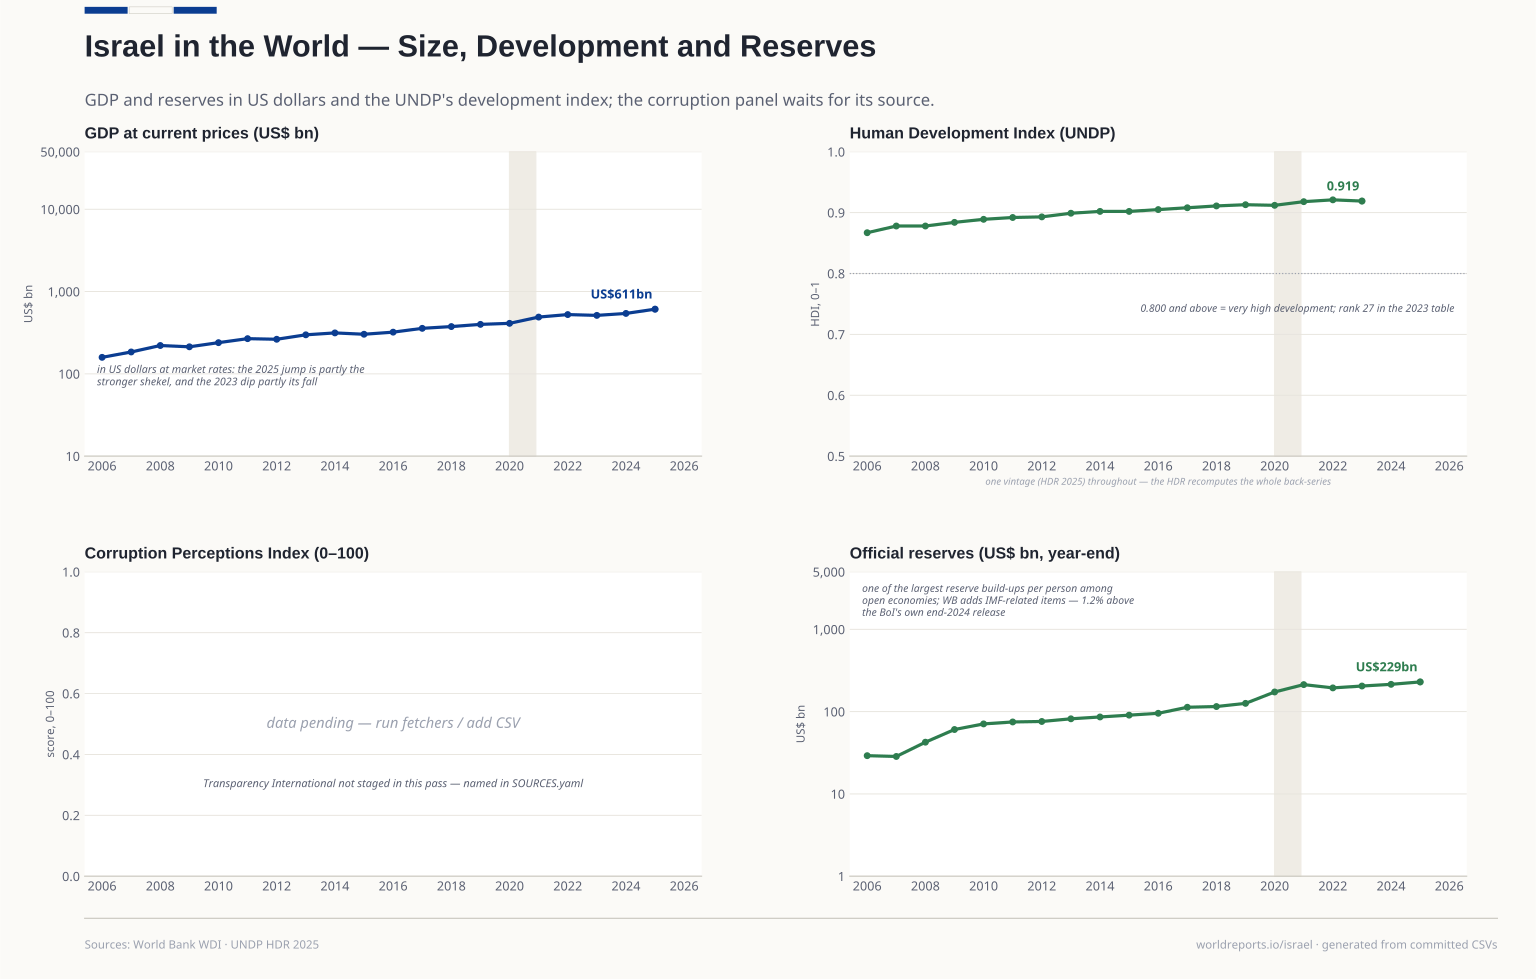
international/hdi.csv | VERIFIED 2026-10-22 (the file is not valid UTF-8 — a cp1252 byte; decoded as such). ISR row: Israel, Very High human development, rank 27, HDI 0.867… | UNDP HDR 2025 — composite indices complete time series | 1990-2023 | Other |
|---|
international/world.csv | VERIFIED 2026-10-22, live JSON ([meta,[rows]], single page). GDP 2023 513.4bn / 2024 542.3bn / 2025 610.8bn (the 2025 jump is partly the shekel's… | World Bank WDI — NY.GDP.MKTP.CD, NY.GDP.PCAP.CD, FI.RES.TOTL.CD (ISO3 ISR) | 2005-2025 | Other |
|---|
macro/cpi_inflation.csv | VERIFIED 2026-10-22: 2022 +4.4, 2024 +3.1, agreeing with WB's republished CBS CPI to within 0.02 pt. PCPIP_IG is not a DataMapper code — the… | IMF DataMapper (WEO) — PCPIPCH | 2005-2025 | Other |
|---|
macro/economy.csv | VERIFIED 2026-10-22, current vintage. GFCF 23.13 (2019), unemployment 3.60 (2024, ILO modelled), CPI inflation 4.41 (2022) — the CPI line is WB's… | World Bank WDI (republished national CPI and ILO-modelled LFS) — NE.GDI.FTOT.ZS, SL.UEM.TOTL.ZS, FP.CPI.TOTL.ZG | 2005-2025 | Other |
|---|
macro/gdp_growth.csv | VERIFIED again 2026-10-22 and the discovery note's spots were wrong: the endpoint now serves Israel 2008 +3.2, 2009 +1.2, 2020 -1.9, 2023 +2.0, 2024… | IMF DataMapper (WEO, October 2026 vintage) — NGDP_RPCH | 2005-2025 | Other |
|---|
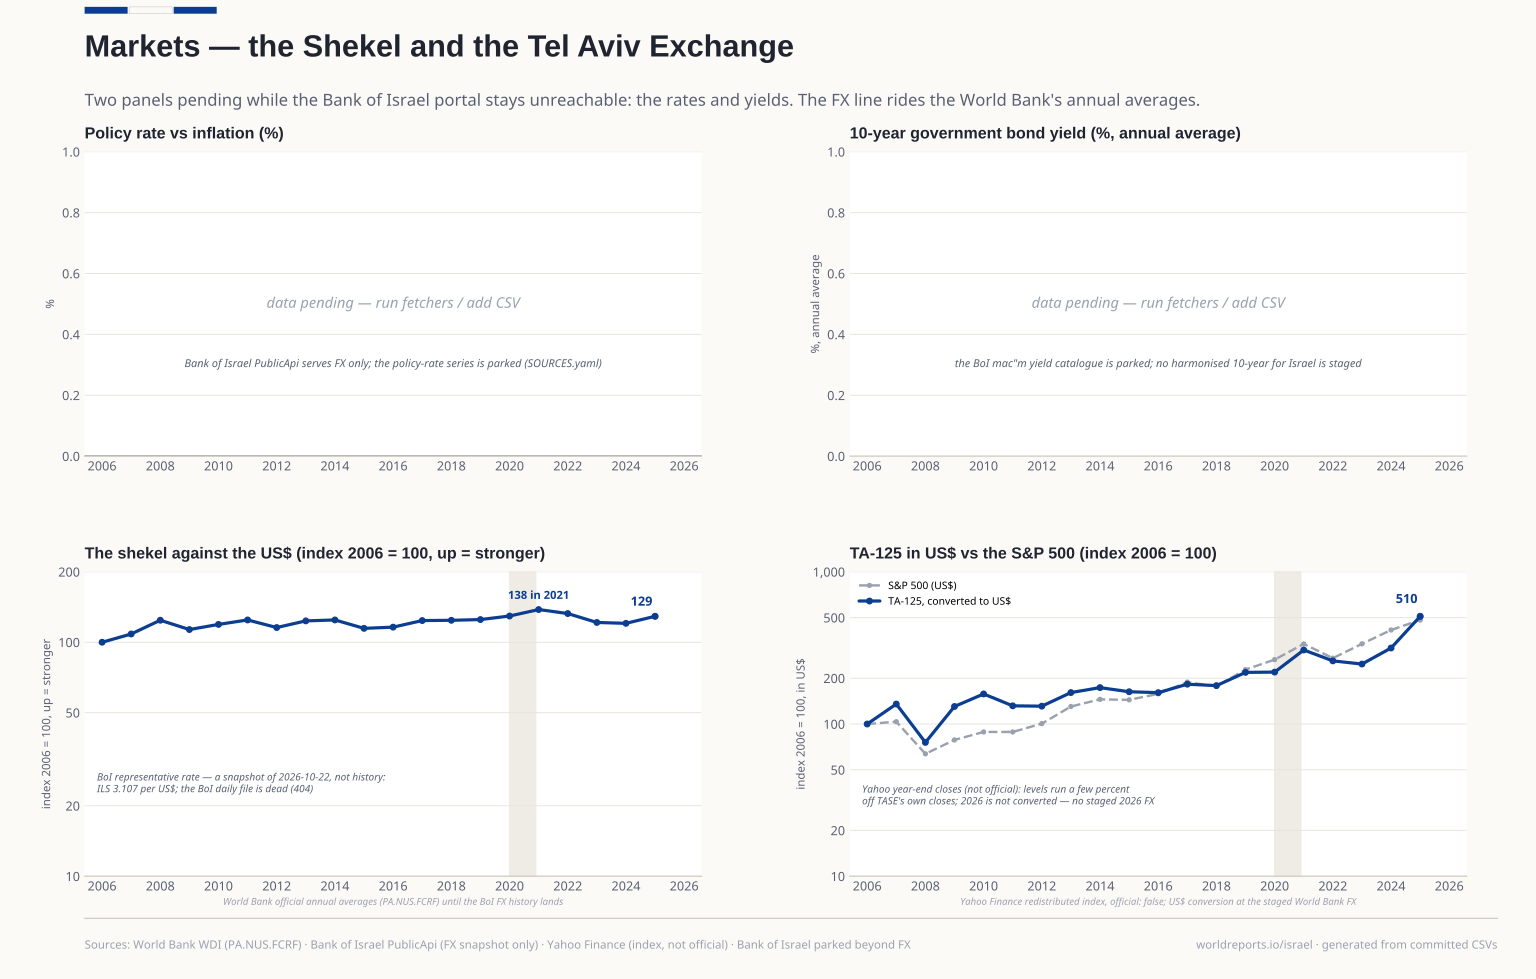
markets/sp500.csv | The spine's dashed yardstick for markets slot 4, staged on the same route as for the other countries (2008 close 903.25, asserted identically in… | S&P 500 close, redistributed by Yahoo Finance | 2005-2026 | Other |
|---|
markets/ta125.csv | VERIFIED 2026-10-22 (interval=1y is rejected; range=max is NOT safe for every symbol — for ^GSPC it serves coarse bars with wrong-month closes… | Tel Aviv Stock Exchange TA-125 close, redistributed by Yahoo Finance | 2005-2026 | Other |
|---|
markets/usdils.csv | VERIFIED 2026-10-22 (the discovery pass's named stopgap, now pulled): 2019 3.5645, 2023 3.6674, 2024 3.6997, 2025 3.4519 ILS per US$ annual mean. The… | World Bank WDI — PA.NUS.FCRF official annual average FX | 2005-2025 | Other |
|---|
markets/usdils_boi.csv | VERIFIED 2026-10-22, live JSON: {exchangeRates:[{key:"USD", currentExchangeRate:3.107, currentChange, unit, lastUpdate}]}, updated intraday… | Bank of Israel — PublicApi representative exchange rates | — | Official |
|---|
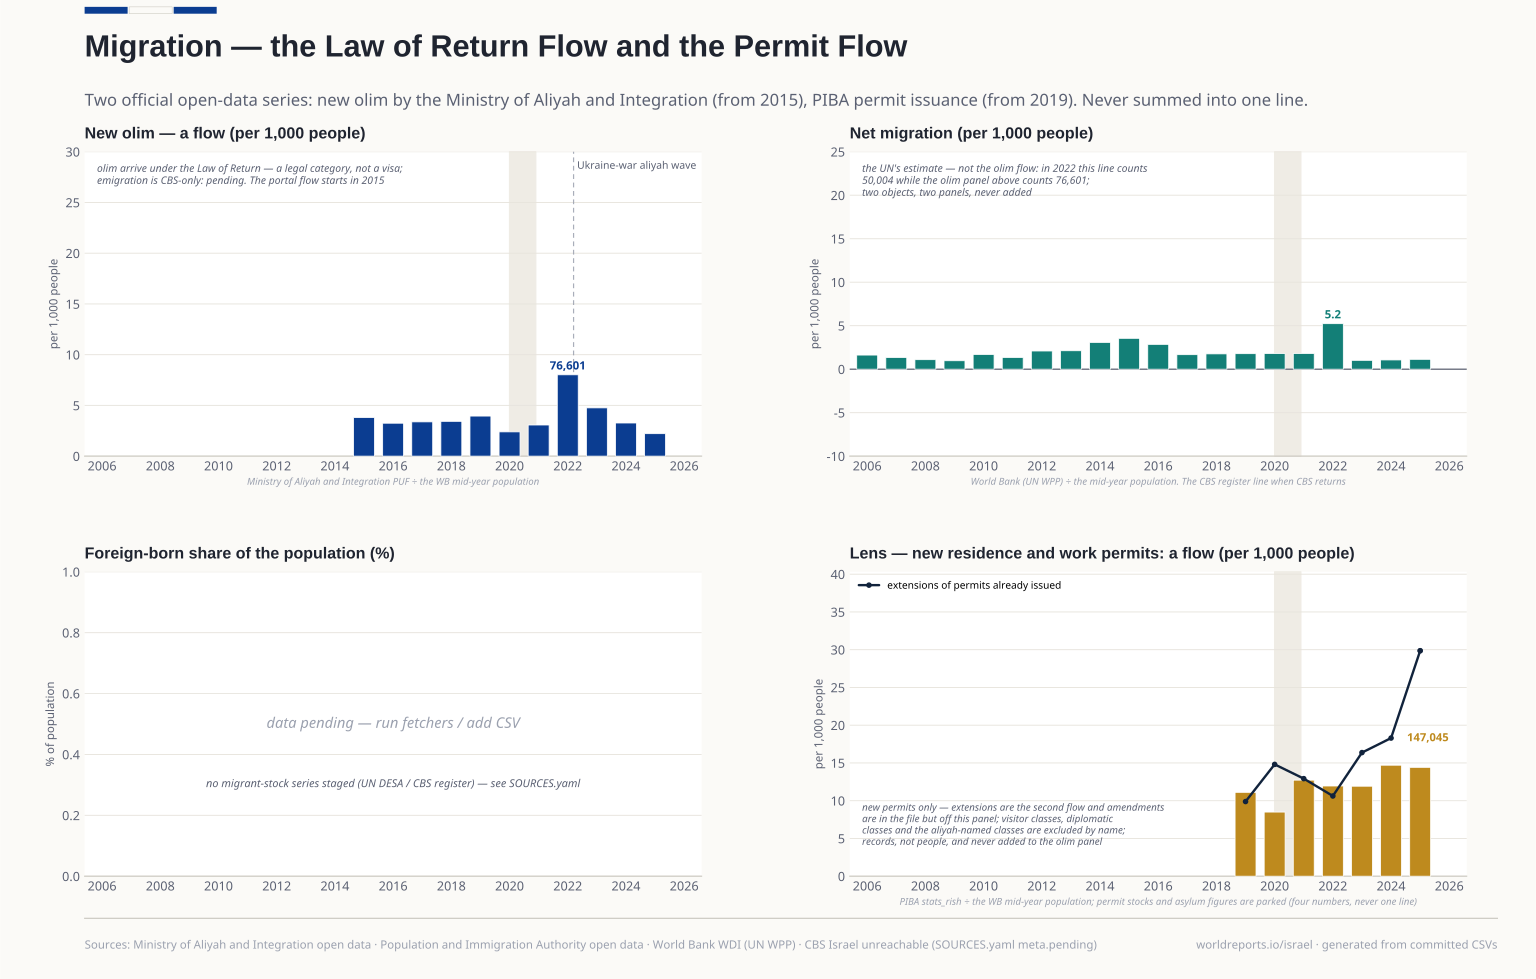
migration/olim_flow.csv | VERIFIED 2026-10-22, CKAN datastore live: person-level PUF aggregated client-side to year counts with the male/female split (male+female must equal… | Ministry of Aliyah and Integration — new olim PUF, open data | 2015-2025 | Official |
|---|
migration/permits.csv | VERIFIED 2026-10-22, CKAN datastore live: monthly issuance rows (2019 onward, the 'מתעדכן' resource; older snapshots on the package are padded 2013… | Population and Immigration Authority (PIBA) — visa/permit issuance, stats_rish | 2019-2026 | Official |
|---|
security/crime_by_group.csv | VERIFIED 2026-10-22, CKAN datastore live: the dictionary CSV (5,286 rows: StatisticCrimeGroupCode/Name, StatisticCrimeType- Code/Name, CrimeName… | Israel Police — crime records, open data | 2021-2025 | Official |
|---|
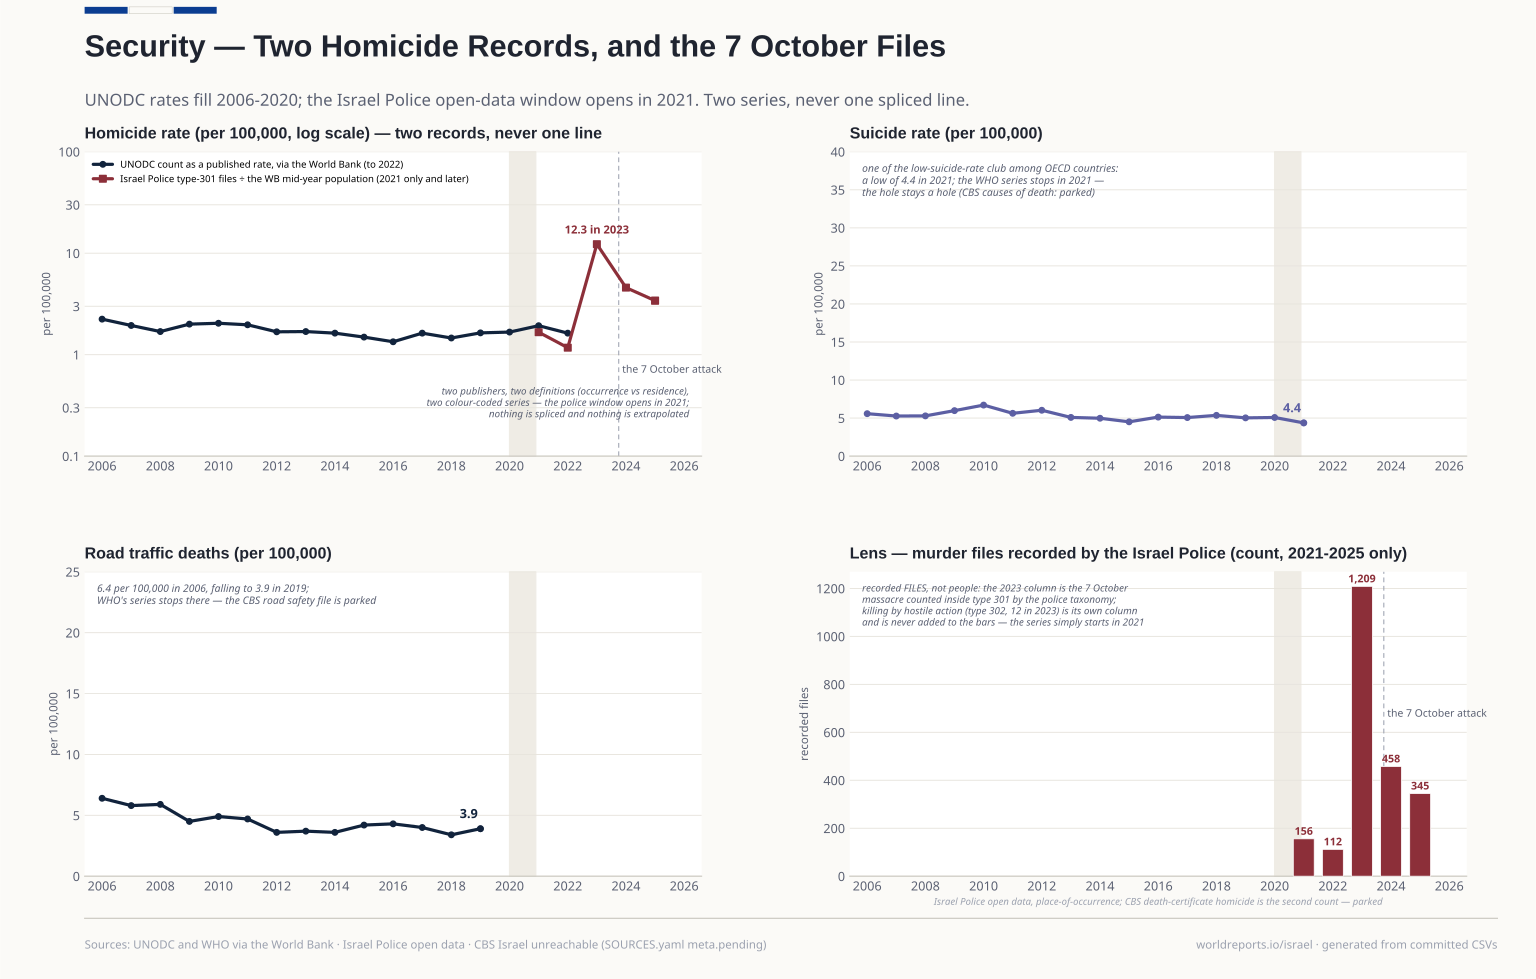
security/homicide_police.csv | Murder (type 301): 2021 156, 2022 112, 2023 1,209, 2024 458, 2025 345. The 2023 jump is the October-7-2023 massacre recorded as murder files in the… | Israel Police — crime records, StatisticTypeKod 301 (רצח) / 302 (hostile action) | 2021-2025 | Official |
|---|
security/security.csv | VERIFIED 2026-10-22. UNODC homicide rate 1.93/100k (2021) is the spine's beside-line for the police count below, and fills the 2006-2020 half the… | World Bank WDI (UNODC/WHO republished) — VC.IHR.PSRC.P5, SH.STA.SUIC.P5, SH.STA.TRAF.P5 | 2005-2022 | Other |
|---|
social/labour.csv | VERIFIED 2026-10-22, live: 1,059 series for ISR, quarterly observations to 2026-Q2 and monthly to 2026-08 in one payload. Key quirk: nine key… | OECD SDMX REST — Israel LFS (OECD.SDD.TPS, DSD_LFS@DF_IALFS_INDIC) | 2005-2025 | Other |
|---|
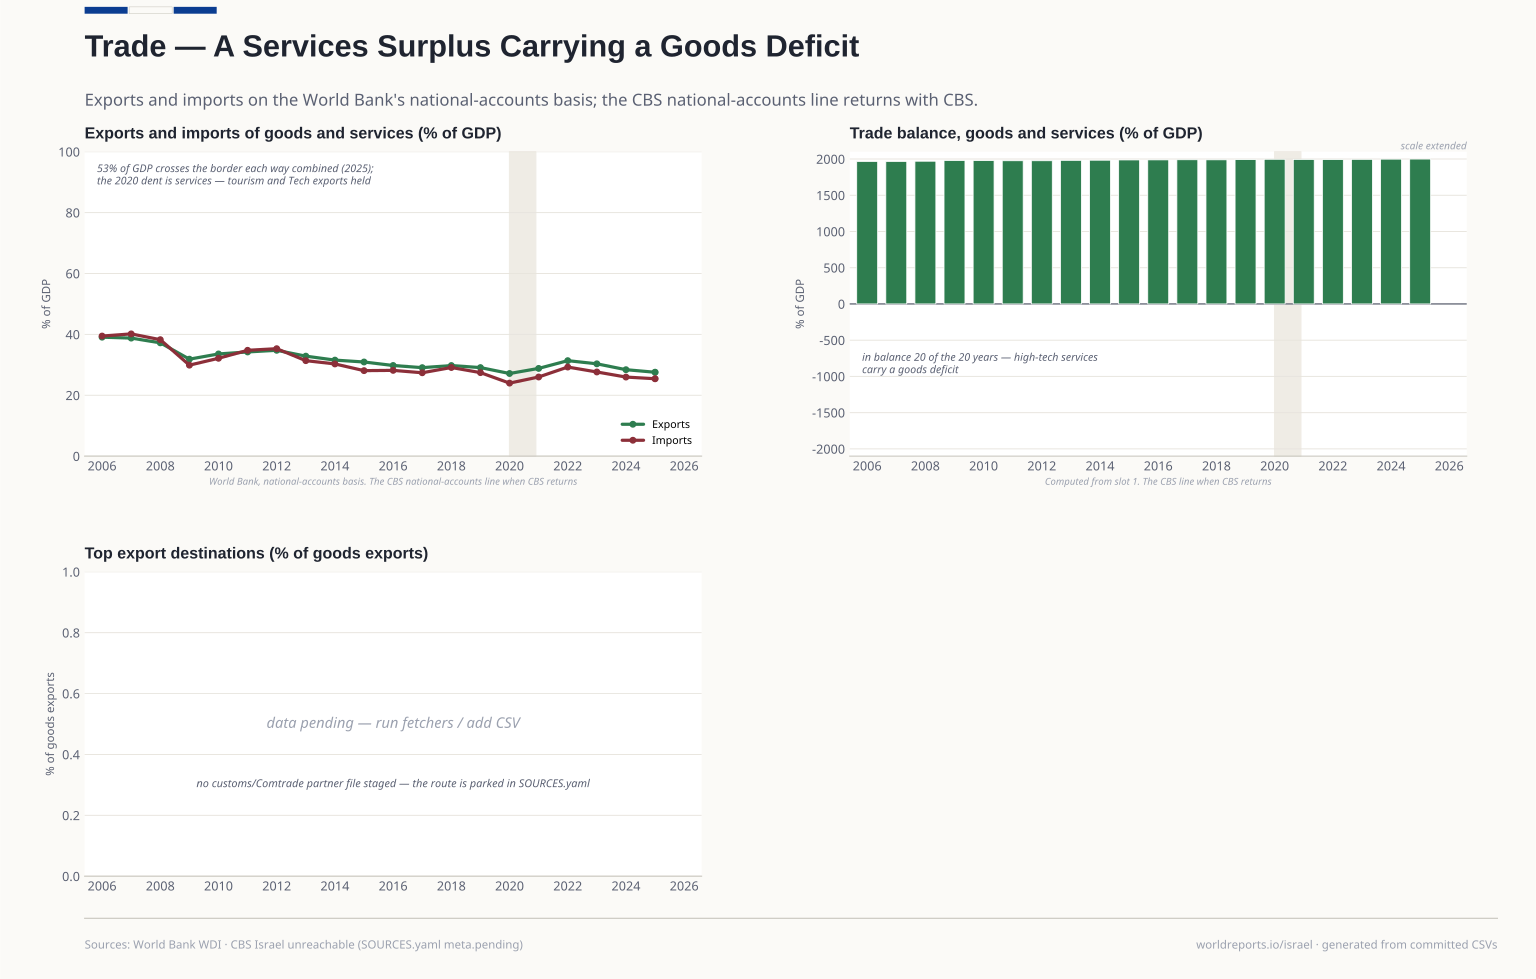
trade/trade.csv | VERIFIED 2026-10-22: 2024 exports 28.4 and imports 26.0 percent of GDP, the services surplus carrying a goods deficit. The CBS national-accounts… | World Bank WDI — NE.EXP.GNFS.ZS, NE.IMP.GNFS.ZS | 2005-2025 | Other |
|---|
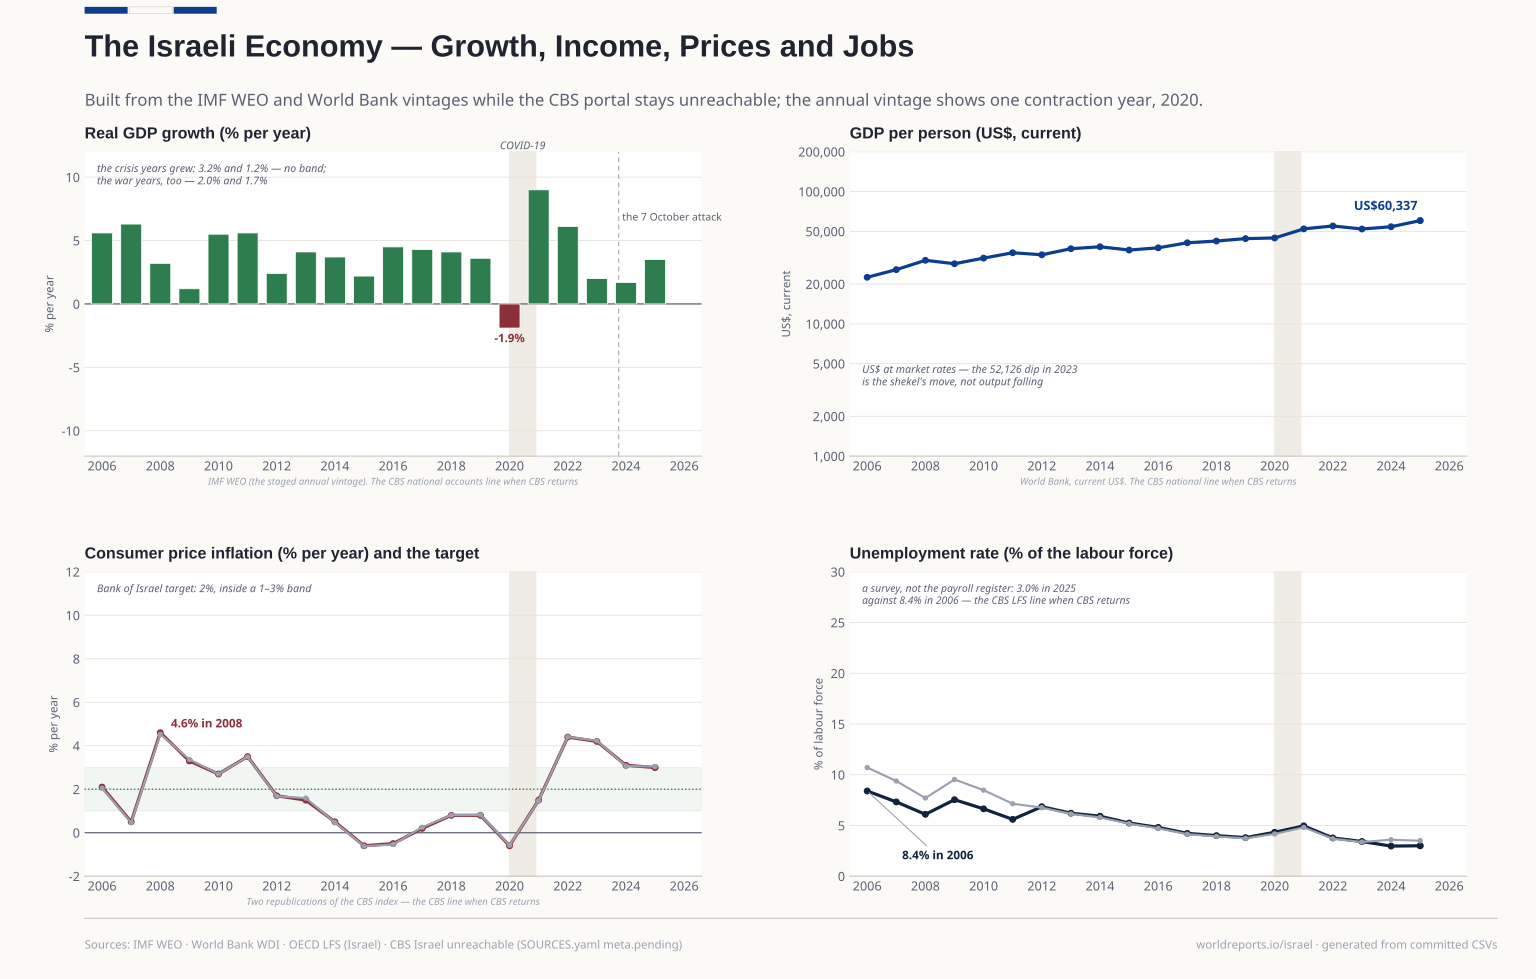 Plate 01