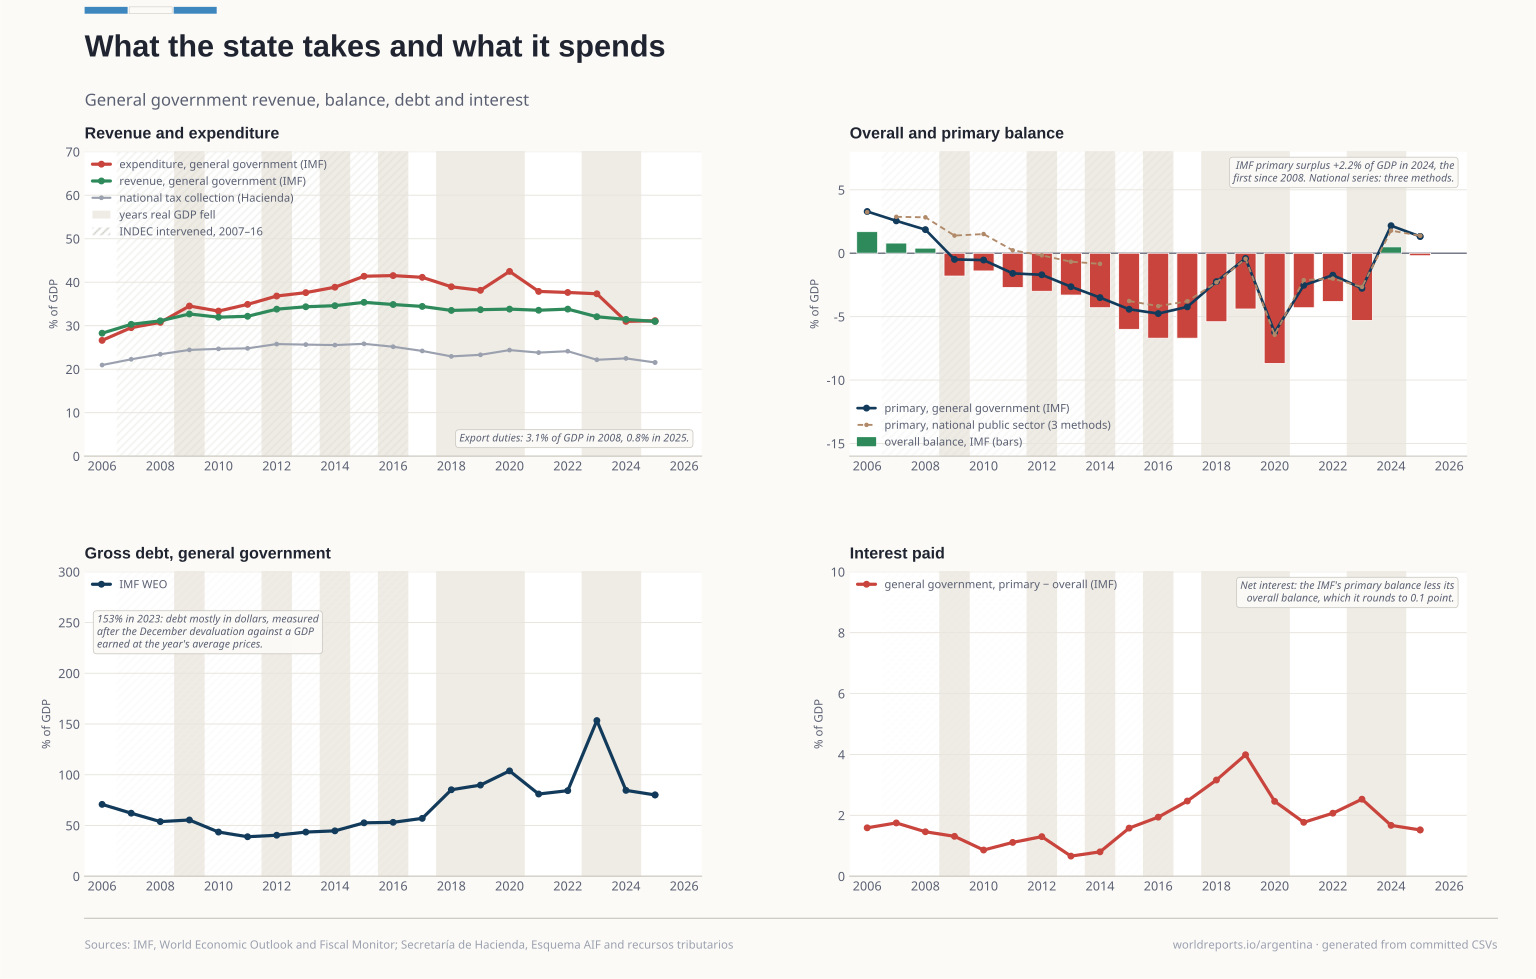
fiscal/general_government.csv | World Economic Outlook and Fiscal Monitor, via DataMapper (GGR_G01_GDP_PT (Fiscal Monitor), G_X_G01_GDP_PT (Fiscal Monitor), GGXCNL_NGDP (WEO)… | IMF | 2006-2025 | Other |
|---|
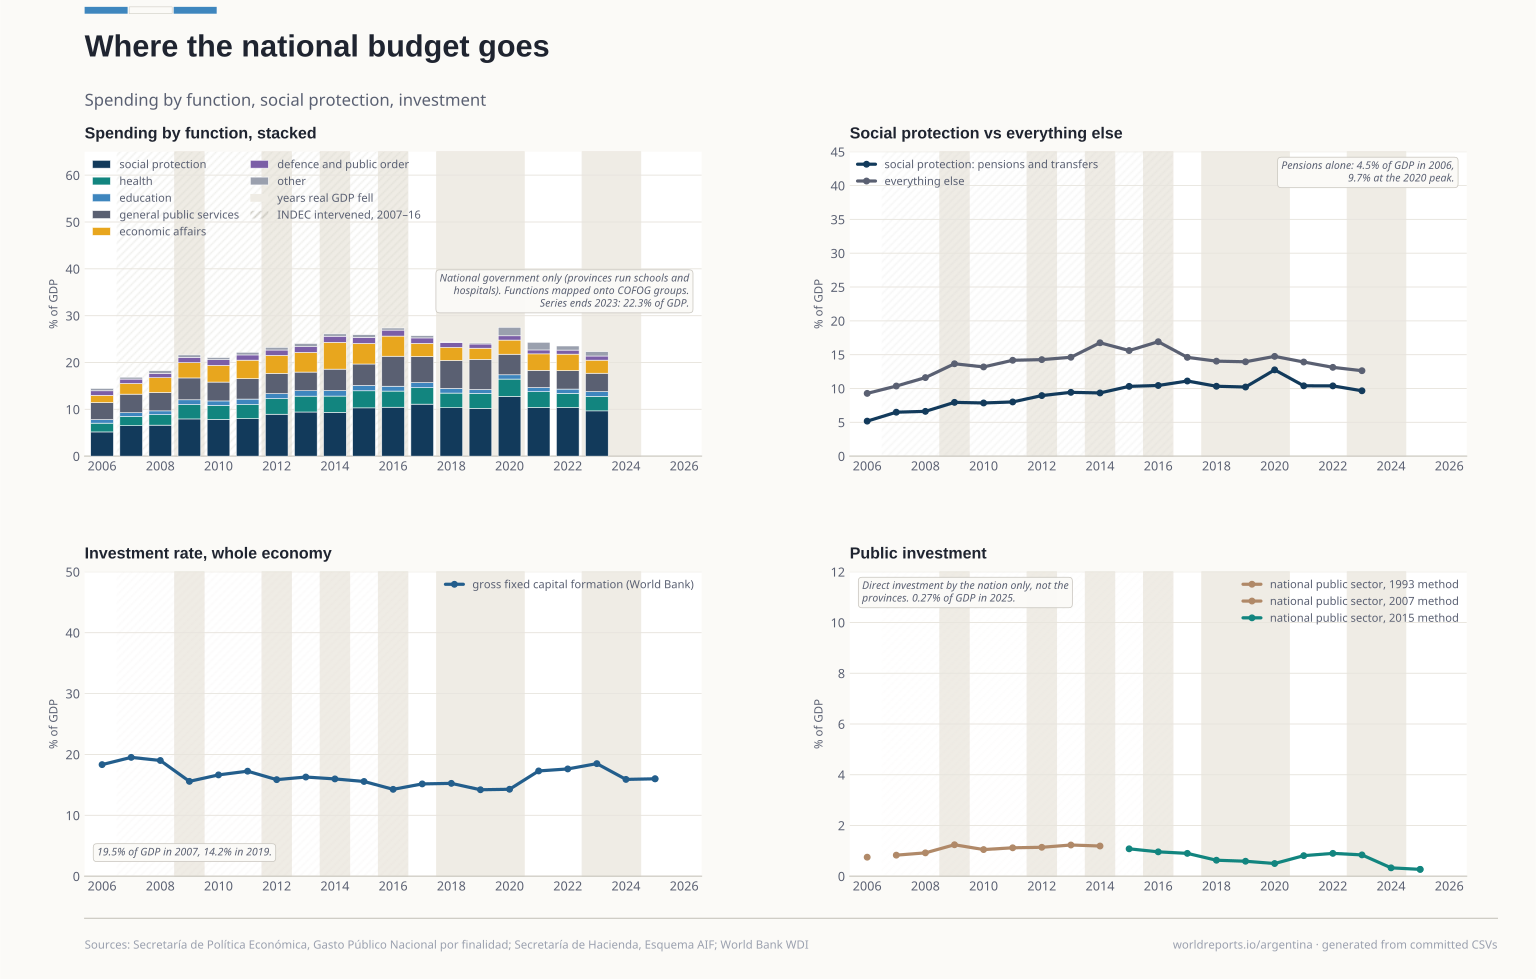
fiscal/primary_result.csv | Primary balance of the non-financial public sector, % of GDP | Secretaría de Hacienda — Esquema Ahorro-Inversión-Financiamiento | 2006-2026 | Official |
|---|
fiscal/public_investment.csv | National public sector direct investment, % of GDP | Secretaría de Hacienda — Esquema Ahorro-Inversión-Financiamiento | 2006-2026 | Official |
|---|
fiscal/spending_by_function.csv | Primary public spending by function, % of GDP | Secretaría de Política Económica — Gasto Público Consolidado | 2006-2026 | Official |
|---|
fiscal/tax_revenue.csv | Tax revenue, total and selected taxes, % of GDP | Secretaría de Hacienda — Recursos tributarios | 2006-2026 | Official |
|---|
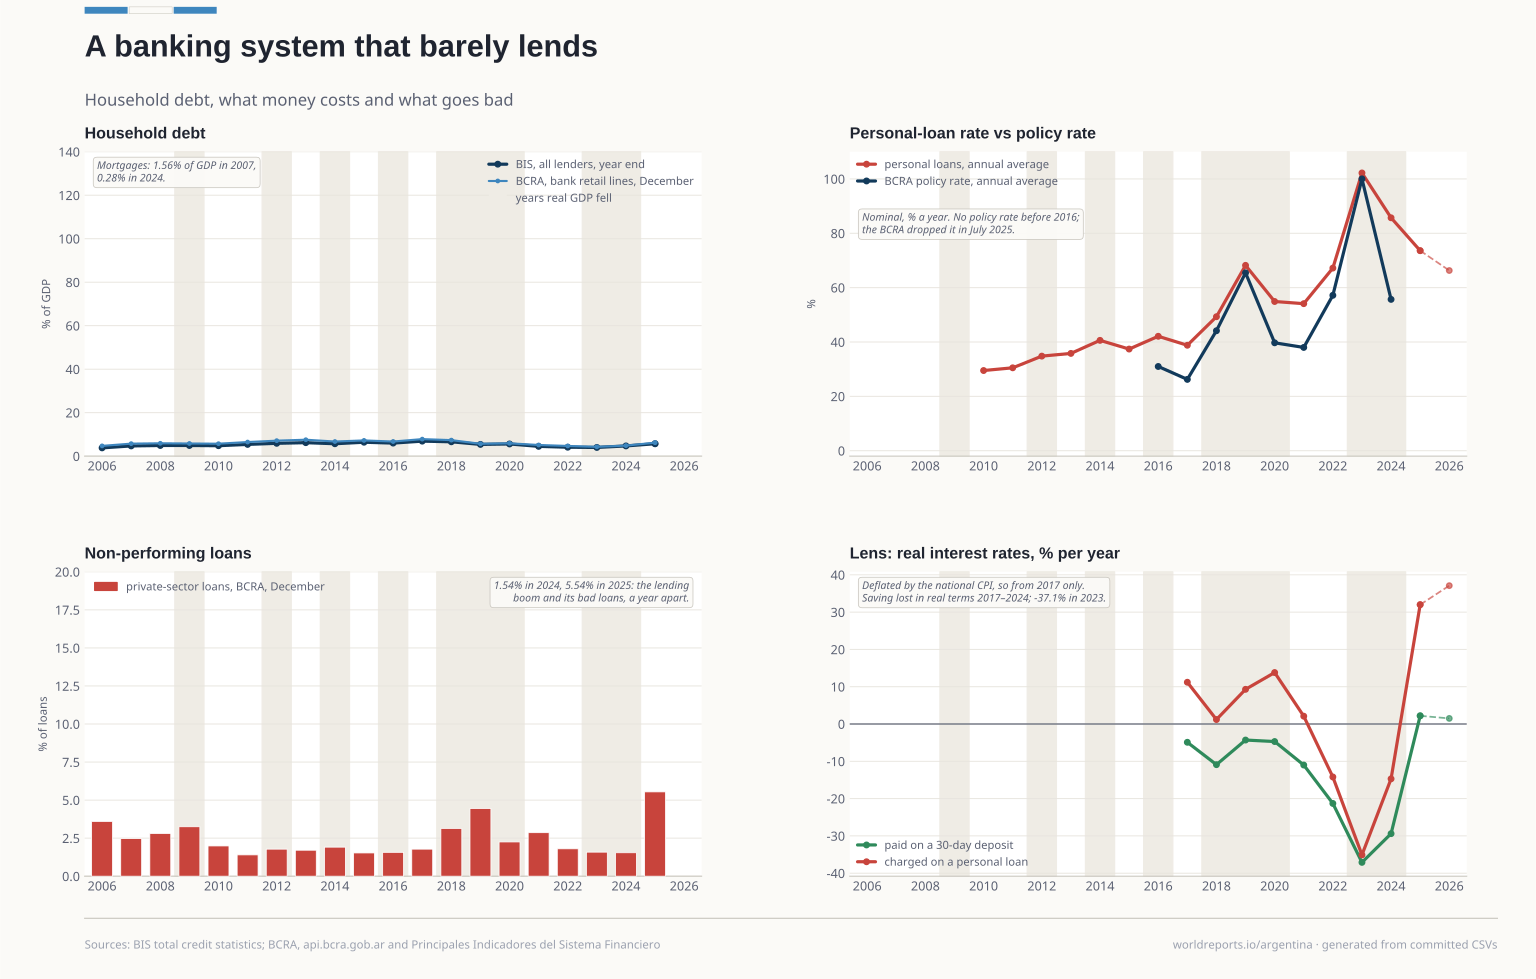
macro/credit.csv | Credit to the private sector and household borrowing, % of GDP | BCRA | 2006-2026 | Official |
|---|
macro/credit_quality.csv | Non-performing loans and credit as a share of bank assets | BCRA — Principales Indicadores del Sistema Financiero | 2006-2026 | Official |
|---|
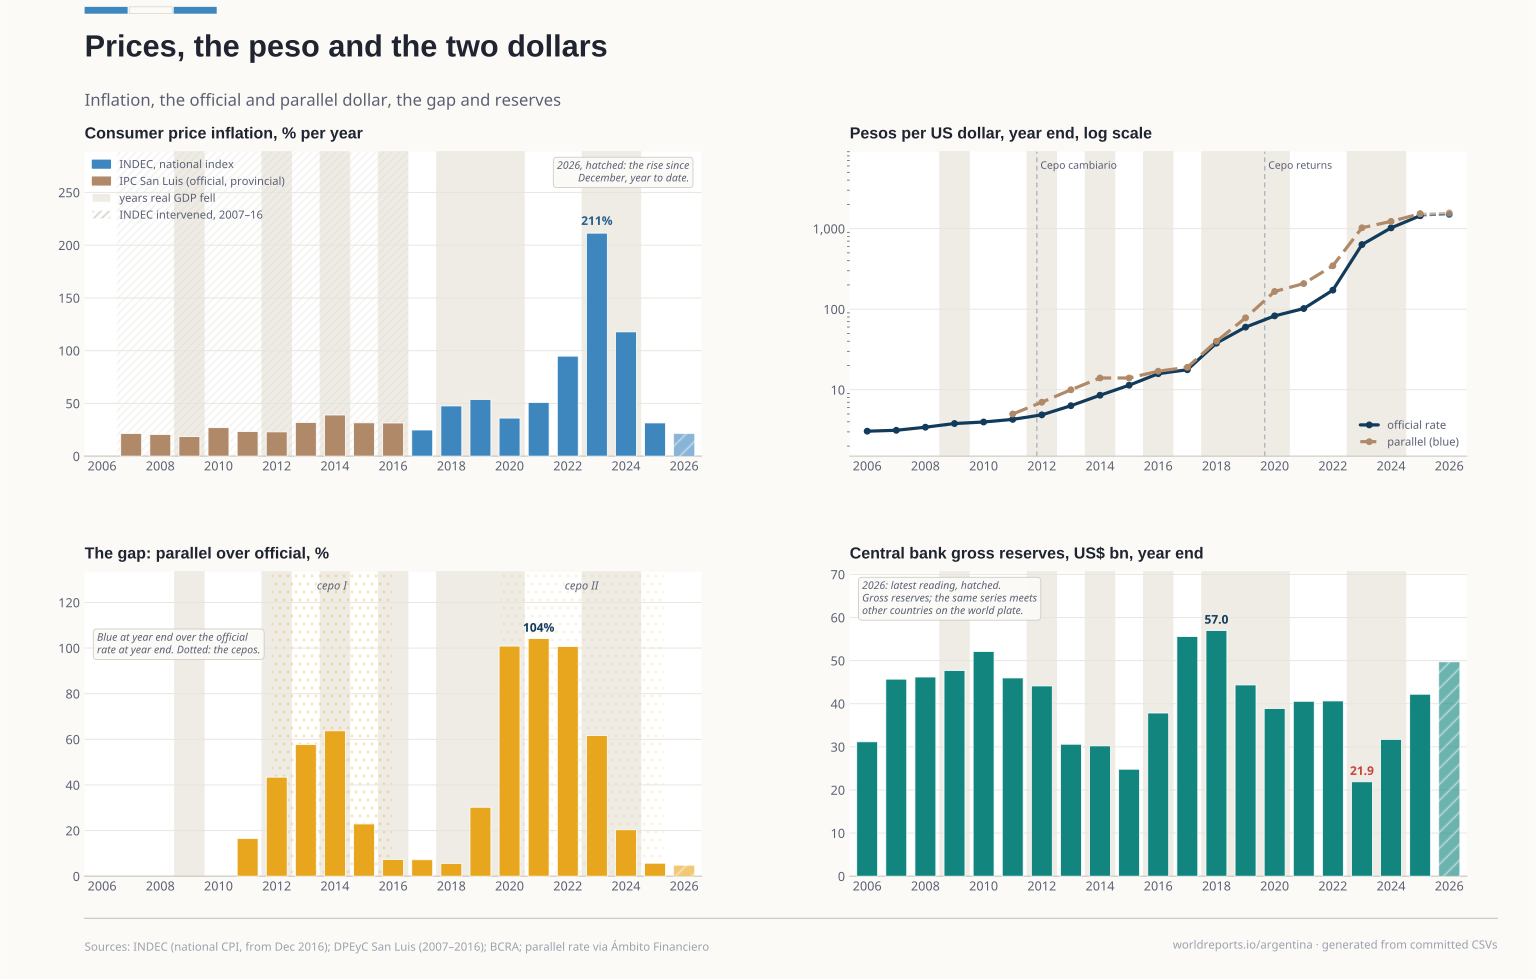
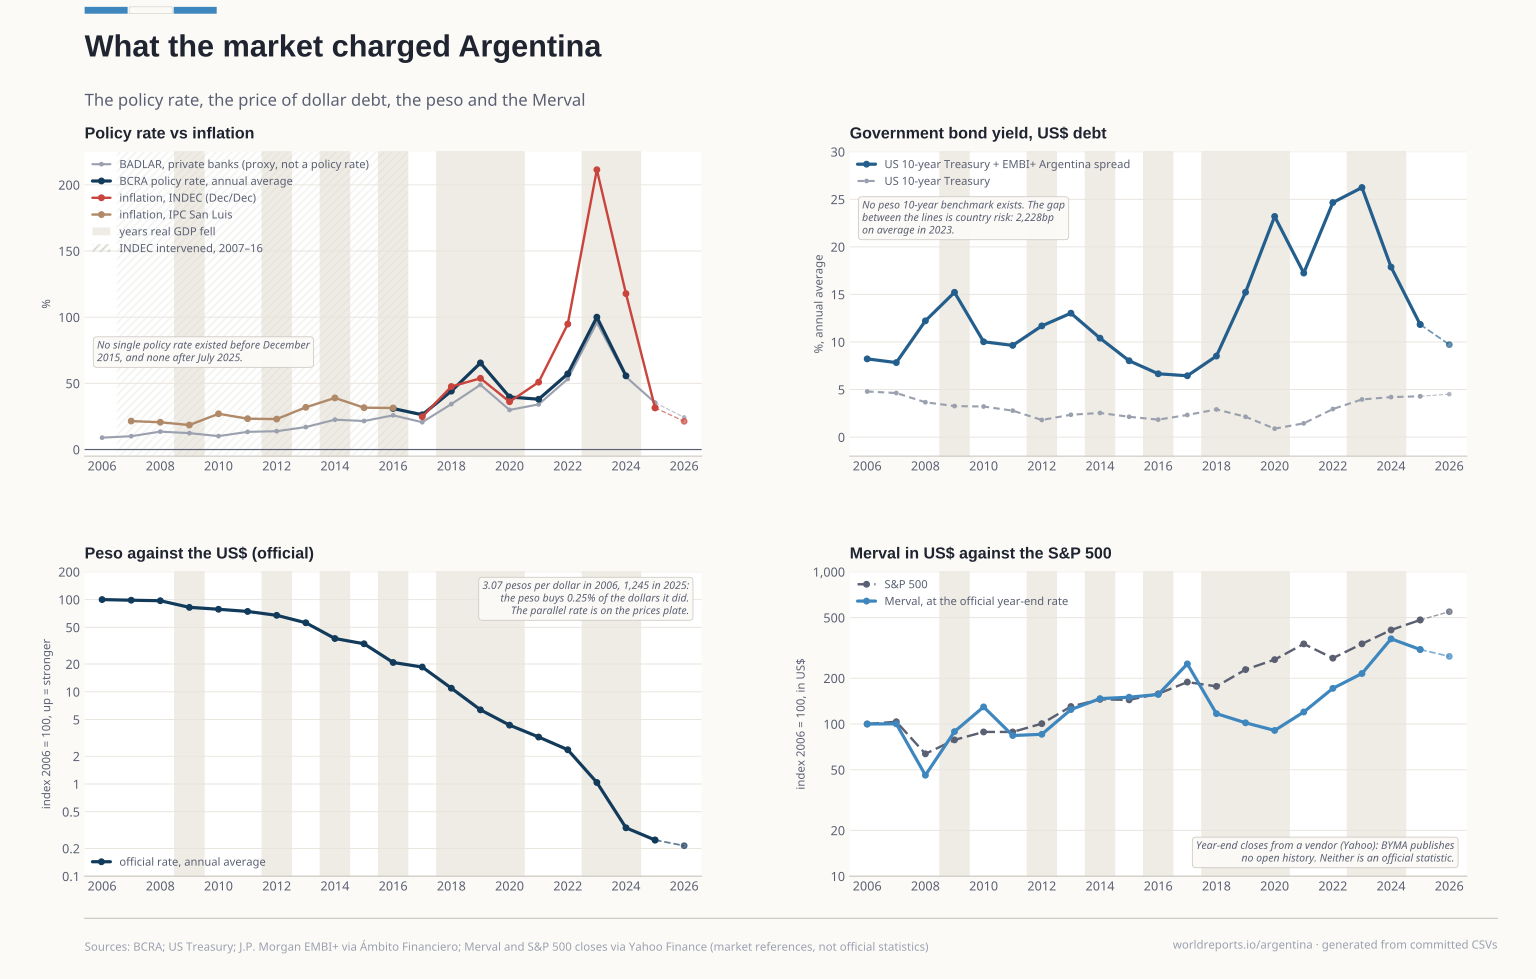
macro/dollar.csv | Official exchange rate, annual average and year end | BCRA — tipo de cambio de valuación | 2006-2026 | Official |
|---|
macro/economy_intl.csv | World Development Indicators (NE.GDI.FTOT.ZS, SL.UEM.TOTL.ZS) | World Bank | 2006-2025 | Other |
|---|
macro/gdp.csv | GDP in dollars and pesos, real growth, GDP per capita, population | INDEC — Cuentas Nacionales, base 2004 | 2006-2026 | Official |
|---|
macro/household_credit.csv | total credit statistics, WS_TC Q.AR.H.A.M.770.A | BIS | 2006-2026 | Other |
|---|
macro/ipc.csv | Consumer price inflation, December to December | INDEC (national index, from December 2016); Dirección Provincial de Estadística y Censos de San Luis (2007-2016) | 2006-2026 | Official |
|---|
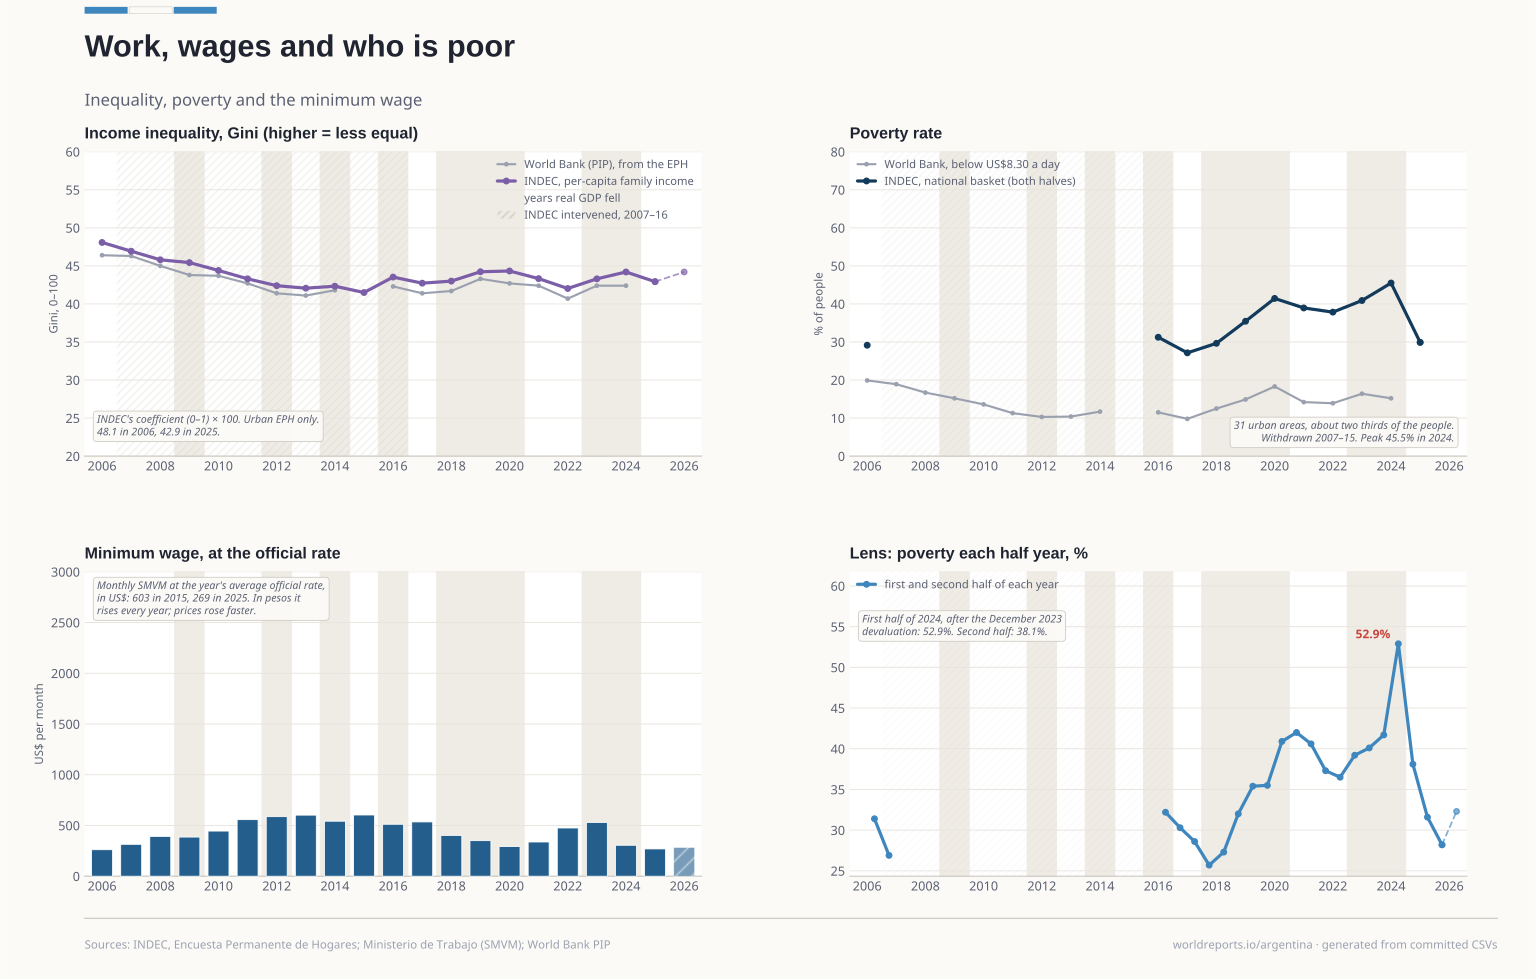
macro/minimum_wage.csv | Minimum wage, in pesos of the year and in dollars | Ministerio de Trabajo — Salario Mínimo Vital y Móvil | 2006-2026 | Official |
|---|
macro/policy_rate.csv | BCRA monetary-policy rate and BADLAR, annual average | BCRA | 2006-2026 | Official |
|---|
macro/rates.csv | Interest rates, nominal and real | BCRA | 2006-2026 | Official |
|---|
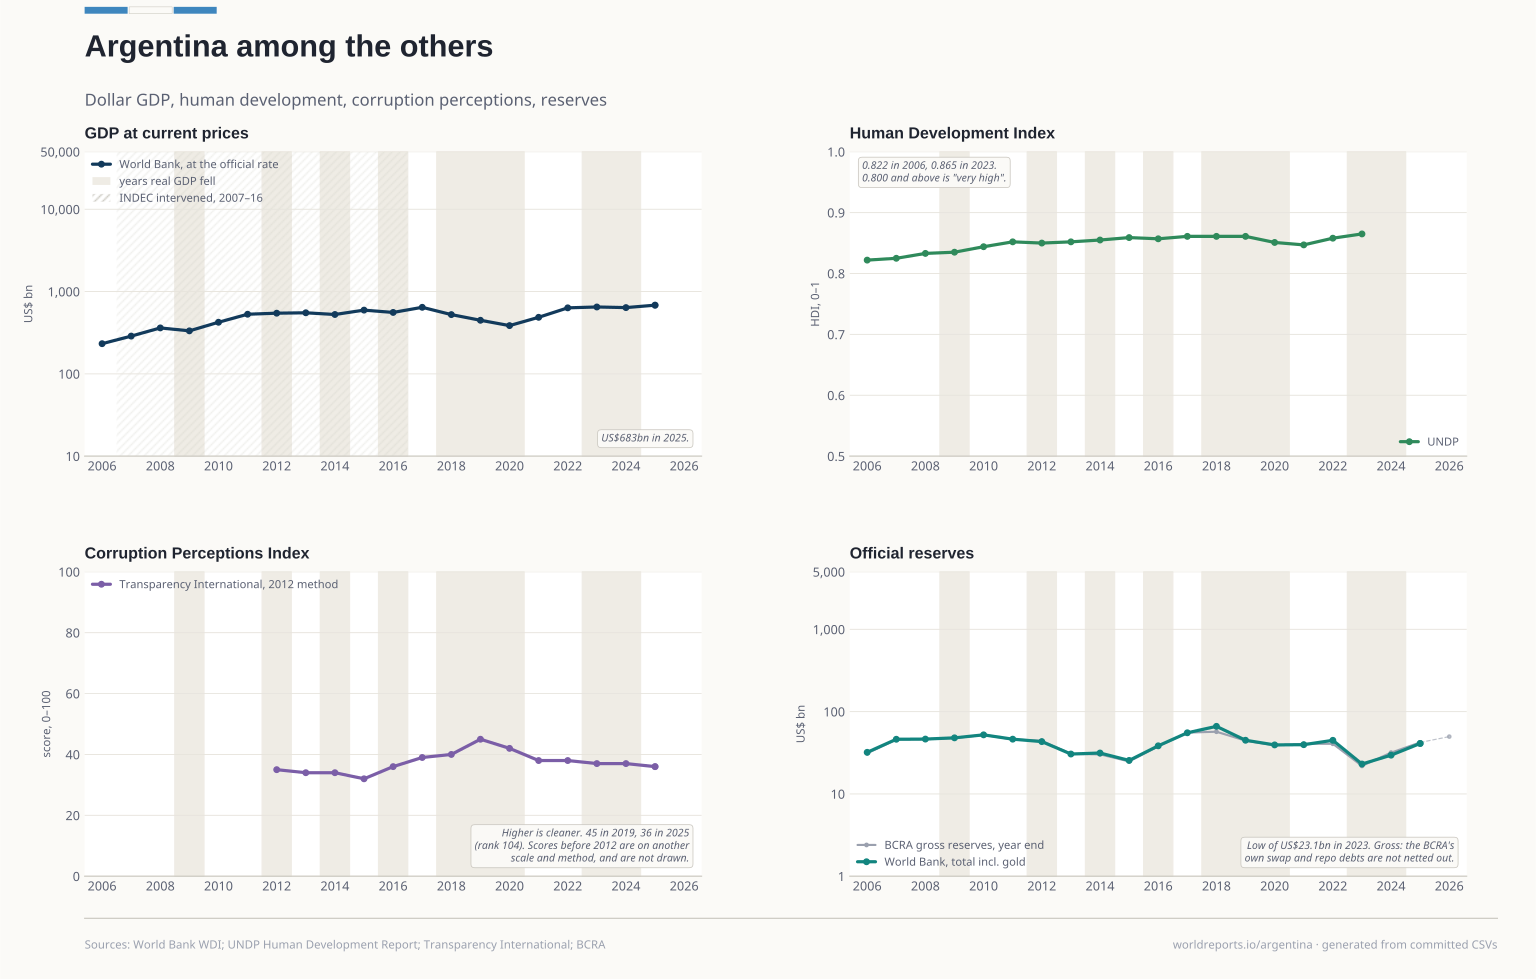
macro/reserves.csv | Central bank international reserves, year end | BCRA | 2006-2026 | Official |
|---|
macro/unemployment.csv | Unemployment rate | INDEC — Encuesta Permanente de Hogares | 2006-2026 | Official |
|---|
macro/world.csv | World Development Indicators (NY.GDP.MKTP.CD, NY.GDP.PCAP.CD, FI.RES.TOTL.CD) | World Bank | 2006-2025 | Other |
|---|
markets/country_risk.csv | EMBI+ Argentina spread, basis points | J.P. Morgan, via Ámbito Financiero and api.argentinadatos.com | 2005-2026 | Other |
|---|
markets/merval.csv | Merval index, year-end close | Yahoo Finance (^MERV) | 2005-2026 | Other |
|---|
markets/parallel_fx.csv | Parallel exchange rates — blue and contado con liquidación | Ámbito Financiero, via api.argentinadatos.com | 2005-2026 | Other |
|---|
markets/sp500.csv | S&P 500 index, year-end close | Yahoo Finance (^GSPC) | 2005-2026 | Other |
|---|
markets/us_treasury_10y.csv | US 10-year Treasury par yield, annual average | U.S. Department of the Treasury — Daily Treasury Par Yield Curve Rates | 2006-2026 | Official |
|---|
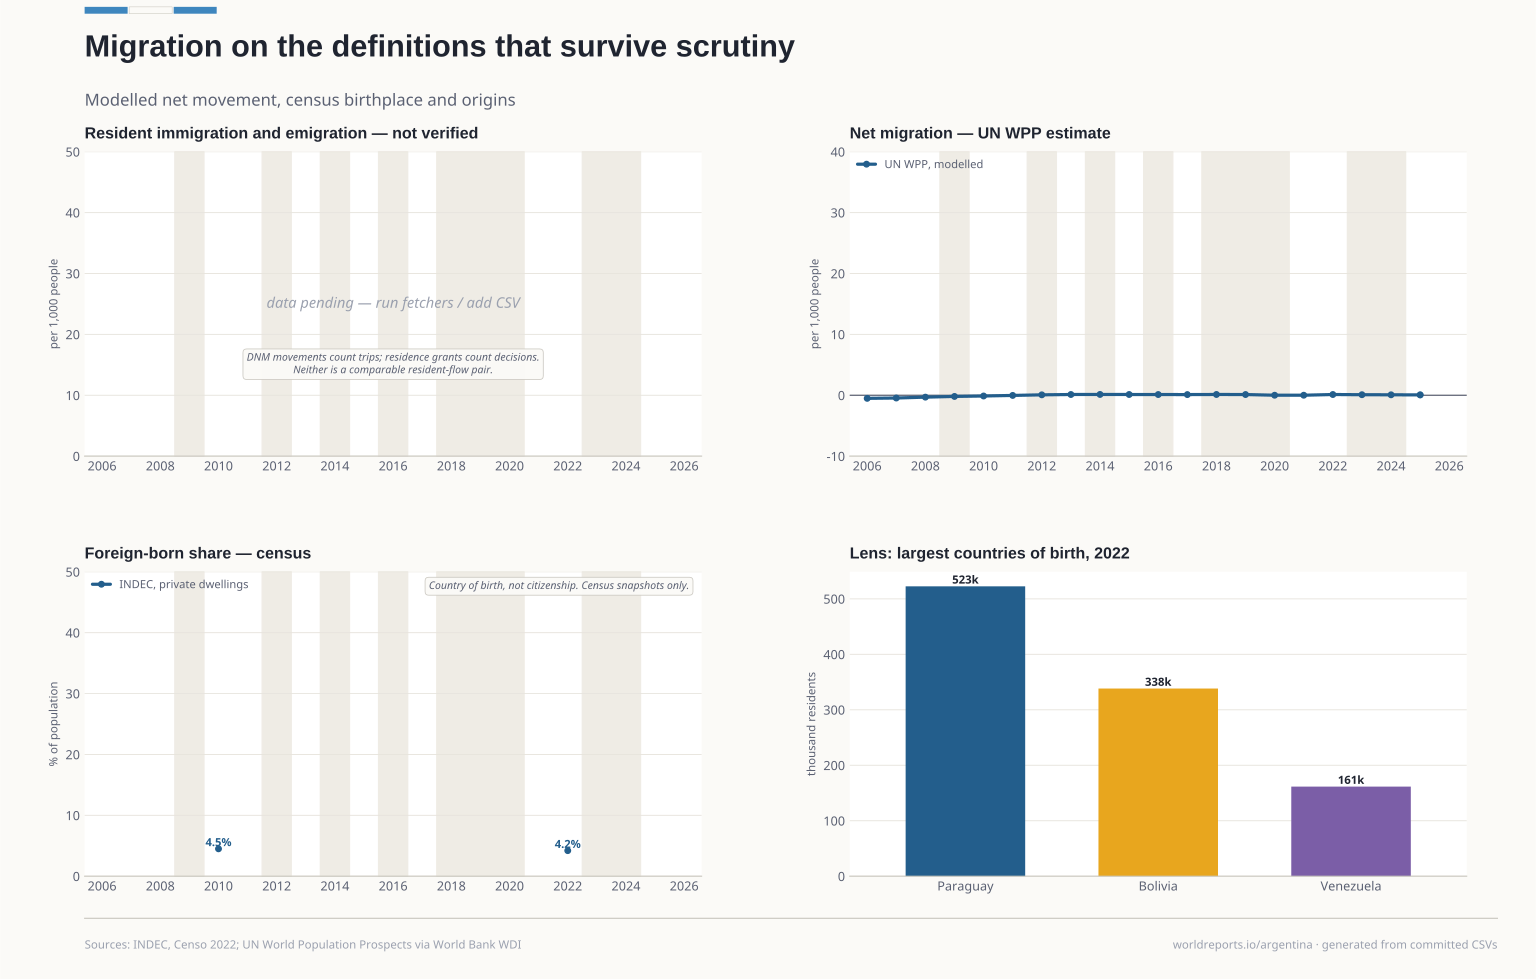
migration/foreign_born_census.csv | Foreign-born residents in private dwellings, census snapshots | INDEC — Censo Nacional de Población, Hogares y Viviendas 2022 | 2010-2022 | Official |
|---|
migration/origins_census_2022.csv | Largest countries of birth among foreign-born residents, 2022 | INDEC — Censo Nacional de Población, Hogares y Viviendas 2022 | 2022-2022 | Official |
|---|
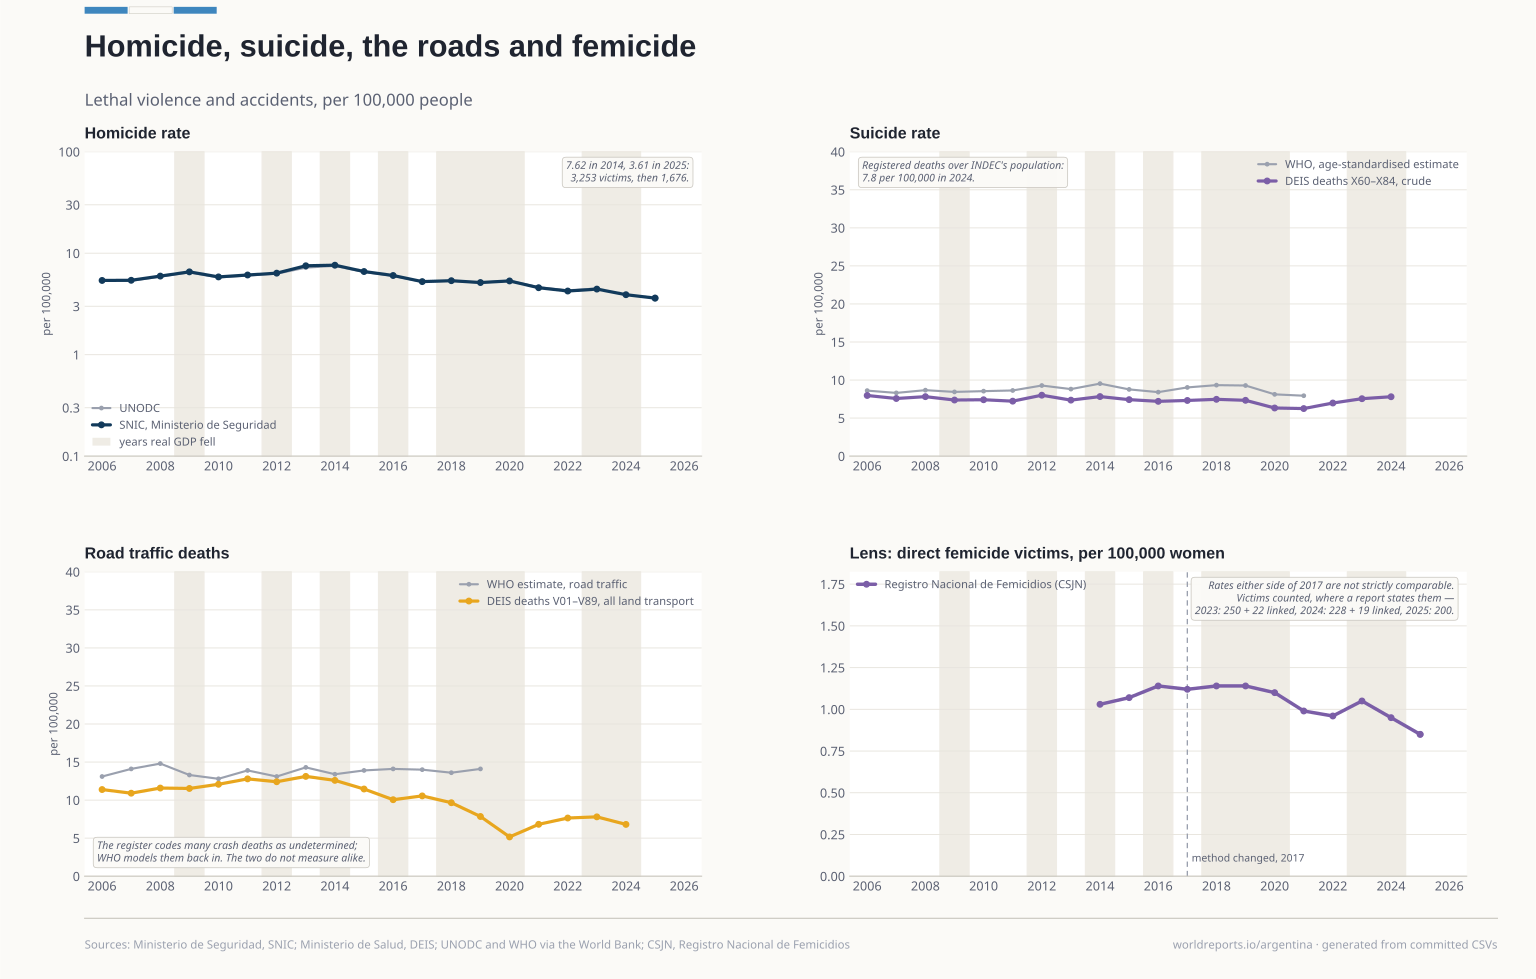
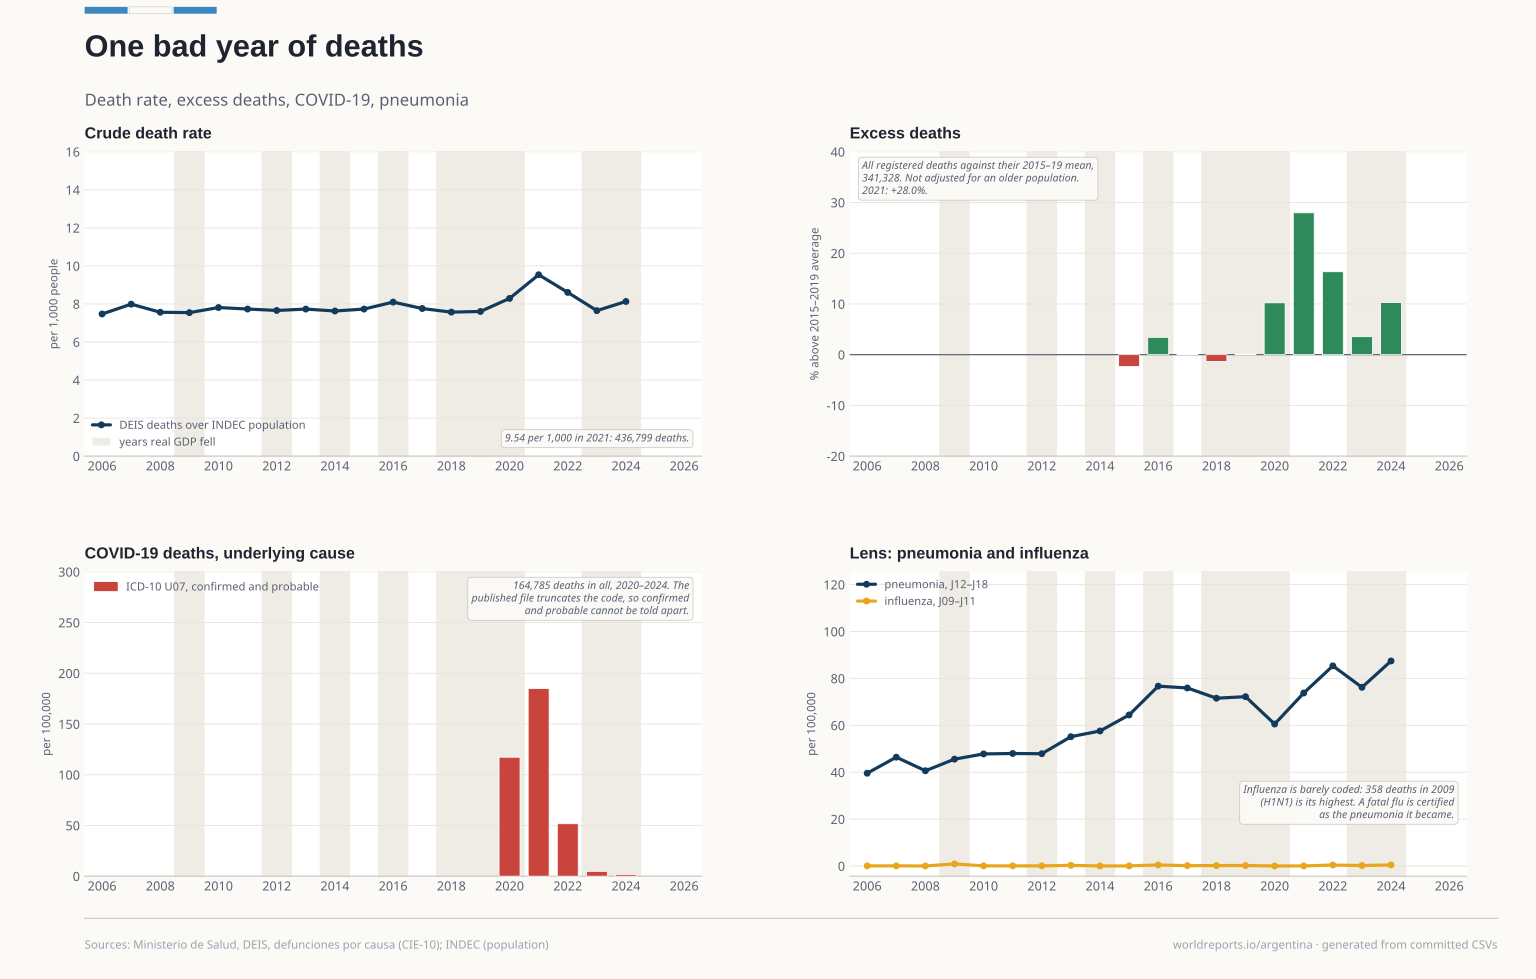
social/causes.csv | Deaths by cause — COVID-19, influenza, pneumonia, suicide, land transport | Ministerio de Salud — DEIS, defunciones por causa (CIE-10) | 2006-2026 | Official |
|---|
social/corruption.csv | Corruption Perceptions Index, score and rank | Transparency International | 2012-2025 | Other |
|---|
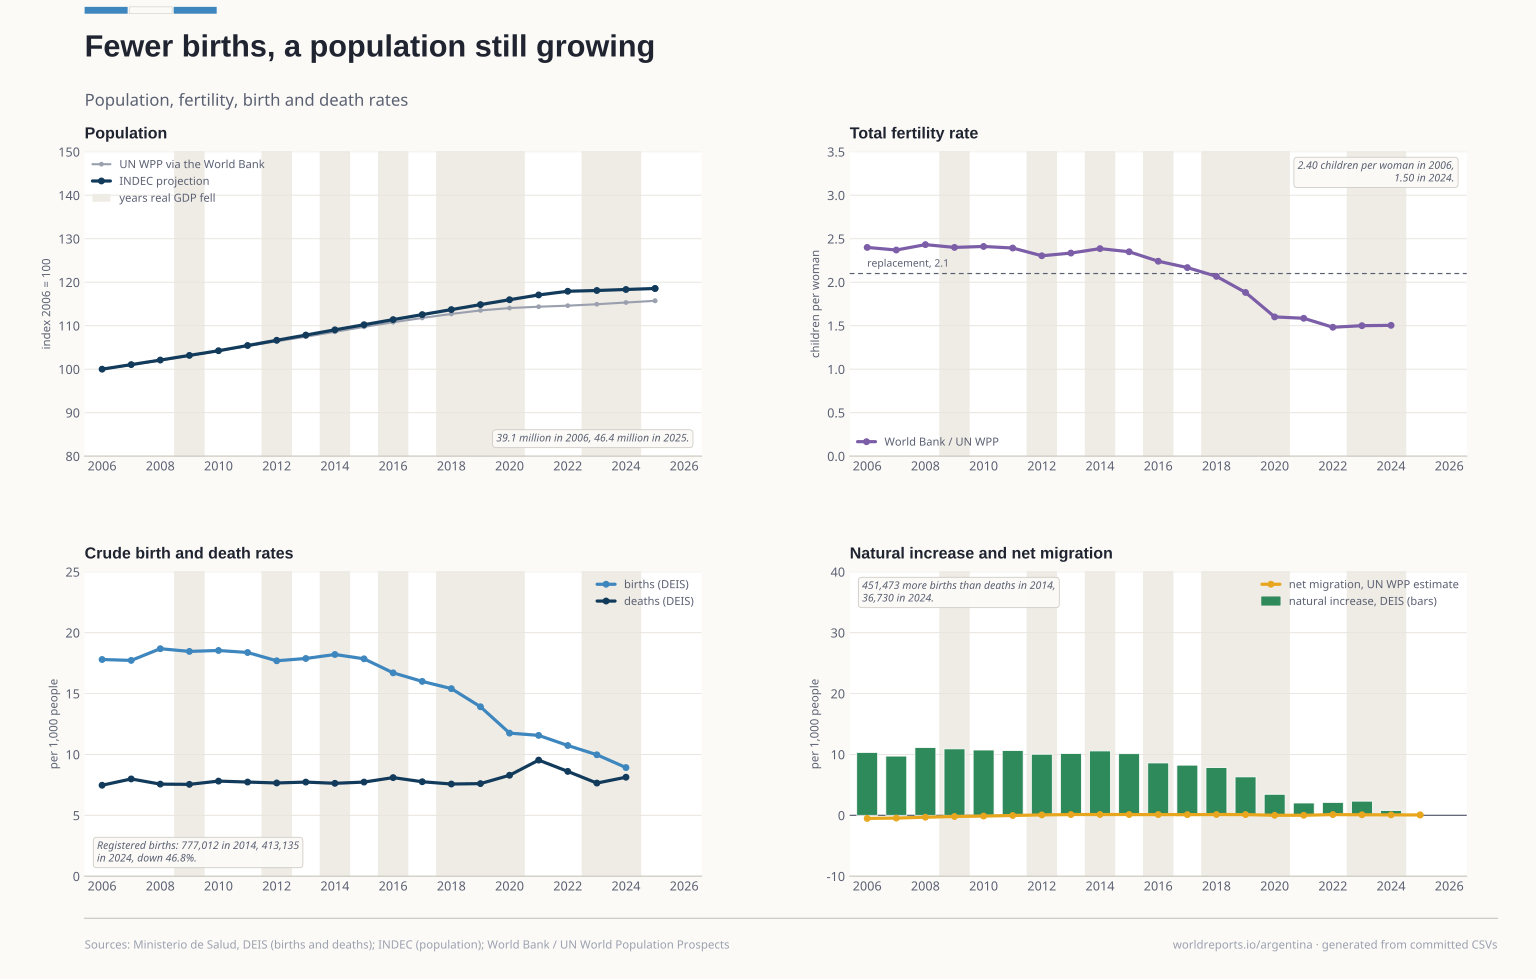
social/demography_intl.csv | World Development Indicators (SP.POP.TOTL, SP.POP.TOTL.FE.IN, SP.DYN.TFRT.IN, SP.DYN.CBRT.IN, SP.DYN.CDRT.IN, SM.POP.NETM), from the UN World… | World Bank | 2006-2025 | Other |
|---|
social/femicides.csv | Direct femicide victims, rate and counts | Corte Suprema de Justicia de la Nación, Oficina de la Mujer — Registro Nacional de Femicidios de la Justicia Argentina | 2006-2026 | Official |
|---|
social/gini.csv | Gini coefficient of per-capita family income, annual average | INDEC — Encuesta Permanente de Hogares | 2006-2026 | Official |
|---|
social/gini_intl.csv | Gini index, World Bank (PIP) | World Bank — Poverty and Inequality Platform (SI.POV.GINI) | 2006-2024 | Other |
|---|
social/hdi.csv | Human Development Index | UNDP — Human Development Report | 2005-2023 | Official |
|---|
social/homicides.csv | Intentional homicide victims and rate | Ministerio de Seguridad — Sistema Nacional de Información Criminal | 2006-2026 | Official |
|---|
social/poverty.csv | Population below the poverty line, by half year | INDEC — Encuesta Permanente de Hogares | 2006-2026 | Official |
|---|
social/poverty_intl.csv | Poverty headcount at US$8.30 and US$3.00 a day (2021 PPP) | World Bank — Poverty and Inequality Platform | 2006-2024 | Other |
|---|
social/security_intl.csv | World Development Indicators: VC.IHR.PSRC.P5 (UNODC), SH.STA.SUIC.P5 and SH.STA.TRAF.P5 (WHO Global Health Estimates) | World Bank | 2006-2023 | Other |
|---|
social/vitals.csv | Births, deaths and natural increase | Ministerio de Salud — DEIS | 2006-2026 | Official |
|---|
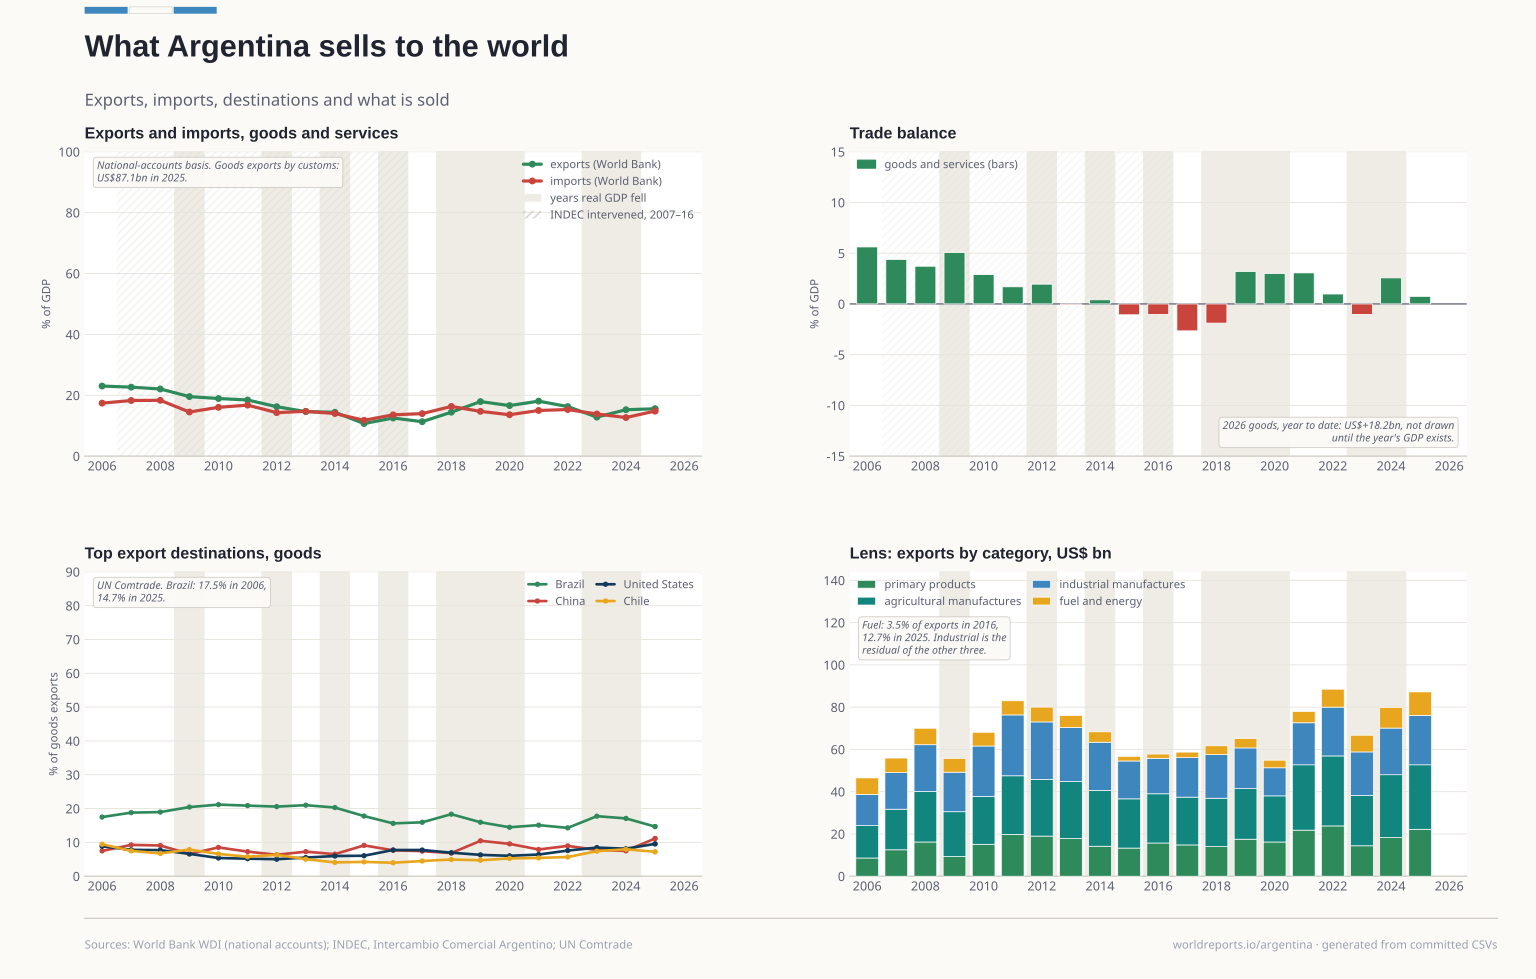
trade/destinations.csv | Goods exports by destination, % of total, and the total | UN Comtrade (reported by INDEC) | 2006-2025 | Official |
|---|
trade/exports_rubros.csv | Exports by category, US$ billion | INDEC — Intercambio Comercial Argentino | 2006-2026 | Official |
|---|
trade/trade.csv | Exports, imports and the trade balance, US$ billion | INDEC — Intercambio Comercial Argentino | 2006-2026 | Official |
|---|
trade/trade_gns.csv | World Development Indicators (NE.EXP.GNFS.ZS, NE.IMP.GNFS.ZS) | World Bank | 2006-2025 | Other |
|---|
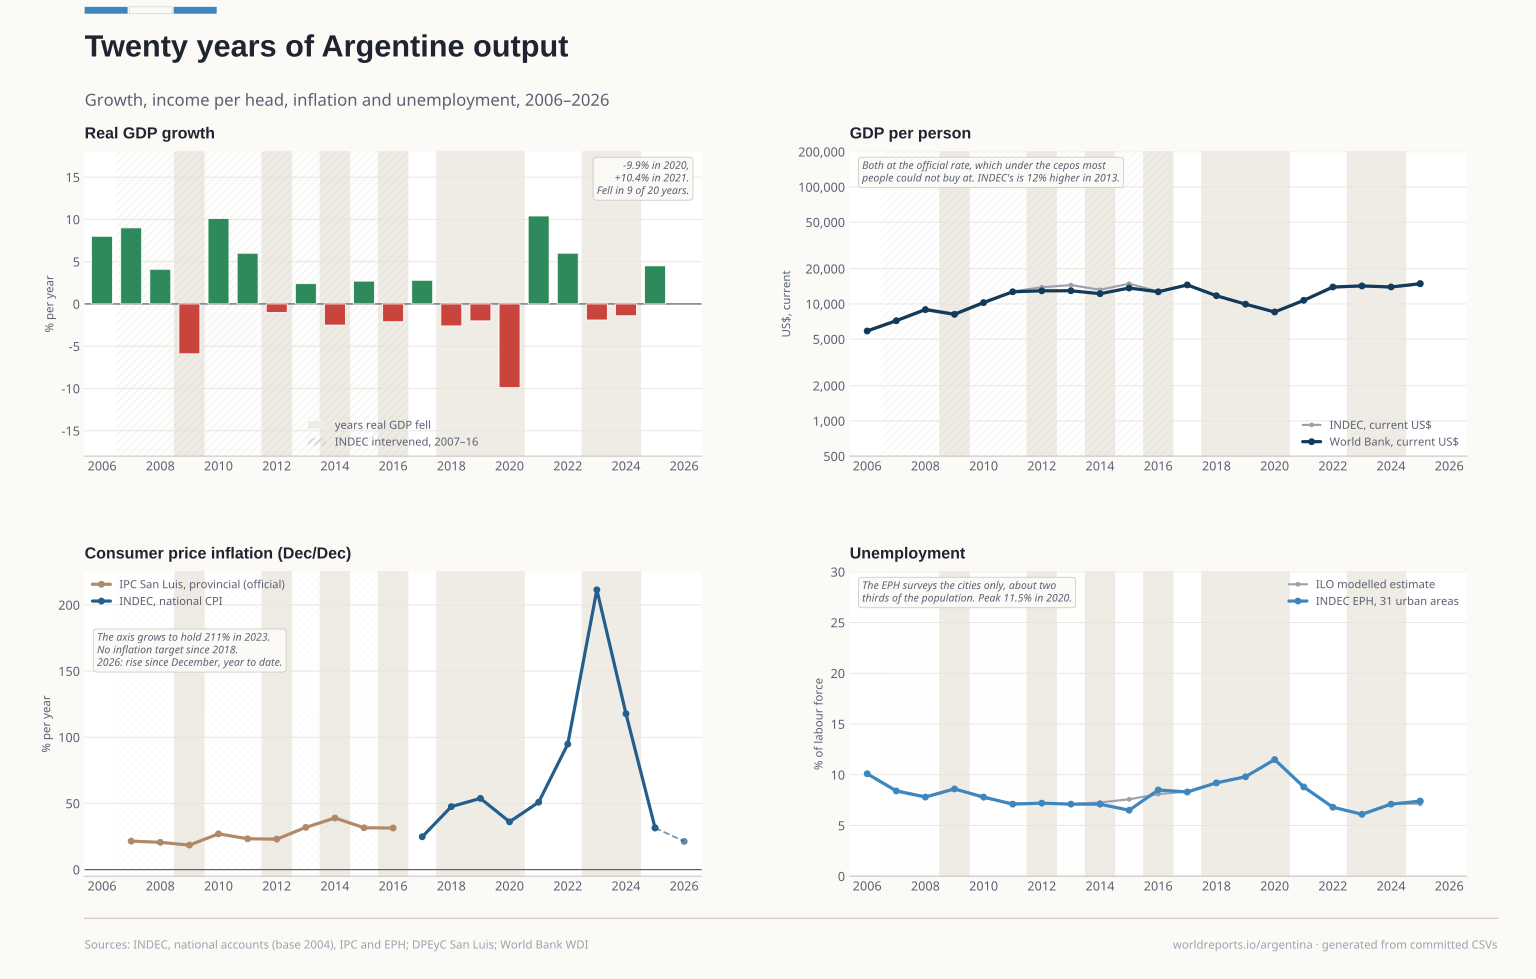 Plate 01