credit/credit_holding_ocm.csv | NOT AN OFFICIAL STATISTIC. This is an industry survey, and it is the only series in this repository that is not from a public institution. It is here… | Observatoire des crédits aux ménages (Fédération bancaire française and ASF) — annual survey | 2006-2025 | Other |
|---|
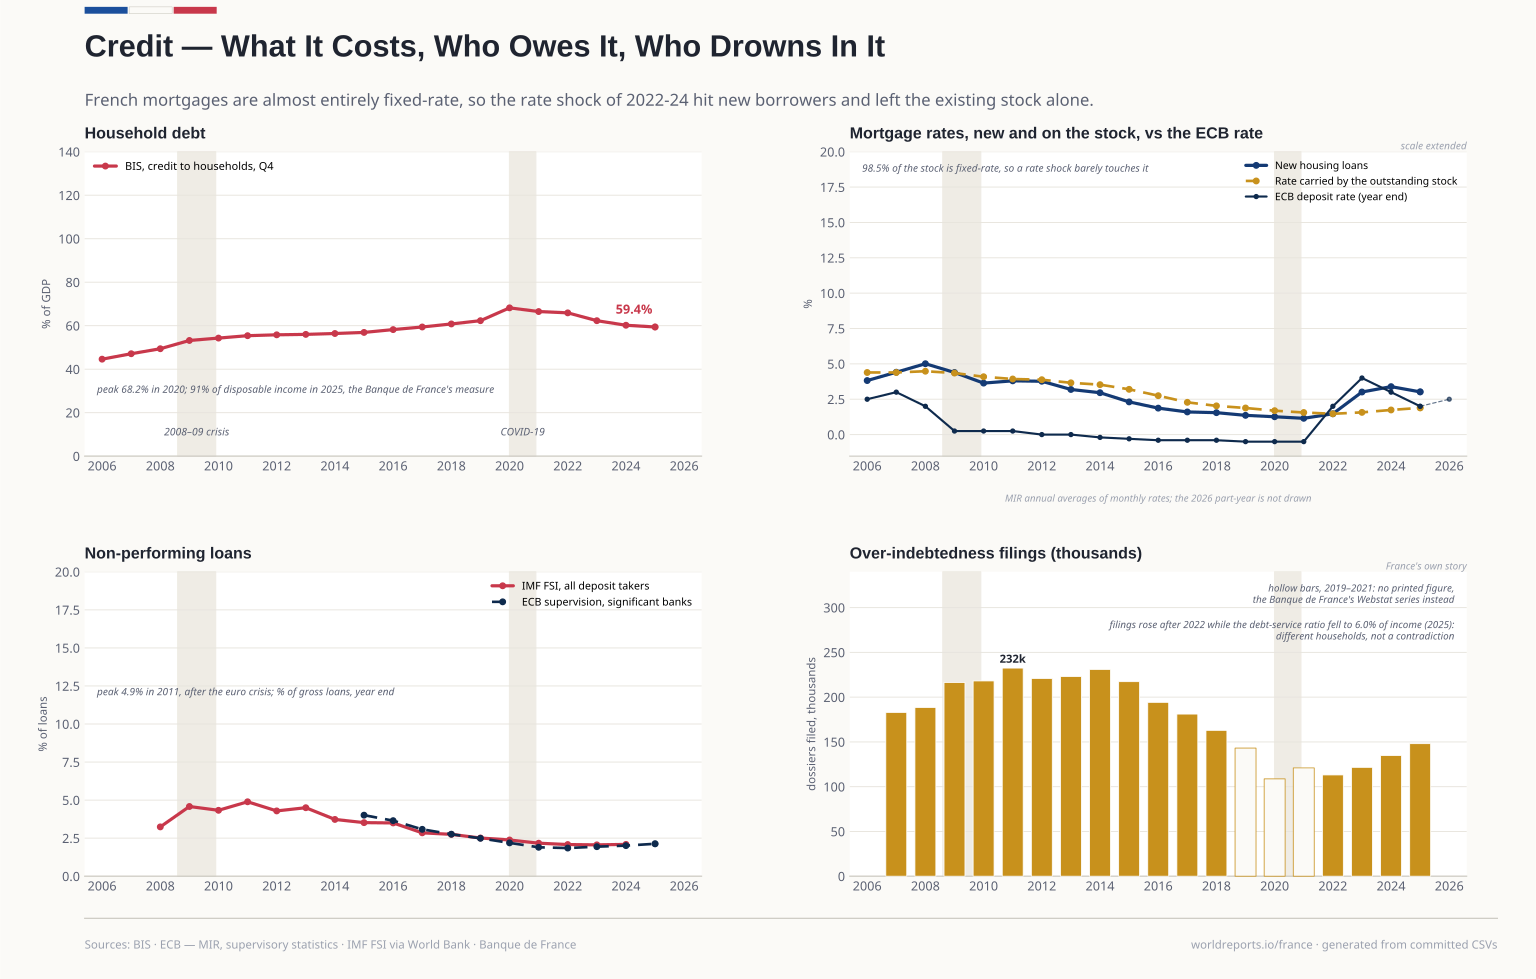
credit/credit_outstanding.csv | December stocks, converted from the published millions to billions. Unadjusted and adjusted stocks are separate columns: "adjusted" means adjusted… | European Central Bank Data Portal — dataflow BSI (balance sheet items), MFIs excluding the central bank, reported by the Banque de France | 2006-2026 | Official |
|---|
credit/household_debt.csv | FOUR measures of the same idea in separate columns, none of them spliceable onto another: they differ in consolidation, instrument scope, denominator… | European Central Bank — Quarterly Sector Accounts (compiled by the Banque de France); Eurostat nasa_10_f_bs; Bank for International Settlements — credit to the non-financial sector (WS_TC) and debt service ratios (WS_DSR) | 2006-2026 | Official |
|---|
credit/lending_rates.csv | Annual averages of the monthly series, computed here: the ECB publishes the monthly observations only. The December value is also carried, so a… | European Central Bank Data Portal — dataflow MIR (MFI interest rate statistics), French data collected and reported by the Banque de France | 2006-2026 | Official |
|---|
credit/npl.csv | Non-performing loans as % of gross loans at the year end, two definitions in two columns, never spliced. npl_fsi_pct: IMF FSI, all deposit takers… | ECB Supervisory Banking Statistics (SUP); IMF Financial Soundness Indicators via the World Bank (FB.AST.NPER.ZS) | 2008-2025 | Other |
|---|
credit/overindebtedness.csv | Dossiers déposés with a commission départementale de surendettement — the statutory entry point to personal insolvency, and the clearest indicator… | Banque de France — surendettement des ménages: baromètre du surendettement (2011 edition, five-year table) and the annual enquêtes typologiques; Webstat series IFI.M.FR.SUREN.DEPOT for the machine-readable part | 2006-2026 | Official |
|---|
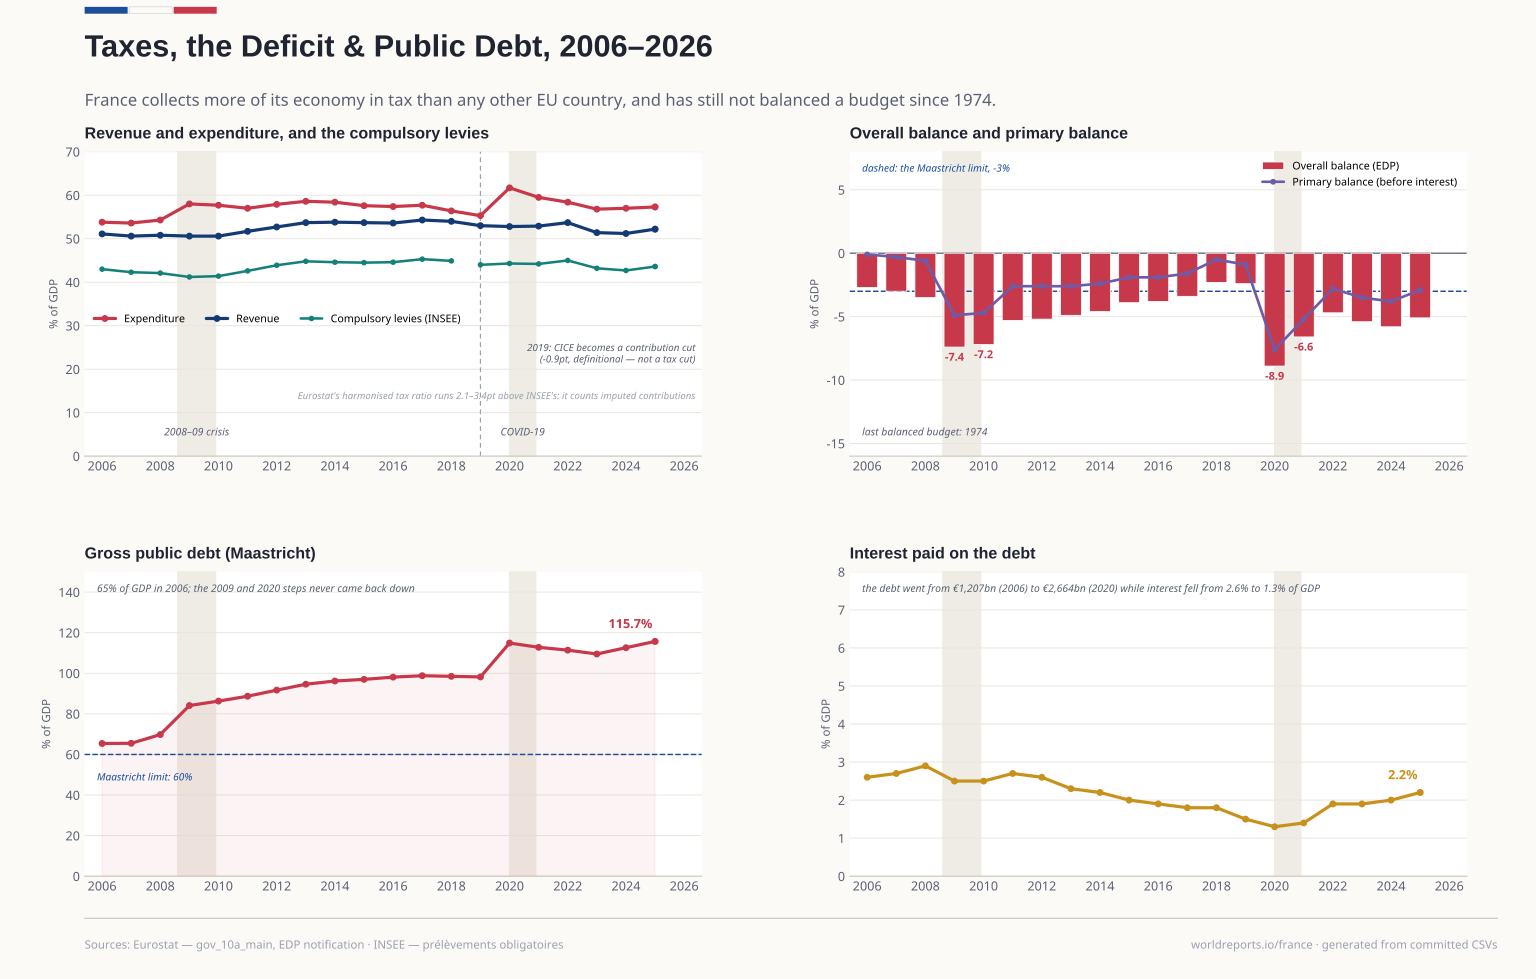
fiscal/debt.csv | General government consolidated gross debt at nominal value, the Maastricht definition, % of GDP, end of year. This is the figure the Commission and… | Eurostat — EDP / Maastricht notification (gov_10dd_edpt1, GD) | 2006-2026 | Official |
|---|
fiscal/deficit.csv | deficit = general government net lending/borrowing, B9, % of GDP. interest = D41 paid, % of GDP. primary = deficit + interest, i.e. the balance… | Eurostat — EDP / Maastricht notification (gov_10dd_edpt1) and gov_10a_main | 2006-2026 | Official |
|---|
fiscal/general_government_from_imf.csv | General government, % of GDP, calendar years. Balance and gross debt are WEO indicators; revenue, expenditure and the primary balance are not WEO… | IMF — World Economic Outlook and Fiscal Monitor, via DataMapper (GGXCNL_NGDP (WEO), GGXONLB_G01_GDP_PT (Fiscal Monitor), GGXWDG_NGDP (WEO)) | 2005-2025 | Other |
|---|
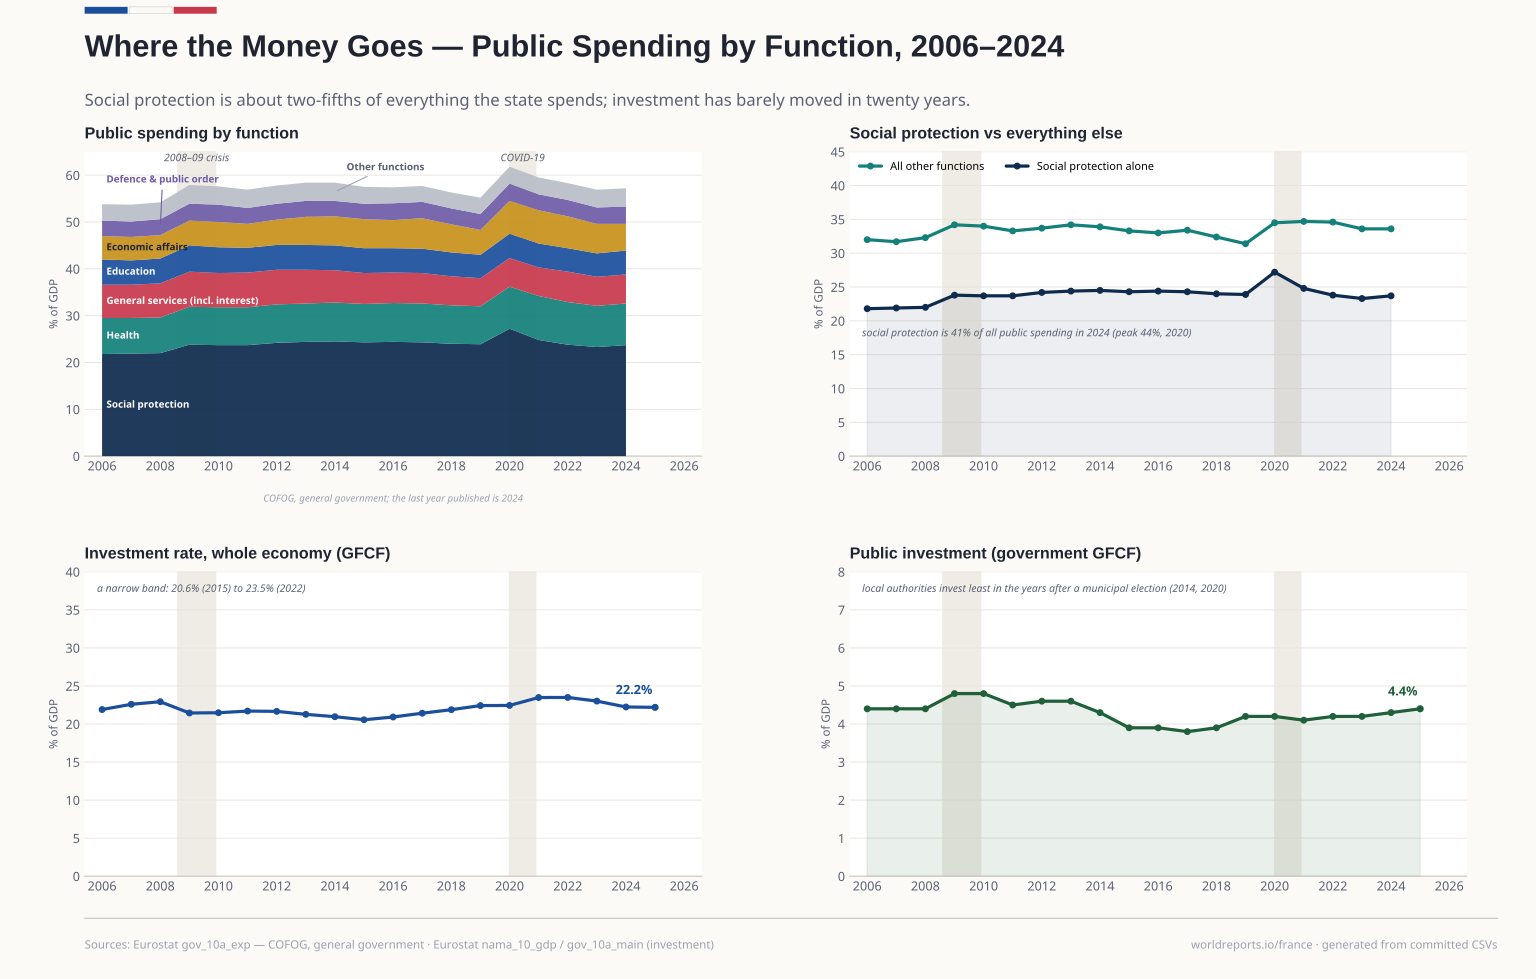
fiscal/investment.csv | Two different concepts, kept in separate columns: gfcf_pct_gdp is gross fixed capital formation for the whole economy, gov_gfcf_pct_gdp is general… | Eurostat nama_10_gdp (P51G, whole economy) and gov_10a_main (P51G, S13) | 2006-2026 | Official |
|---|
fiscal/revenue.csv | Kept for comparison with the COFOG breakdown and the tax ratio; the gap between revenue and expenditure is the deficit in deficit.csv. | Eurostat gov_10a_main — total general government revenue and expenditure (% of GDP) | 2006-2026 | Official |
|---|
fiscal/spending_by_function.csv | COFOG divisions as published, except two deliberate merges named in the column headers: defence_order = GF02 defence + GF03 public order and safety… | Eurostat gov_10a_exp — COFOG, general government total expenditure (% of GDP) | 2006-2026 | Official |
|---|
fiscal/tax_burden.csv | NO base-vintage break needs annotating, which is the opposite of the usual expectation: INSEE retropolates the entire national accounts at every base… | INSEE — taux de prélèvements obligatoires, comptes nationaux base 2020; Eurostat gov_10a_taxag | 2006-2026 | Official |
|---|
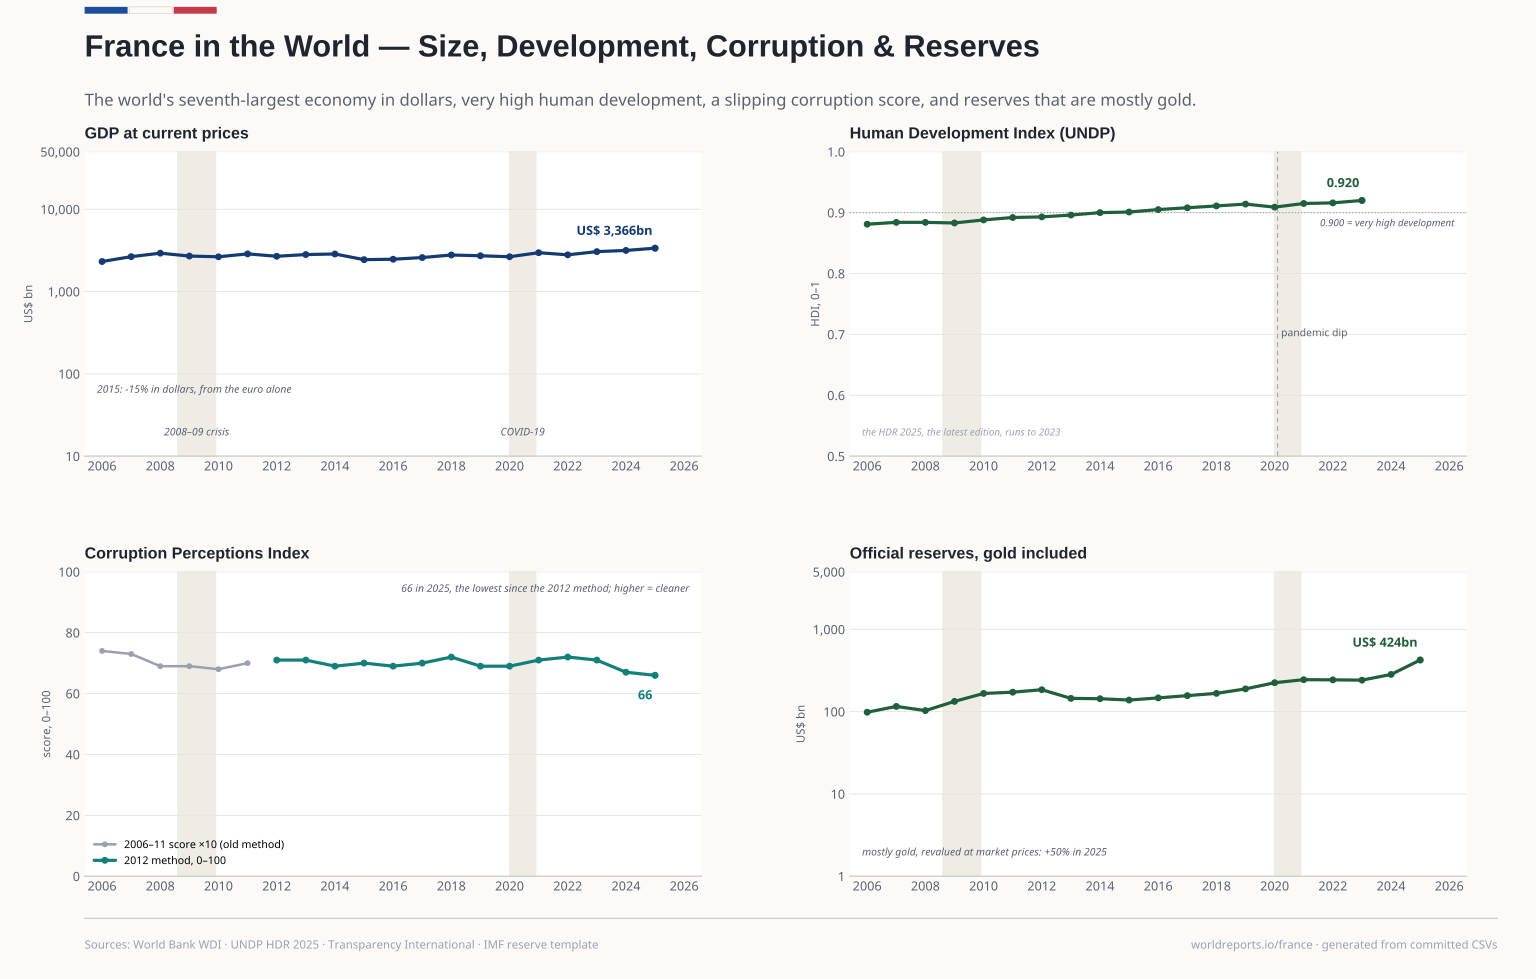
international/cpi.csv | Scores are as published on each year's own scale: 0-10 through 2011, 0-100 from 2012, and TI states that only 2012 onwards are comparable. The chart… | Transparency International — Corruption Perceptions Index, France | 2006-2025 | Official |
|---|
international/wef.csv | Scores pre- and post-2018 are NOT comparable: the classic GCI ran on a 1-7 scale through the 2017-18 edition, then GCI 4.0 switched to 0-100 with… | World Economic Forum — Global Competitiveness Report, editions 2006-07 to 2019 | 2006-2019 | Official |
|---|
international/world_from_wb.csv | Current US$: GDP, GDP per person, and total reserves including gold (year-end, IMF IFS via the WDI). A harmonised cross-country series for the world… | World Bank — World Development Indicators (NY.GDP.MKTP.CD, NY.GDP.PCAP.CD, FI.RES.TOTL.CD) | 2005-2025 | Other |
|---|
international/world_wb.csv | Adopted from world_from_wb.csv. GDP and reserves in current US$ billion, GDP per person in US$: the harmonised series every country on the spine… | World Bank WDI — NY.GDP.MKTP.CD, NY.GDP.PCAP.CD, FI.RES.TOTL.CD | 2006-2025 | Other |
|---|
macro/economy_from_wb.csv | gfcf_pct_gdp is whole-economy gross fixed capital formation, % of GDP (spending slot 3). unemployment_pct is the ILO modelled estimate, % of the… | World Bank — World Development Indicators (NE.GDI.FTOT.ZS, SL.UEM.TOTL.ZS) | 2005-2025 | Other |
|---|
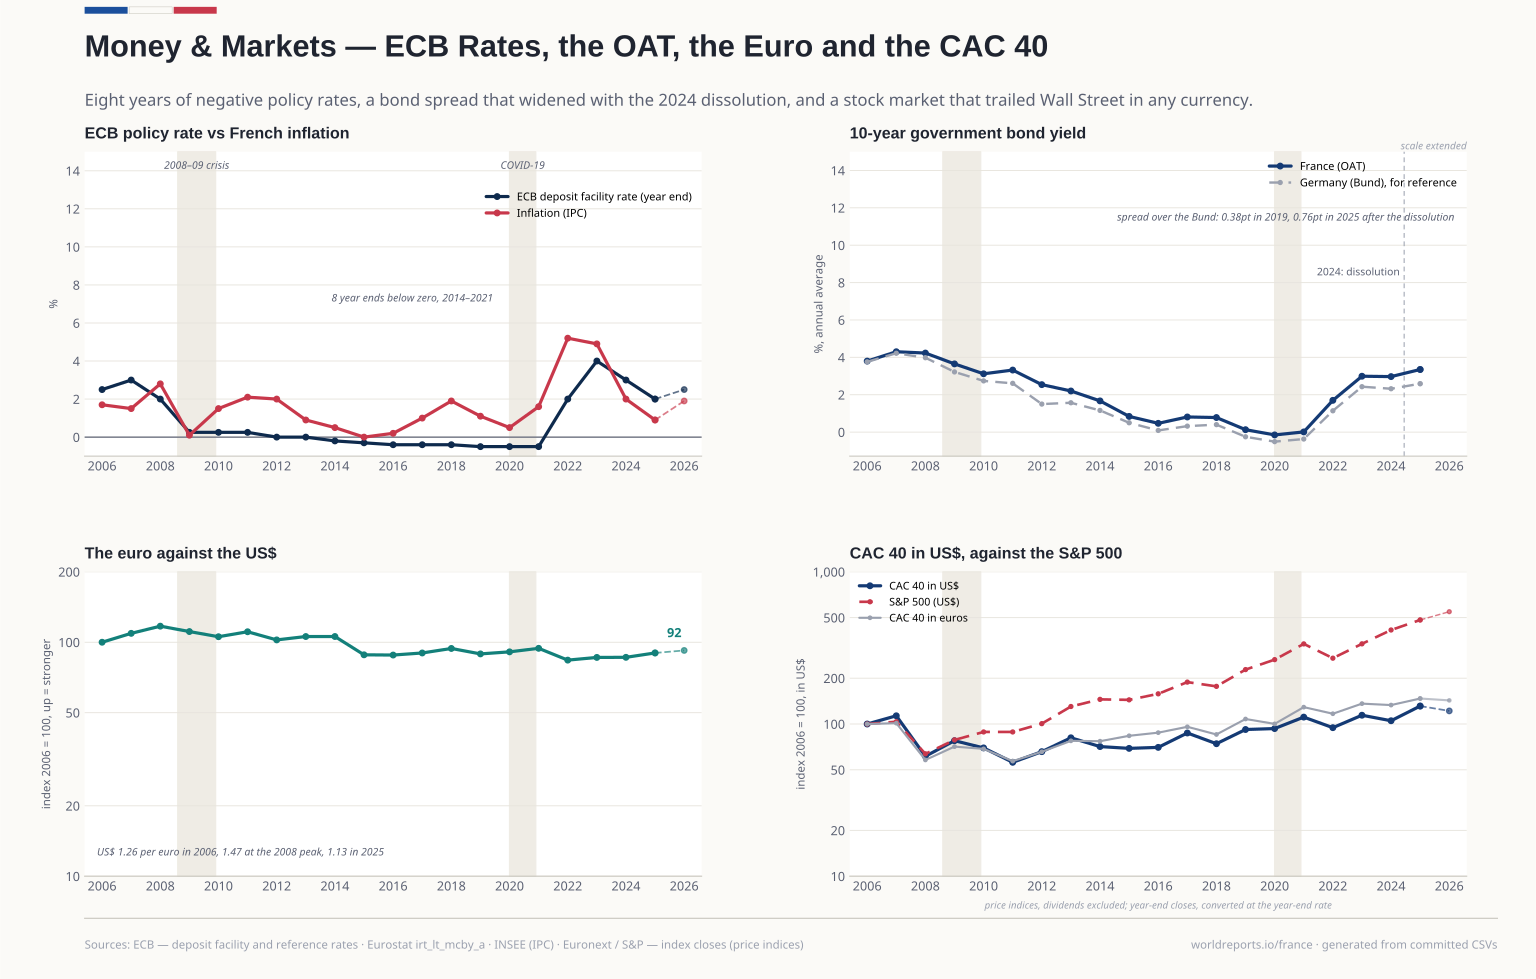
macro/eurusd.csv | US dollars per euro. avg = simple mean of every daily reference rate in the year; eop = the last published rate of the year (2026 = the latest, 21… | ECB — euro foreign exchange reference rates (EXR, D.USD.EUR.SP00.A) | 2006-2026 | Official |
|---|
macro/gdp.csv | nominal_eurbn: GDP at current prices, B1GQ, converted from Eurostat's millions to billions of euro. real_growth: chain-linked volume change on the… | INSEE / Eurostat — comptes nationaux annuels, ESA 2010 (nama_10_gdp) | 2006-2026 | Official |
|---|
macro/inflation.csv | ipc = INSEE's national index, annual average year-on-year change, which is the number used in French indexation (the SMIC, pensions). hicp =… | INSEE — Indice des prix à la consommation (IPC); Eurostat — HICP (prc_hicp_aind) | 2006-2026 | Official |
|---|
macro/policy_rate.csv | dfr = deposit facility rate, mro = main refinancing operations fixed rate, both the level in force on the last day of the year. The plate draws the… | ECB — key interest rates (FM, D.U2.EUR.4F.KR.DFR.LEV and MRR_FR.LEV) | 2006-2026 | Official |
|---|
macro/reserves.csv | Year-end, US$ billion, gold INCLUDED at market value and revalued monthly. This is the single most important caveat on the plate: France has held… | IMF IRFCL — official reserve assets, France (line I.A, approximate market value) | 2006-2026 | Official |
|---|
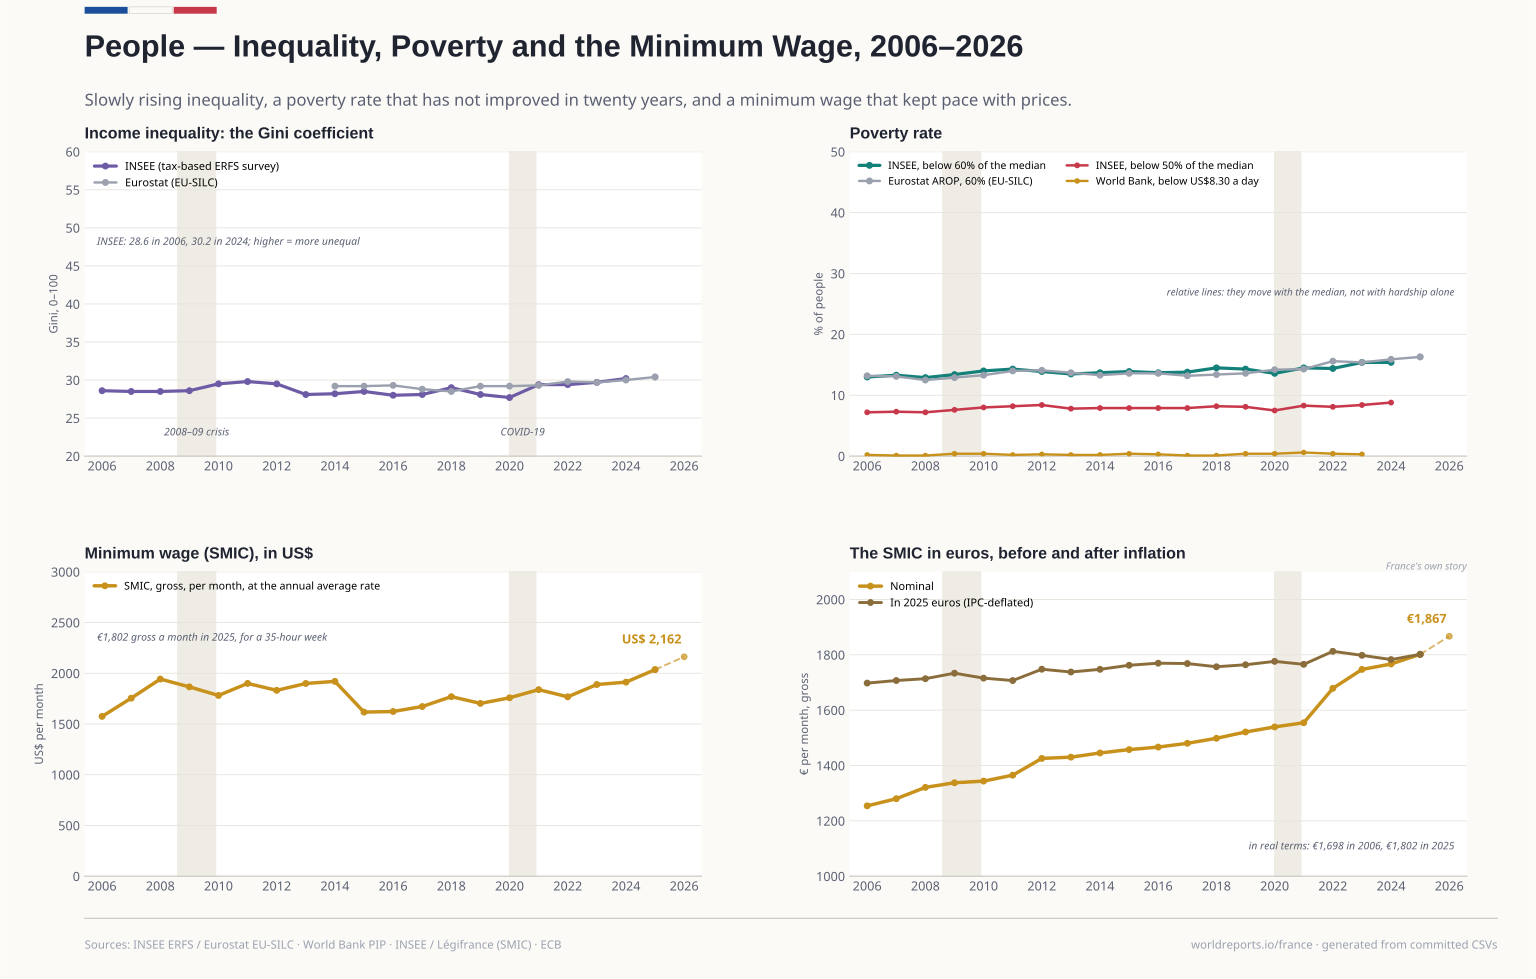
macro/smic.csv | Gross monthly amount for a 35-hour week (151.6667 h) and the hourly rate, for the rate in force for the MOST DAYS of each calendar year. That rule… | INSEE / Légifrance — SMIC, montant brut en vigueur (décrets et arrêtés de relèvement) | 2006-2026 | Official |
|---|
macro/unemployment.csv | ILO-definition unemployment. Watch the geography: INSEE publishes "France hors Mayotte" and "France (y compris Mayotte)", and Mayotte entered the… | INSEE — taux de chômage au sens du BIT, annual average; Eurostat une_rt_a as cross-check | 2006-2026 | Official |
|---|
markets/bond_yields.csv | Ten-year benchmark government bond yields, % a year, annual average of monthly secondary-market yields, as the national central banks report them for… | Eurostat — irt_lt_mcby_a, EMU convergence-criterion long-term interest rates | 2006-2025 | Official |
|---|
markets/cac40.csv | Last trading-day close of each year; 2026 is the latest close, not a year-end. A PRICE index: it excludes dividends, which flatters the S&P 500 in… | Euronext Paris — CAC 40 (^FCHI) year-end closes | 2005-2026 | Official |
|---|
markets/sp500.csv | price index, excludes dividends; 2026 = latest close | S&P 500 (^GSPC) year-end closes | 2005-2026 | Official |
|---|
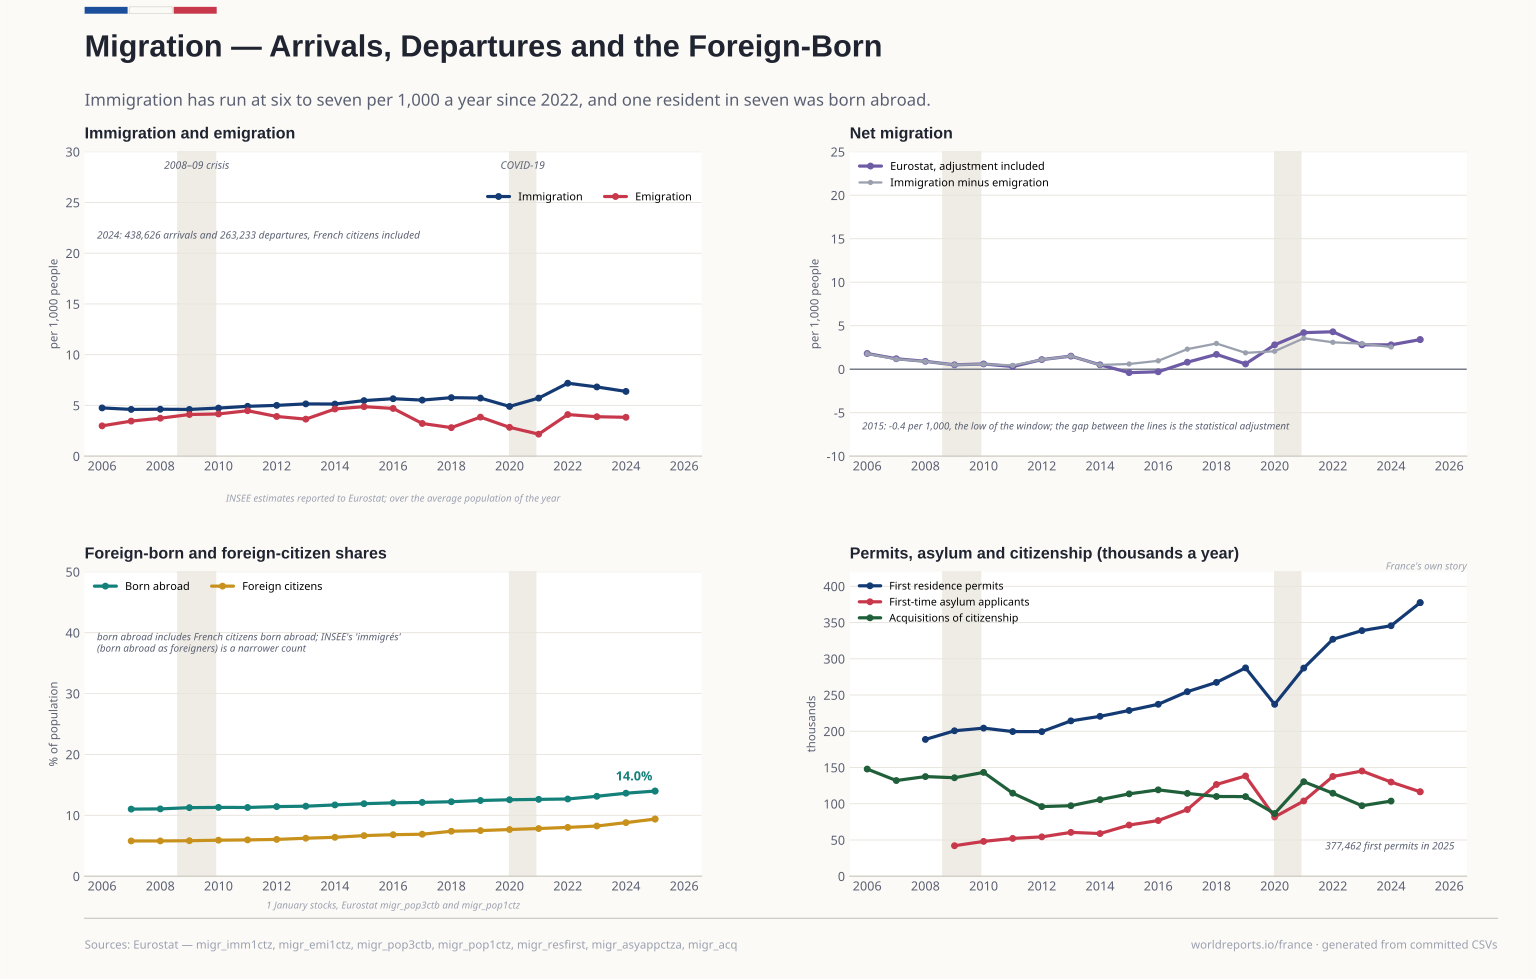
migration/migration.csv | Reported by INSEE (flows and stocks) and the Ministère de l'Intérieur (asylum, permits, citizenship) under Regulation 862/2007. immigration and… | Eurostat migration statistics for France — migr_imm1ctz, migr_emi1ctz, migr_pop3ctb, migr_pop1ctz, migr_asyappctza, migr_resfirst, migr_acq | 2006-2025 | Official |
|---|
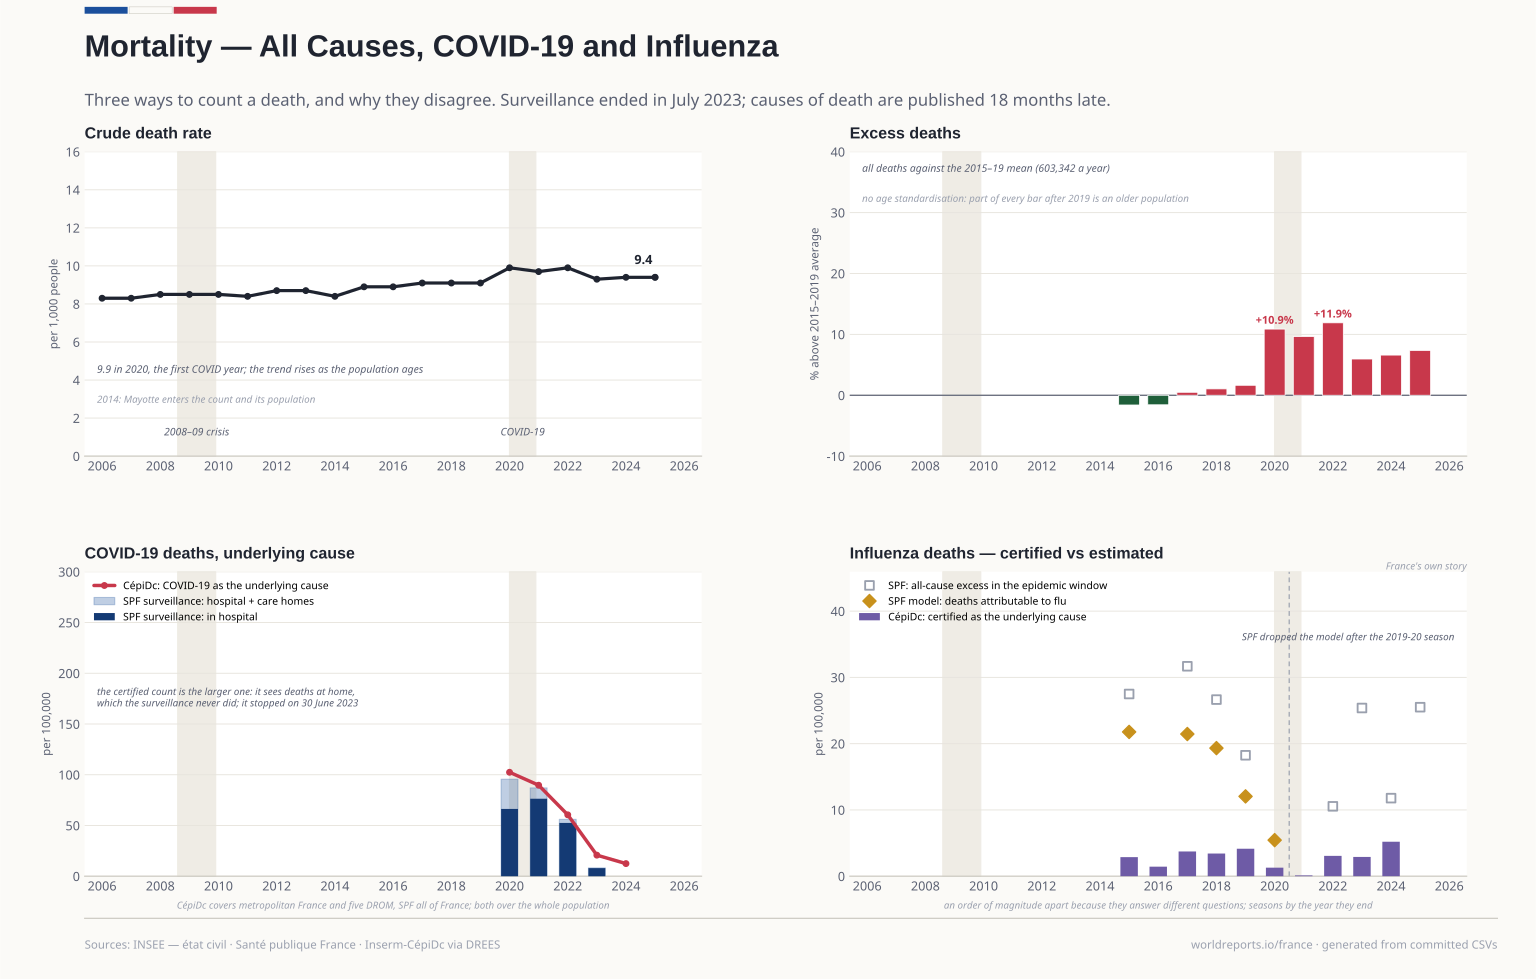
social/all_cause_deaths.csv | Two counting systems in separate columns, and the file repeats the warning in its own header. insee counts deaths registered in the état civil… | INSEE — Décès et taux de mortalité (état civil), table 2383440; Insee Focus n°389 "Les décès en 2025" for 2025. cepidc column: Inserm-CépiDc "Toutes causes", via DREES open data "Causes de décès" | 2006-2025 | Official |
|---|
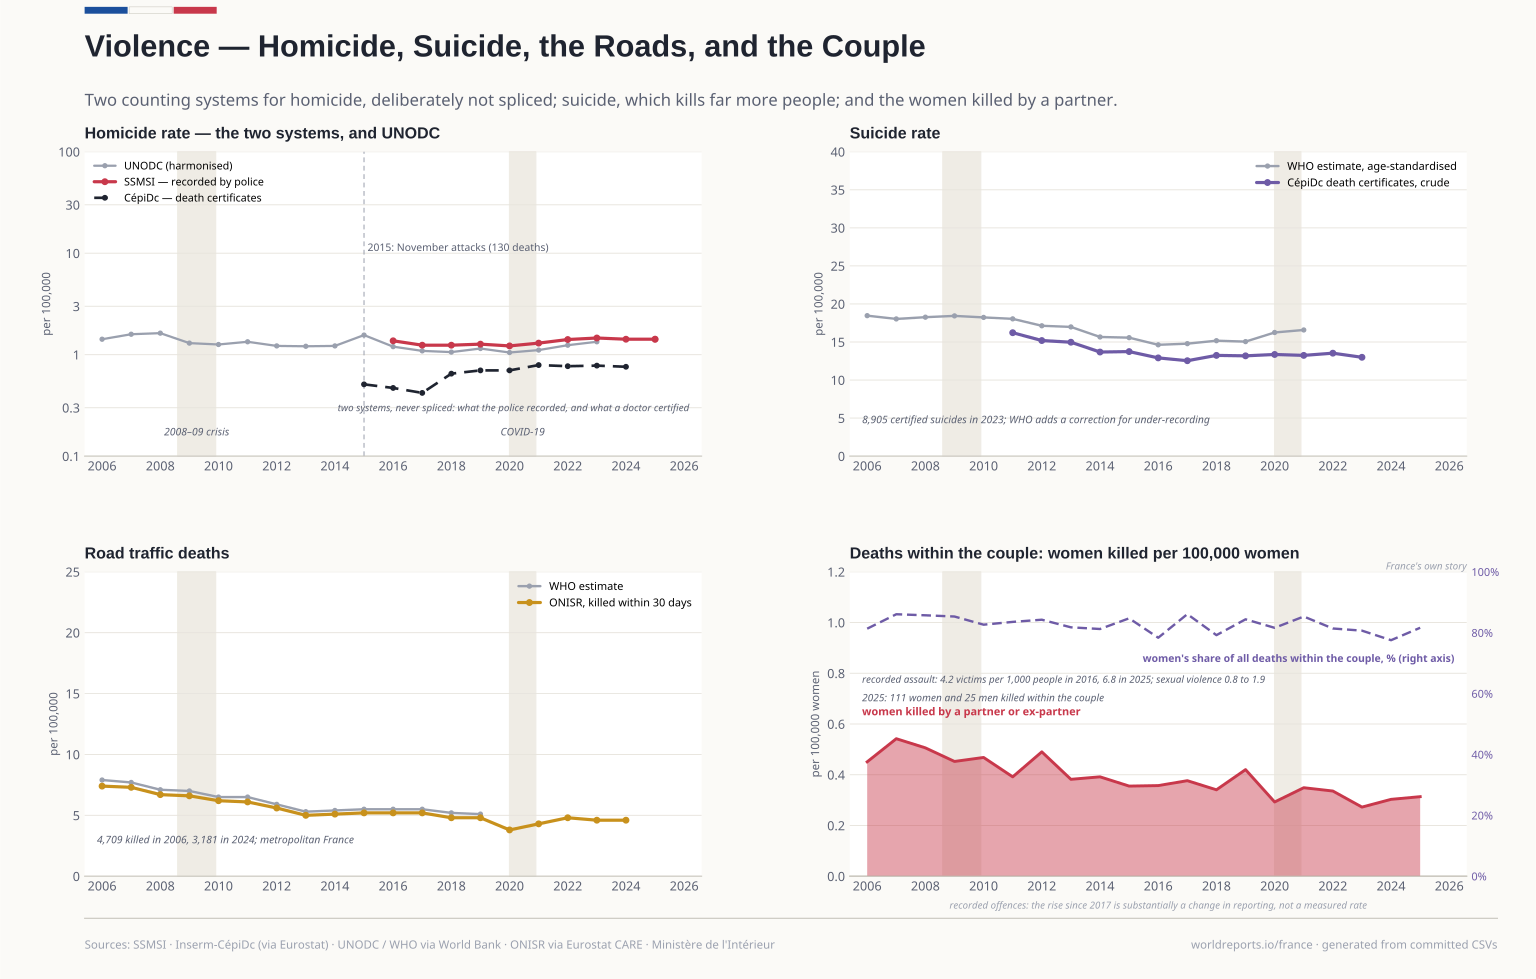
social/causes.csv | suicide (X60-X84, Y87.0) and transport accidents (V01-Y85): crude death rates per 100,000 residents and the counts behind them, 2011 onwards (the… | Inserm-CépiDc causes of death via Eurostat (hlth_cd_acdr2, hlth_cd_aro); ONISR road deaths via Eurostat CARE (tran_sf_roadus) | 2006-2024 | Official |
|---|
social/covid_deaths.csv | THREE different quantities, never to be added or averaged. France never used a 28-day or 30-day rule, unlike the UK: deaths_hospital is SI-VIC's… | Santé publique France — SI-VIC and SurvESMS surveillance, via data.gouv.fr (synthèse des indicateurs, file table-indicateurs-open-data-france-2023-06-30-17h59.csv); Inserm-CépiDc — U07.1 + U07.2 as cause initiale, via DREES open data "Causes de décès" (ensemble_tableaux_2024.csv) | 2020-2026 | Official |
|---|
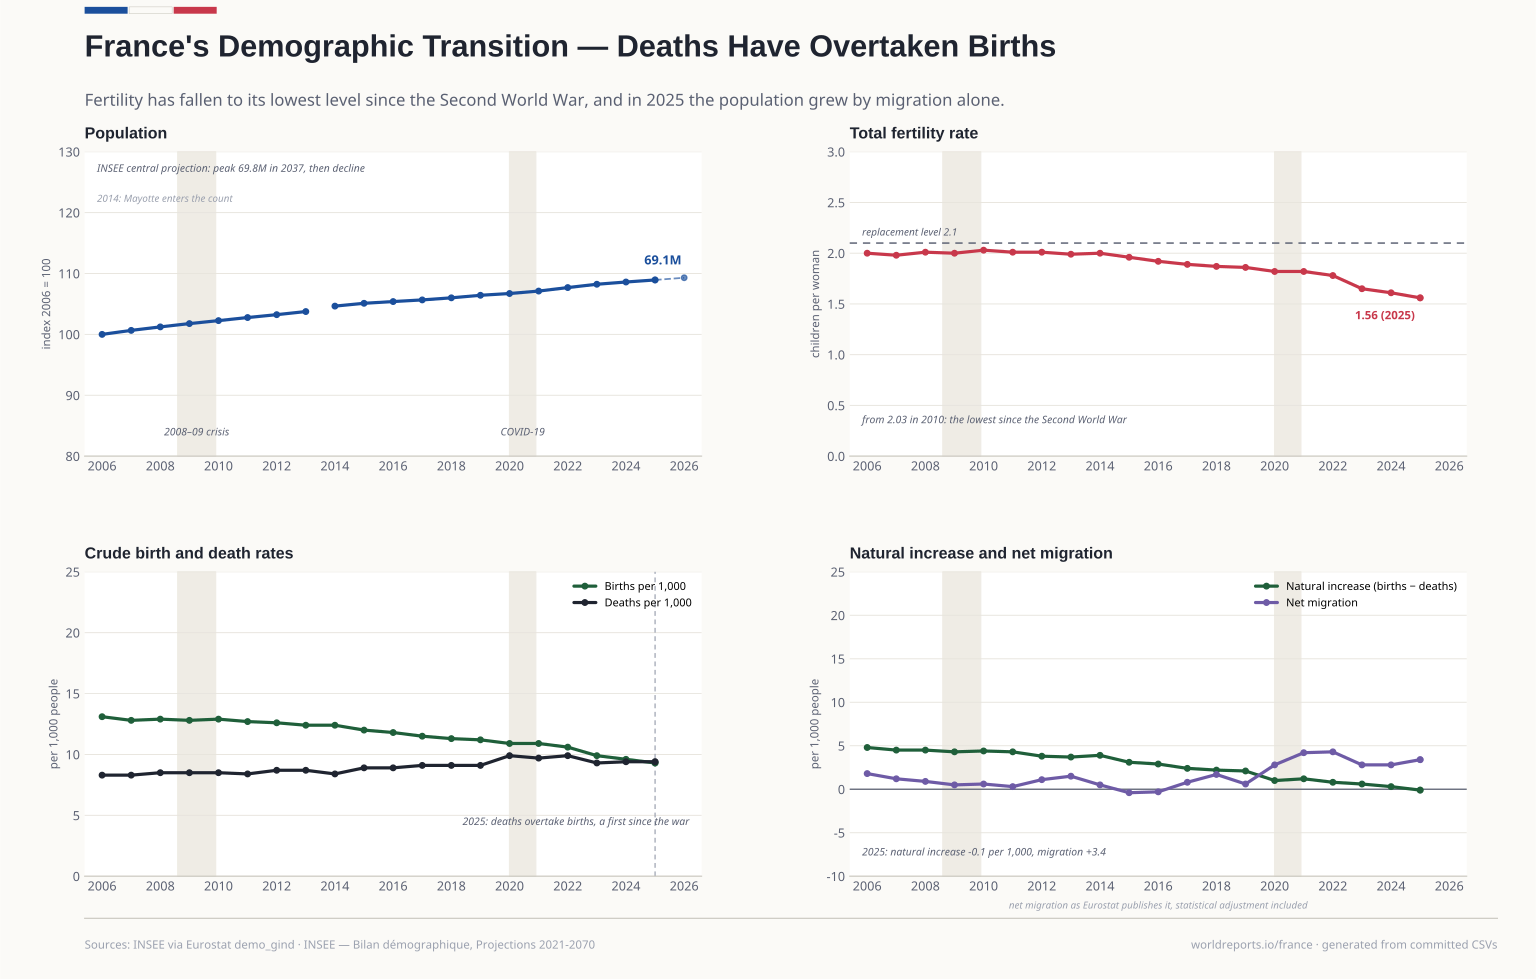
social/demography_from_wb.csv | Mid-year population (total and female), so a rate per 100,000 women can be computed on a mid-year denominator. Crude birth and death rates are per… | World Bank — World Development Indicators (SP.POP.TOTL, SP.POP.TOTL.FE.IN, SP.DYN.TFRT.IN, SP.DYN.CBRT.IN, SP.DYN.CDRT.IN, SM.POP.NETM), from the UN World Population Prospects and national vital statistics | 2005-2025 | Other |
|---|
social/flu_deaths.csv | Three columns that differ by roughly an order of magnitude because they answer three different questions, and the plate draws them as three separate… | Inserm-CépiDc — influenza (J09-J11) as cause initiale, via DREES open data "Causes de décès"; Santé publique France — BEH seasonal influenza bilans (2015 n°32-33, 2016 n°32-33, 2017 n°22, 2018 n°34, 2019 n°28, 2022 n°21, 2025 n°17) and the IRA bulletins | 2010-2026 | Official |
|---|
social/gini.csv | Two measurements of inequality that are not interchangeable: INSEE's is built on the ERFS (tax and social records), Eurostat's on EU-SILC with its… | INSEE — indice de Gini du niveau de vie (ERFS); Eurostat EU-SILC (ilc_di12) as the second column | 2006-2026 | Official |
|---|
social/hdi.csv | One vintage for every year, deliberately: the HDI is recomputed for the whole back-series at each methodology change, so a trend assembled from… | UNDP — Human Development Report 2025, complete time series (single vintage) | 2006-2026 | Official |
|---|
social/homicides.csv | Two incompatible systems, never spliced. SSMSI counts homicides RECORDED by the police and gendarmerie, by the force that recorded them; CépiDc… | SSMSI — Insécurité et délinquance, bilan statistique (recorded offences); Inserm/CépiDc — causes de décès | 2006-2026 | Official |
|---|
social/population.csv | pop_mn is the 1 January count. Years through 2025 are observed état civil figures; everything after is the central projection, drawn dashed. Deaths… | INSEE — Bilan démographique (observed) and Projections de population, scénario central | 2000-2070 | Official |
|---|
social/population_wb.csv | Adopted from demography_from_wb.csv. Mid-year population, total and female; the female count is the denominator of women killed by a partner per… | World Bank WDI — SP.POP.TOTL and SP.POP.TOTL.FE.IN (UN WPP / INSEE) | 2006-2025 | Other |
|---|
social/poverty.csv | Share of people below 60% (and 50%) of median living standards. This is a RELATIVE measure: it can fall in a recession because the median falls with… | INSEE — taux de pauvreté monétaire (ERFS), 60% and 50% of median; Eurostat ilc_li02 as cross-check | 2006-2026 | Official |
|---|
social/poverty_from_wb.csv | poverty_830_pct: share of people below US$8.30 a day, 2021 PPP. Survey years only; the gaps are years without a survey, not zeros. The cross-country… | World Bank — Poverty and Inequality Platform, SI.POV.UMIC | 2005-2023 | Other |
|---|
social/poverty_wb.csv | Adopted from poverty_from_wb.csv. Share of people below US$8.30 a day at 2021 PPP, drawn beside the national relative lines. Columns: poverty_830_pct. | World Bank Poverty and Inequality Platform — SI.POV.UMIC | 2006-2023 | Other |
|---|
social/security_from_wb.csv | All per 100,000 people. Intentional homicide is UNODC's harmonised count, which usually differs from the national police or death- certificate series… | World Bank — World Development Indicators: VC.IHR.PSRC.P5 (UNODC), SH.STA.SUIC.P5 and SH.STA.TRAF.P5 (WHO Global Health Estimates) | 2005-2023 | Other |
|---|
social/security_wb.csv | Adopted from security_from_wb.csv. Per 100,000: UNODC intentional homicide, WHO suicide (age-standardised) and WHO road-traffic deaths (estimates, to… | World Bank WDI — VC.IHR.PSRC.P5 (UNODC), SH.STA.SUIC.P5 and SH.STA.TRAF.P5 (WHO) | 2006-2023 | Other |
|---|
social/violence.csv | women_killed_by_partner is women killed by a partner or ex-partner; couple_deaths_total is ALL deaths within the couple in the same study, both… | Ministère de l'Intérieur / délégation aux victimes — étude nationale sur les morts violentes au sein du couple (annual); SSMSI — Interstats for the recorded-offence columns | 2006-2026 | Official |
|---|
social/violence_pre2016_etat4001.csv | Kept for comparison only, never plotted on the same line as violence.csv, and the file repeats this warning in its own header comments. Three… | SSMSI / Ministère de l'Intérieur — état 4001, frozen departmental monthly series (dataset 5617ad4dc751df6211cdbb49, resource fdf5afbf-ed3c-4c54-a4f0-3581c8a1eca4, tableaux-4001-ts.xlsx) | 2006-2015 | Official |
|---|
social/vital_rates.csv | France including the overseas departments, Mayotte from 2014. pop_avg is the average population of the year (AVG), the denominator of every rate the… | INSEE population estimates and vital statistics via Eurostat — demo_gind | 2006-2026 | Official |
|---|
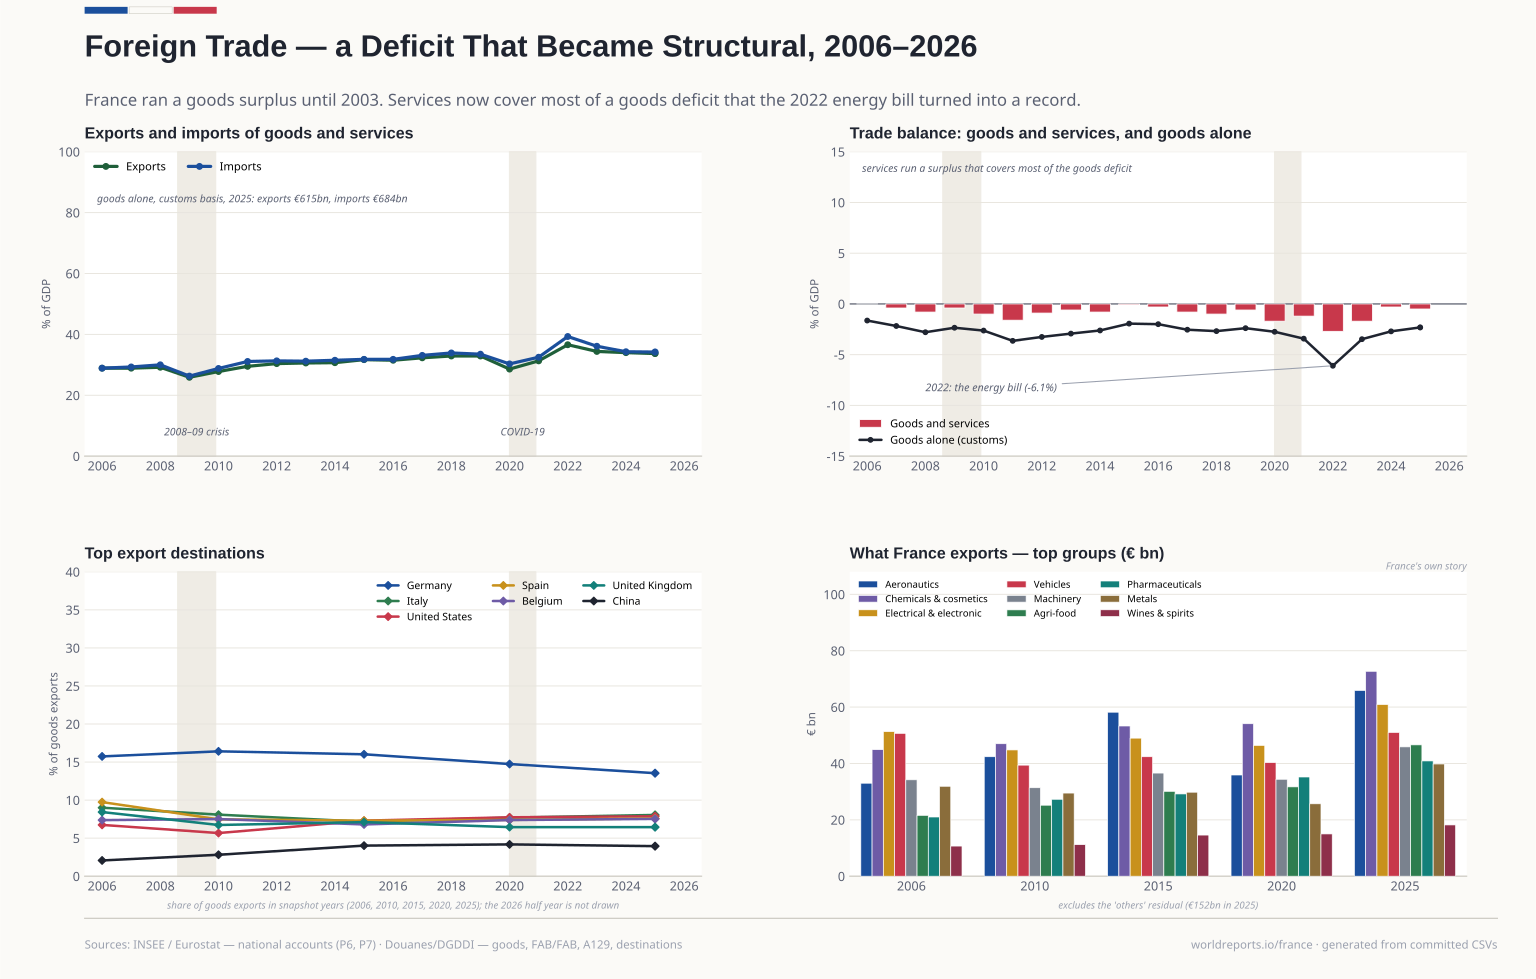
trade/destinations.csv | Belgium EXCLUDES Luxembourg, and China is mainland only, excluding Hong Kong — Douanes' own published table uses a combined "Chine et H-K" line… | DGDDI open data — share of total French goods exports by country of destination | 2006-2026 | Official |
|---|
trade/exports_products.csv | Snapshot years only (2006, 2010, 2015, 2020, 2025); `others` is the exact residual to that year's open-data export total. A DIFFERENT UNIVERSE from… | DGDDI open data ("bases complètes"), nomenclature A129, aggregated by product group | 2006-2025 | Official |
|---|
trade/imports_products.csv | share_pct is the share of that year's total CAF imports. energy is B06Z (crude oil, natural gas, LNG) plus C19Z (refined petroleum and coke); it… | DGDDI open data, nomenclature A129, imports valued CAF | 2006-2025 | Official |
|---|
trade/trade.csv | Billions of euro, FAB/FAB (both flows free-on-board), raw data including military materiel and the below-threshold estimate. The CAF/FAB basis… | Douanes/DGDDI — Le chiffre du commerce extérieur, FAB/FAB, données brutes | 2006-2026 | Official |
|---|
trade/trade_from_wb.csv | Exports and imports of goods AND services, national-accounts basis, % of GDP — not a customs goods series. The trade balance is their difference and… | World Bank — World Development Indicators (NE.EXP.GNFS.ZS, NE.IMP.GNFS.ZS) | 2005-2025 | Other |
|---|
trade/trade_na.csv | Exports and imports of goods AND services at current prices, % of GDP, and their difference: the spine's trade basis (trade slots 1 and 2). Adopted… | INSEE national accounts via Eurostat — nama_10_gdp, P6 and P7, % of GDP | 2006-2025 | Official |
|---|
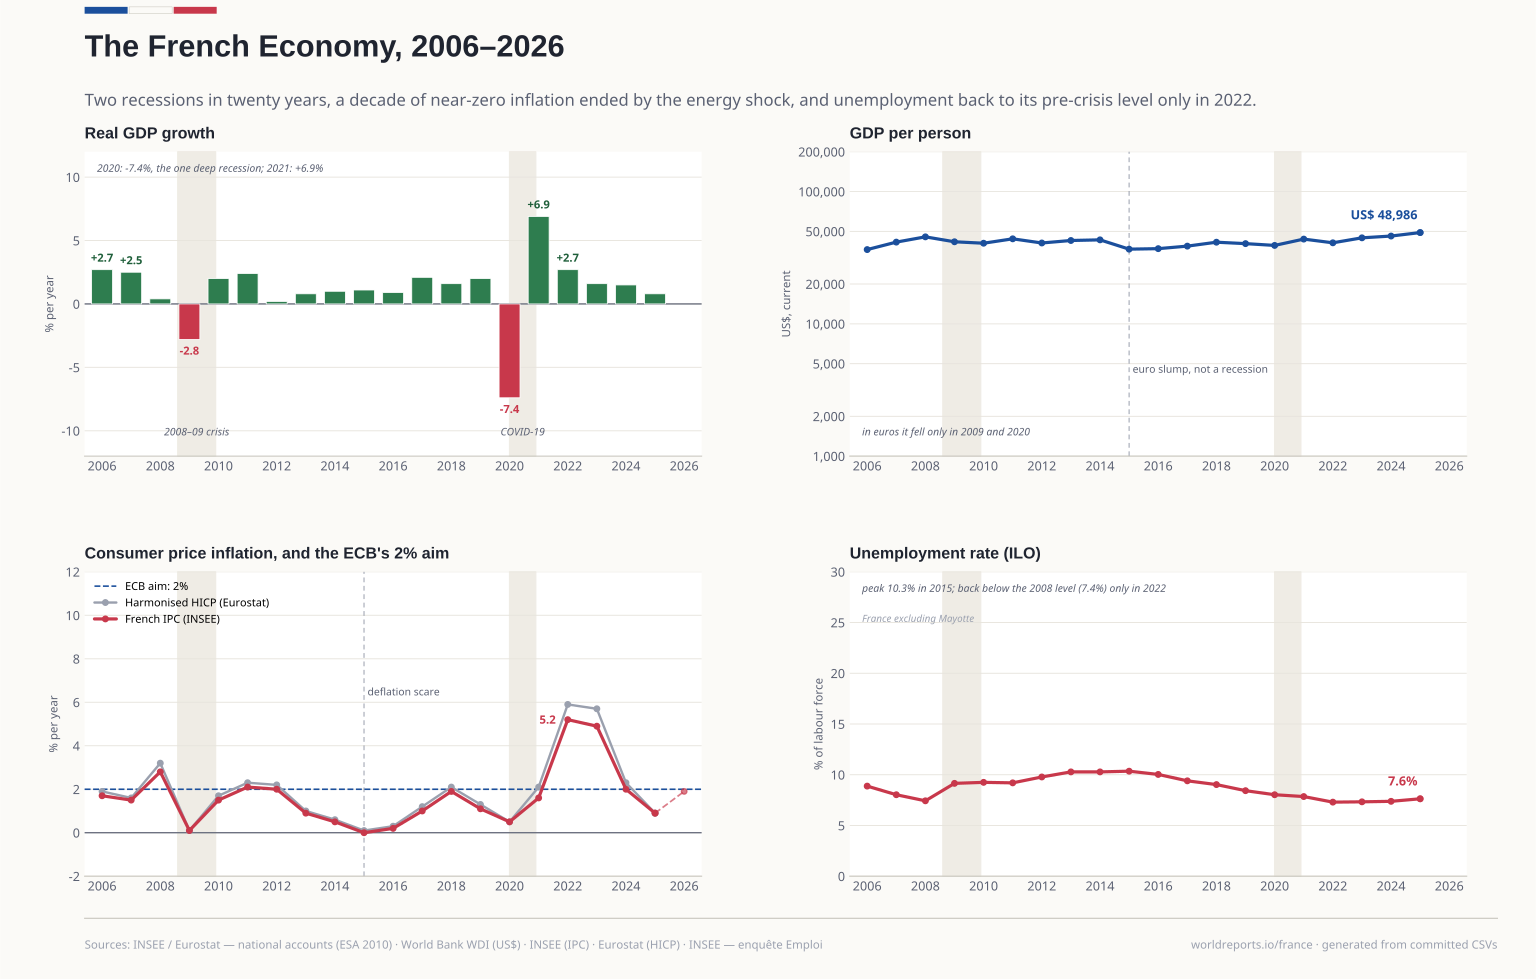 Plate 01