Singapore

12 plates of official data, 2006-2026

Every figure on this page comes from a publisher that names its definition — the Singapore Department of Statistics for the national accounts, prices, population, vital statistics, crime and household finances, and the IMF, World Bank, UNDP and BIS for the harmonised layer — and every plate is regenerated from committed CSVs, so the charts and the numbers here cannot drift apart. Singapore is a city and a state at once, and three of the atlas's usual frames break on it: exports of goods and services run at 178% of GDP because a port re-exports what it imports, gross debt near 166% of GDP is issued against assets rather than as a burden, and there is no policy interest rate at all — MAS manages a trade-weighted exchange-rate band. Each of those is said on the panel that draws it. Gaps are gaps: a slot with no official number says which route was tried and why the number is not there.

Where things stand

The plates

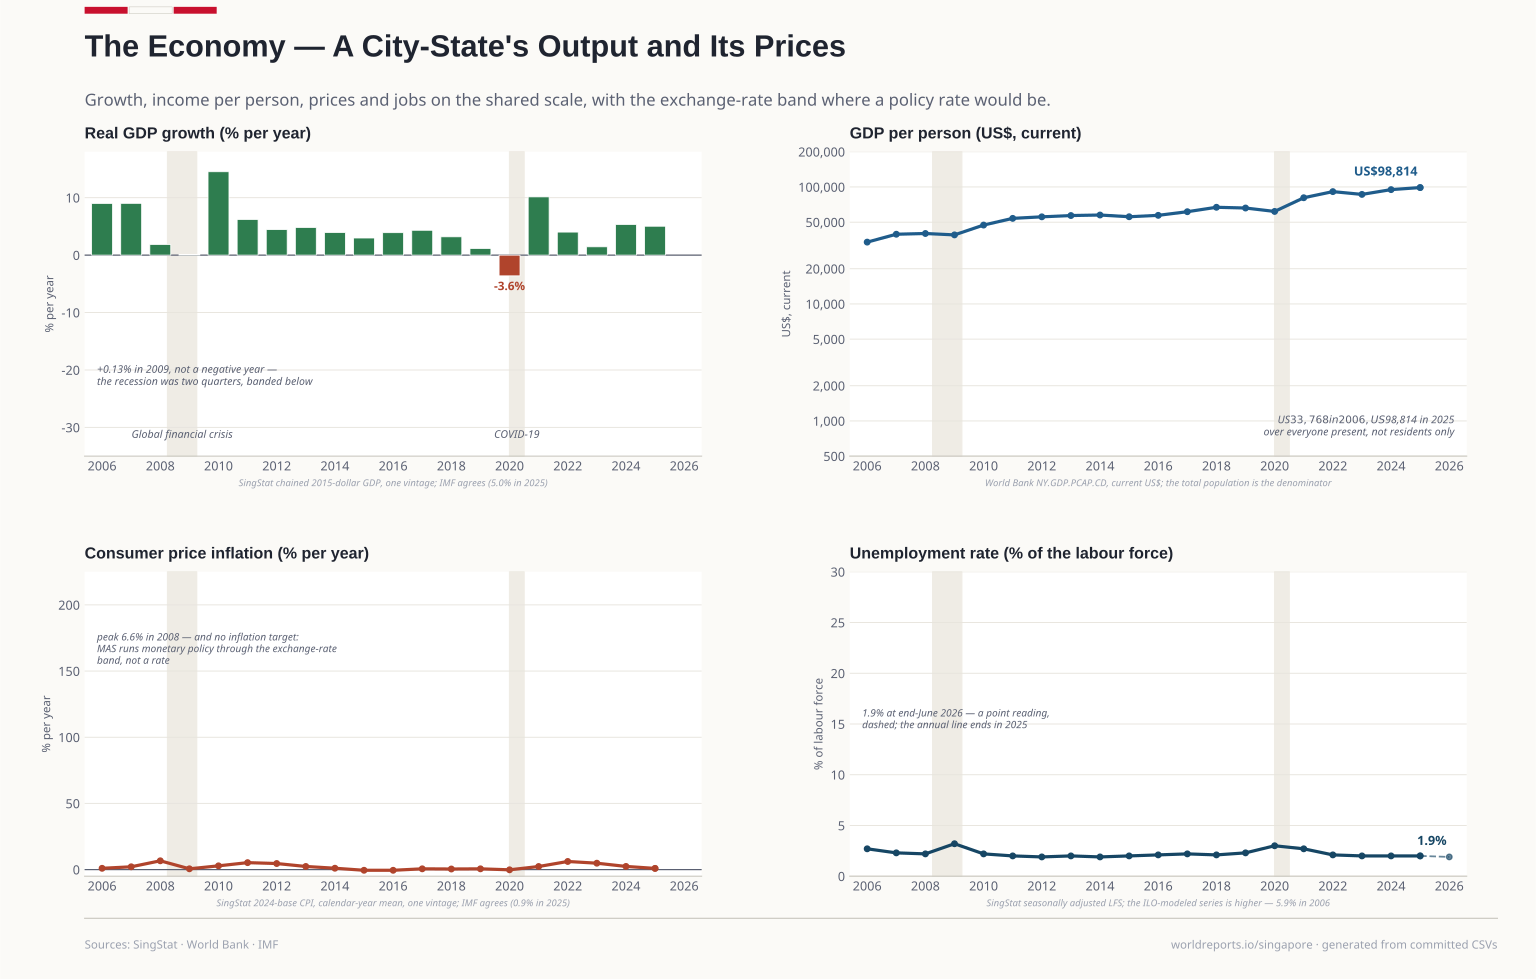
  1. The Economy. A small, open, managed economy: growth broke only in 2020, prices have not run above 7% in twenty years, and the central bank works through the exchange rate. GDP per person, US$ 98,814 in 2025; Real growth +5.0% in 2025; CPI inflation 0.9% in 2025. Every figure is read from this country's committed CSVs. Plate 01

    The Economy

    A small, open, managed economy: growth broke only in 2020, prices have not run above 7% in twenty years, and the central bank works through the exchange rate.

    View full size Download vector (SVG)
    Drawn from · 2

    The committed files this plate was read from, as recorded while it was drawn.

    • macro/economy.csvSingapore Department of Statistics (SingStat) Table Builder — M015021 (GDP at current prices), M015951 (GDP in chained 2015 dollars), M015121 (per-capita GDP), M213751 (CPI, 2024 = 100), M182332 (unemployment, end-June, seasonally adjusted); comparators from IMF WEO (NGDP_RPCH) and World Bank (FP.CPI.TOTL.ZG, SL.UEM.TOTL.ZS, NE.GDI.FTOT.ZS) · 2006-2026
    • world/world.csvWorld Bank WDI — NY.GDP.MKTP.CD, NY.GDP.PCAP.CD, FI.RES.TOTL.CD; UNDP HDR 2025 (one vintage) HDI; SingStat M700031 for the SGD reserves stock · 2006-2025
    20062025
    98,814 GDP per person, US$ 2025
    +5.0% Real growth 2025
    0.9% CPI inflation 2025
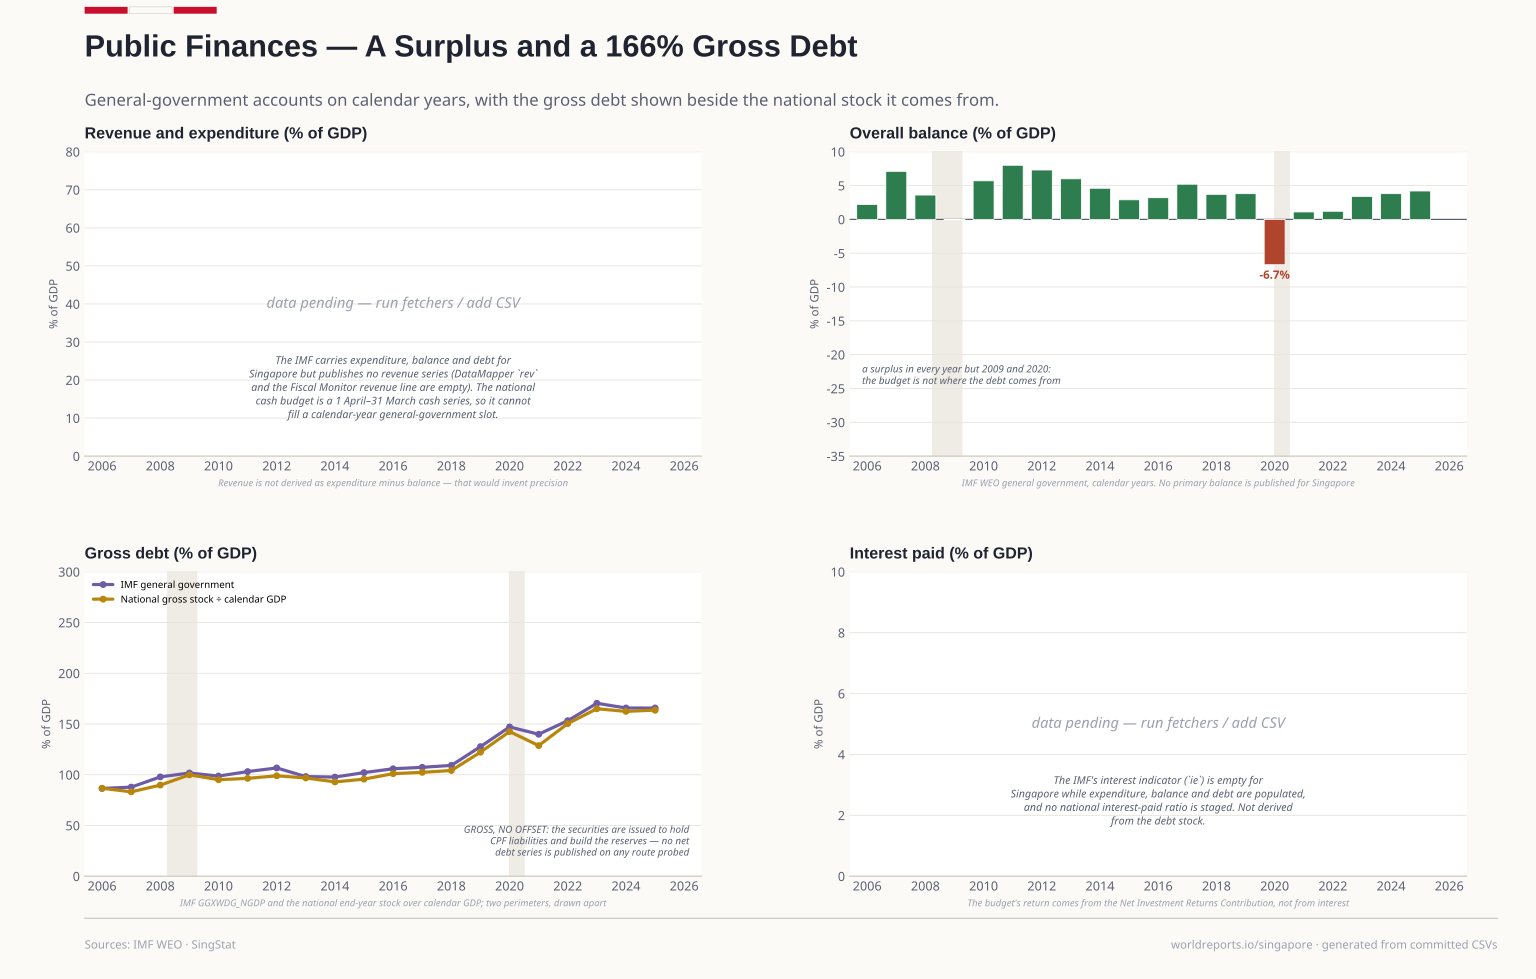
  2. Public Finances. The general government runs a surplus and carries gross debt of 166% of GDP — issued to hold CPF liabilities and build reserves, and published with no asset offset. Overall balance +4.2% GDP in 2025; Gross debt (general govt) 165.7% GDP in 2025; Expenditure (general govt) 15.5% GDP in 2025. Every figure is read from this country's committed CSVs. Plate 02

    Public Finances

    The general government runs a surplus and carries gross debt of 166% of GDP — issued to hold CPF liabilities and build reserves, and published with no asset offset.

    View full size Download vector (SVG)
    Drawn from · 3

    The committed files this plate was read from, as recorded while it was drawn.

    • fiscal/debt_national.csvSingStat Table Builder M130191 — Government Debt By Maturity, as at end of calendar year · 2006-2025
    • fiscal/imf_general_government.csvIMF WEO and Fiscal Monitor via DataMapper — GGXCNL_NGDP (net lending/borrowing), GGXWDG_NGDP (gross debt), G_X_G01_GDP_PT (total expenditure) · 2006-2026
    • macro/economy.csvSingapore Department of Statistics (SingStat) Table Builder — M015021 (GDP at current prices), M015951 (GDP in chained 2015 dollars), M015121 (per-capita GDP), M213751 (CPI, 2024 = 100), M182332 (unemployment, end-June, seasonally adjusted); comparators from IMF WEO (NGDP_RPCH) and World Bank (FP.CPI.TOTL.ZG, SL.UEM.TOTL.ZS, NE.GDI.FTOT.ZS) · 2006-2026
    20062025
    +4.2% GDP Overall balance 2025
    165.7% GDP Gross debt (general govt) latest
    15.5% GDP Expenditure (general govt) 2025
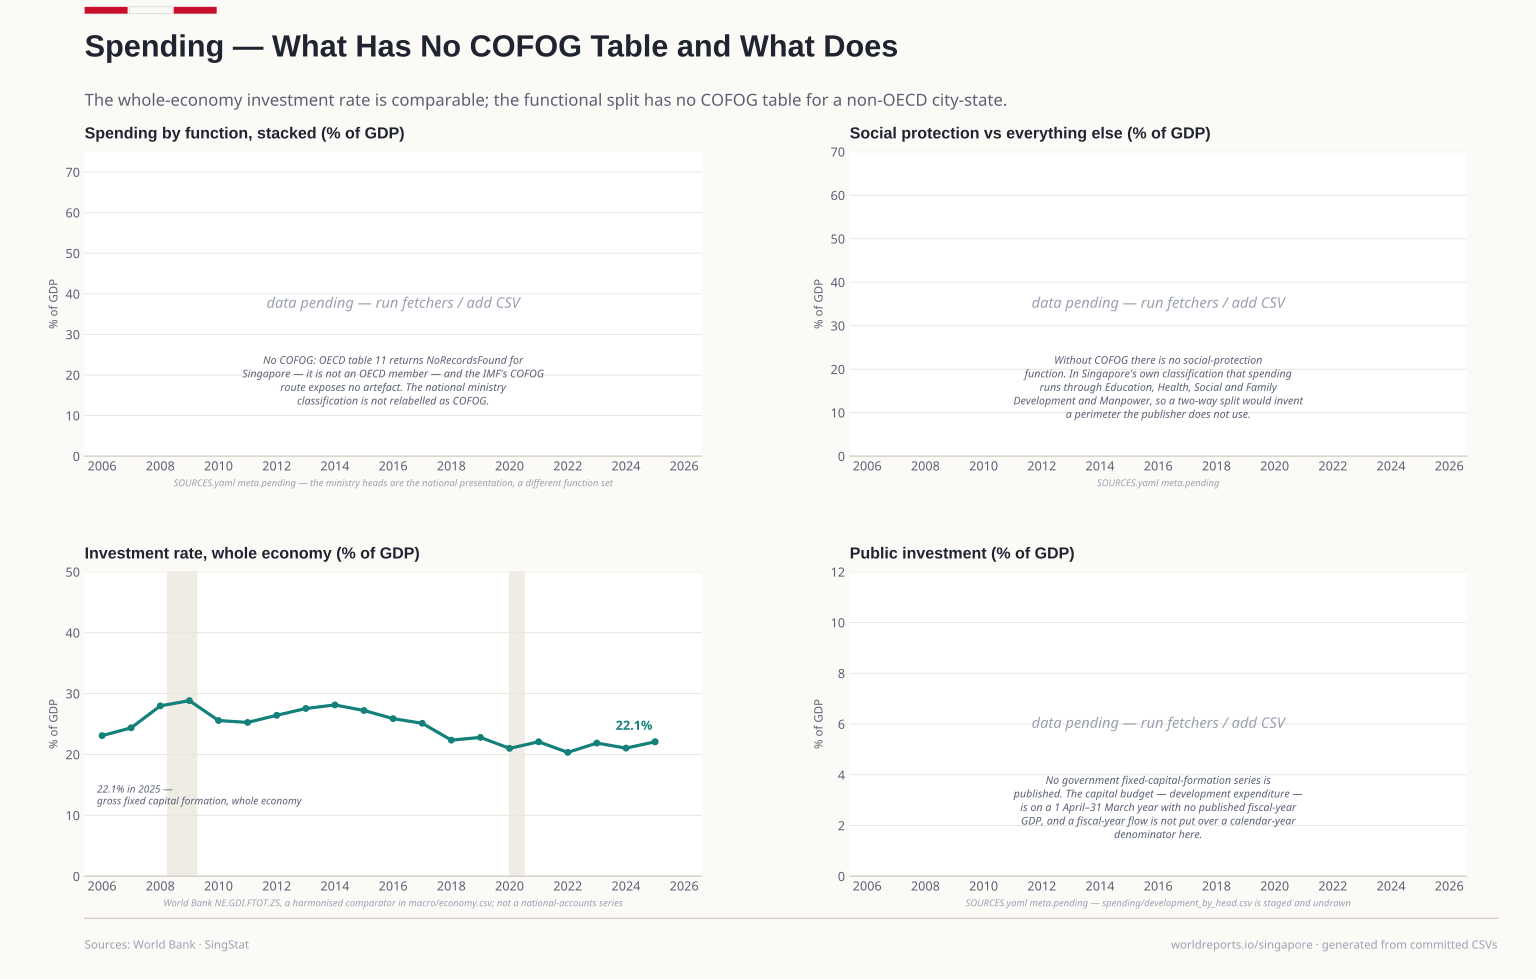
  3. Spending. The whole-economy investment rate is comparable. The functional split is not: Singapore is not an OECD member and table 11 carries no COFOG for it. Investment rate, whole economy 22.1% GDP in 2025. Every figure is read from this country's committed CSVs. Plate 03

    Spending

    The whole-economy investment rate is comparable. The functional split is not: Singapore is not an OECD member and table 11 carries no COFOG for it.

    View full size Download vector (SVG)
    Drawn from · 1

    The committed files this plate was read from, as recorded while it was drawn.

    • macro/economy.csvSingapore Department of Statistics (SingStat) Table Builder — M015021 (GDP at current prices), M015951 (GDP in chained 2015 dollars), M015121 (per-capita GDP), M213751 (CPI, 2024 = 100), M182332 (unemployment, end-June, seasonally adjusted); comparators from IMF WEO (NGDP_RPCH) and World Bank (FP.CPI.TOTL.ZG, SL.UEM.TOTL.ZS, NE.GDI.FTOT.ZS) · 2006-2026
    20062025
    22.1% GDP Investment rate, whole economy 2025
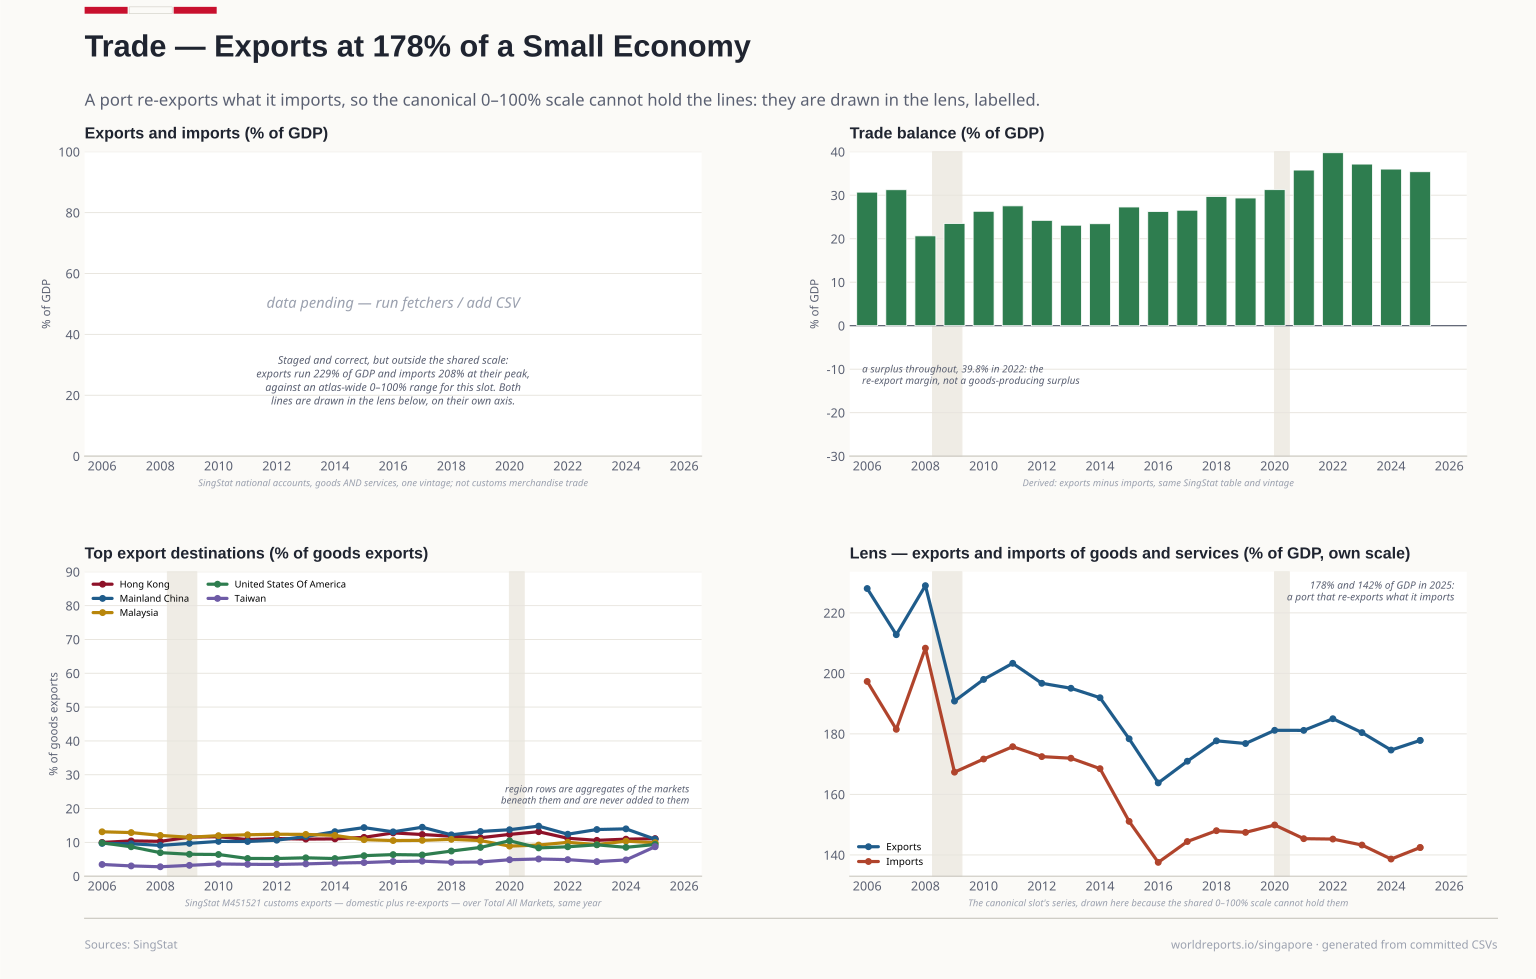
  4. Trade. A port that refines and re-exports: goods and services exports run at 178% of GDP, imports at 142%, and the balance is in surplus every year of the window. Exports, goods and services 177.8% GDP in 2025; Imports, goods and services 142.4% GDP in 2025; Trade balance +35.4% GDP in 2025. Every figure is read from this country's committed CSVs. Plate 04

    Trade

    A port that refines and re-exports: goods and services exports run at 178% of GDP, imports at 142%, and the balance is in surplus every year of the window.

    View full size Download vector (SVG)
    Drawn from · 2

    The committed files this plate was read from, as recorded while it was drawn.

    • trade/partners.csvSingStat Table Builder M451521 — Merchandise Exports By Region And Market · 2006-2025
    • trade/trade.csvSingStat Table Builder M015021 — exports and imports of goods and services at current prices, over GDP at current prices; comparator from World Bank WDI NE.EXP.GNFS.ZS / NE.IMP.GNFS.ZS · 2006-2025
    20062025
    177.8% GDP Exports, goods and services 2025
    142.4% GDP Imports, goods and services 2025
    +35.4% GDP Trade balance 2025
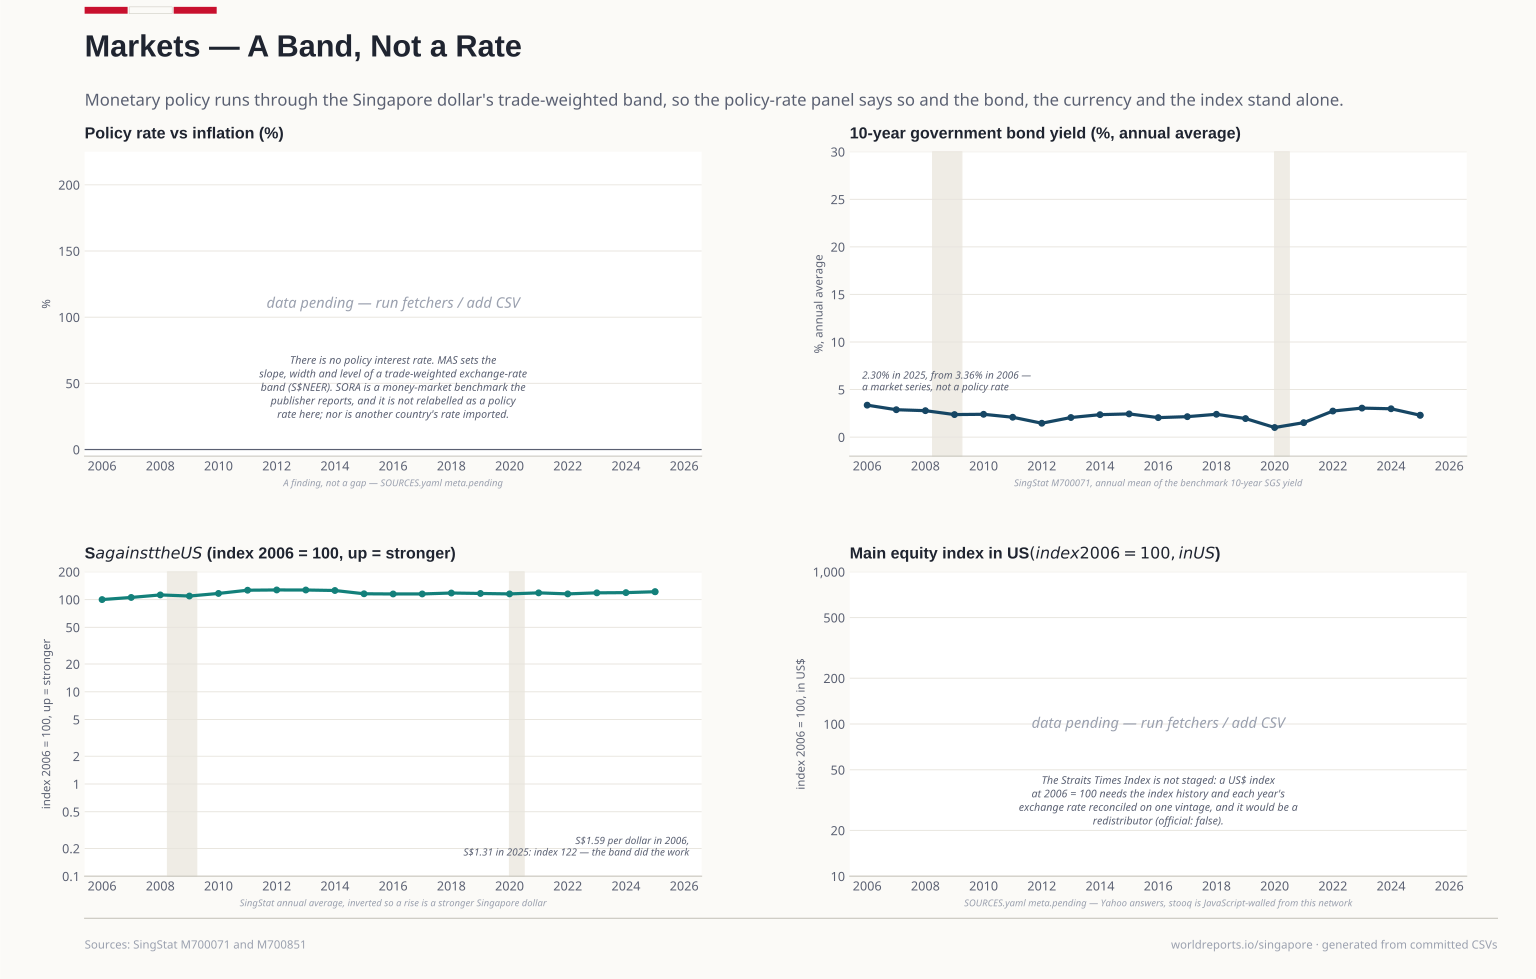
  5. Markets. There is no policy rate to plot: MAS sets the slope, width and level of the Singapore dollar's trade-weighted band. The bond yield and the currency are market series. 10-year bond yield 2.30% in 2025; S$ per US$ 1.31 in 2025; SORA overnight benchmark 1.70% in 2025. Every figure is read from this country's committed CSVs. Plate 05

    Markets

    There is no policy rate to plot: MAS sets the slope, width and level of the Singapore dollar's trade-weighted band. The bond yield and the currency are market series.

    View full size Download vector (SVG)
    Drawn from · 1

    The committed files this plate was read from, as recorded while it was drawn.

    • markets/markets.csvSingStat Table Builder M700071 — Current Banks Interest Rates (end of period, monthly) and M700851 — Exchange Rates (average for period, annual) · 2006-2025
    20062025
    2.30% 10-year bond yield 2025
    1.31 S$ per US$ 2025
    1.70% SORA overnight benchmark latest
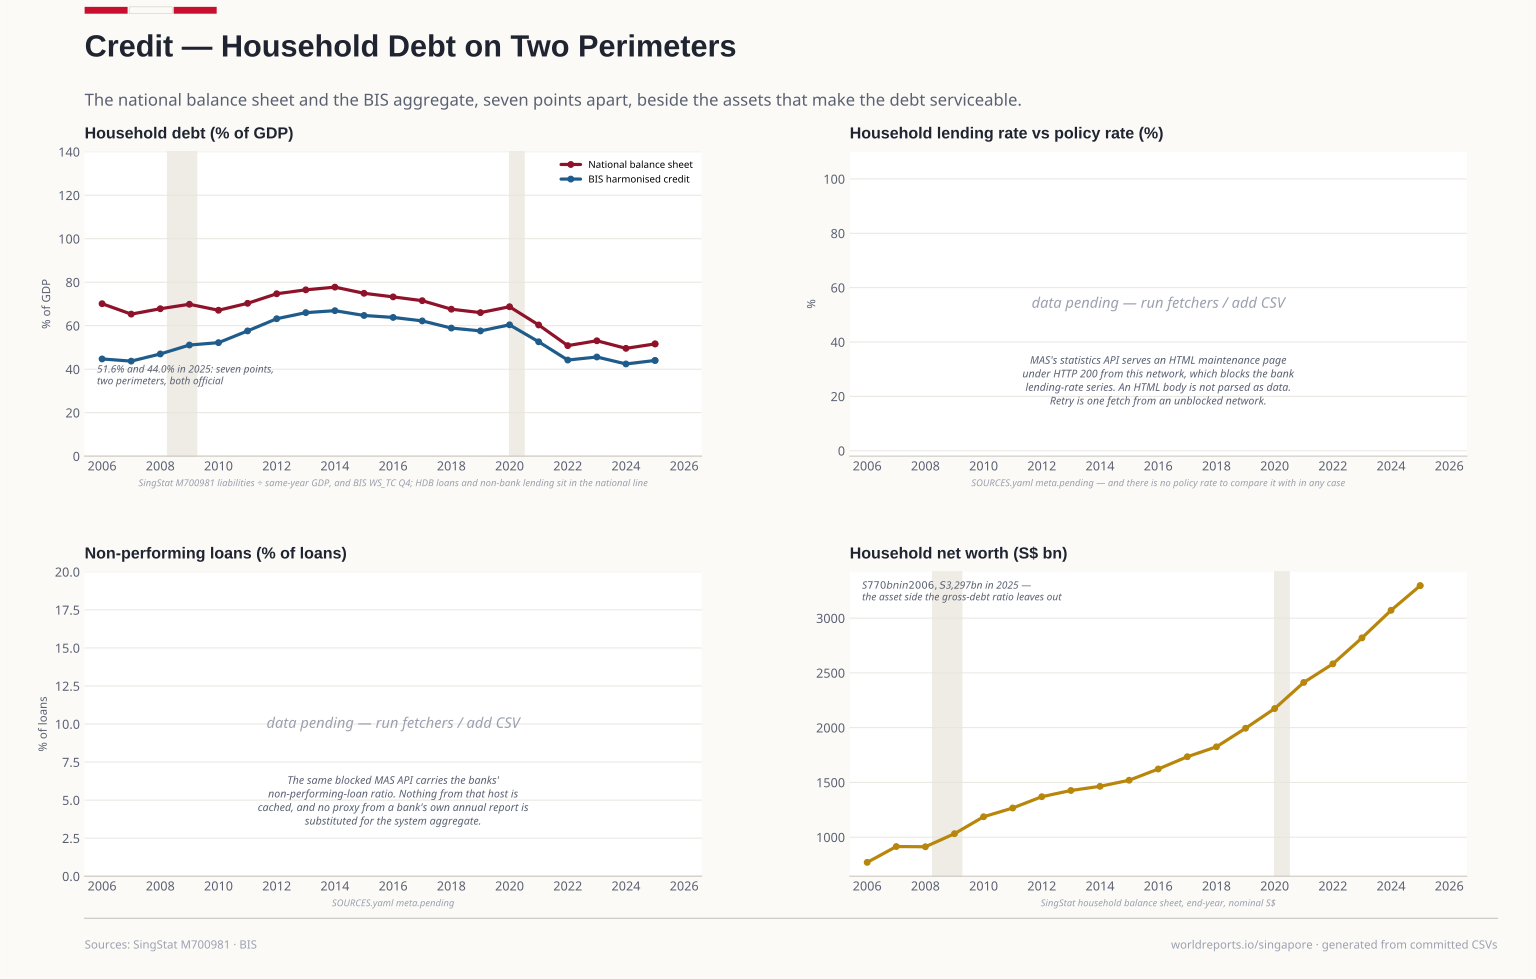
  6. Credit. Household debt is 52% of GDP on the national balance sheet and 44% on the BIS aggregate, against net worth of S$3.3 trillion. The MAS lending and NPL series are blocked. Household debt (national) 51.6% GDP in 2025; Household debt (BIS) 44.0% GDP in 2025; Household net worth S$3.30tn in 2025. Every figure is read from this country's committed CSVs. Plate 06

    Credit

    Household debt is 52% of GDP on the national balance sheet and 44% on the BIS aggregate, against net worth of S$3.3 trillion. The MAS lending and NPL series are blocked.

    View full size Download vector (SVG)
    Drawn from · 1

    The committed files this plate was read from, as recorded while it was drawn.

    • credit/household.csvSingStat Table Builder M700981 — Household Sector Balance Sheet (Q4) and BIS total credit WS_TC Q.SG.H.A.M.770.A.E · 2006-2025
    20062025
    51.6% GDP Household debt (national) latest
    44.0% GDP Household debt (BIS) latest
    S$3.30tn Household net worth latest
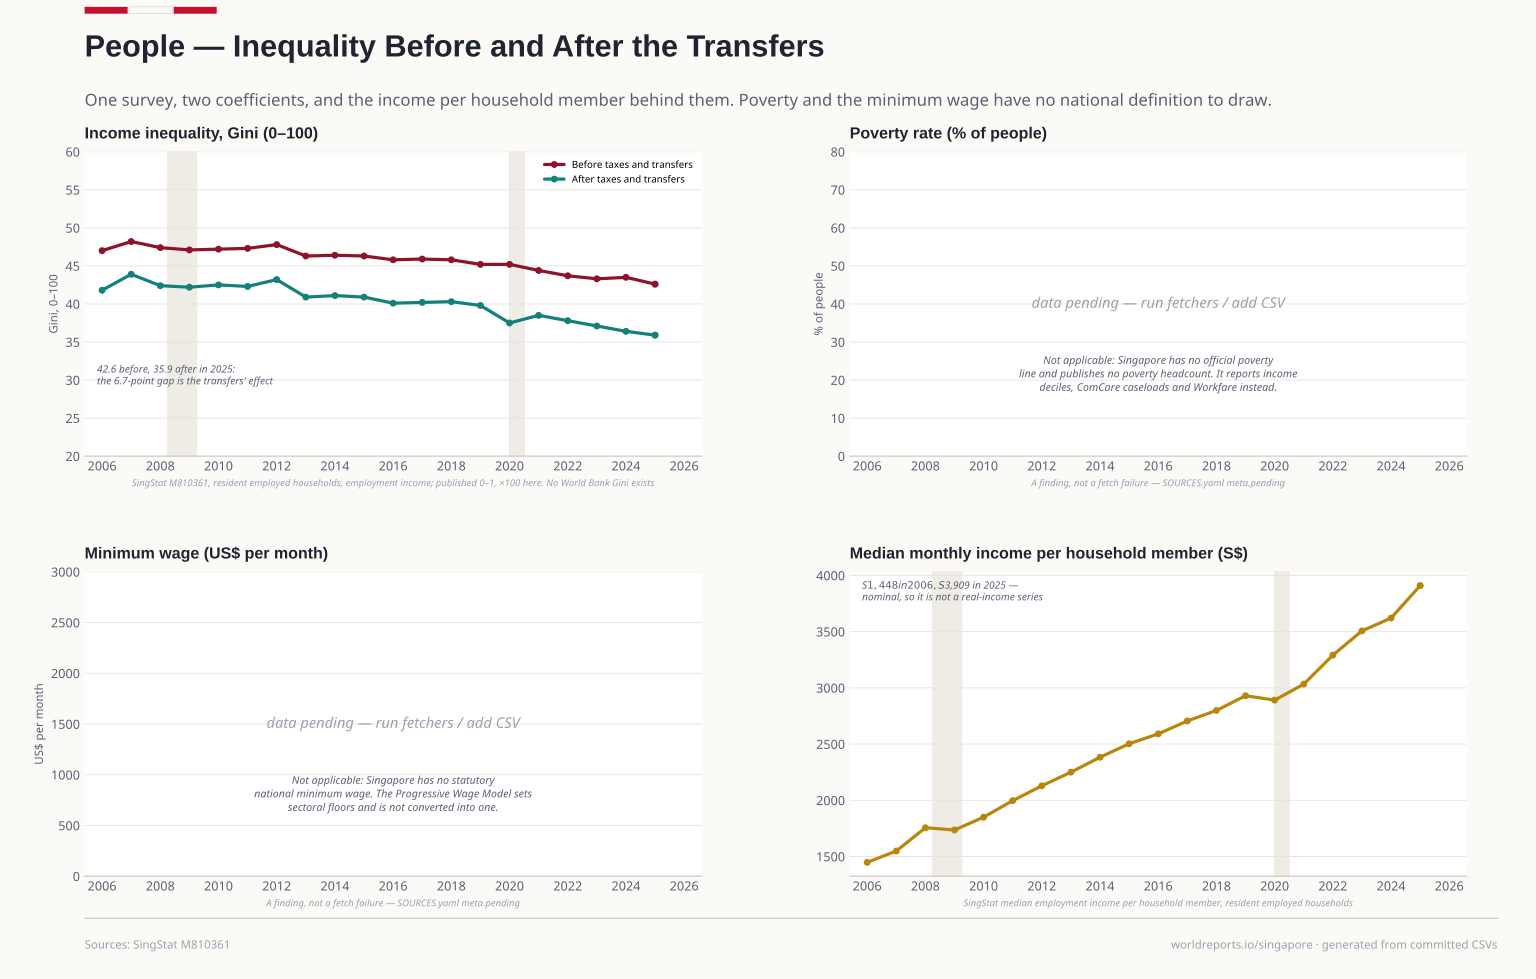
  7. People and Incomes. One survey prints six coefficients; the two drawn are before and after taxes and transfers, on employment income of resident employed households. Poverty and the minimum wage have no national definition. Gini after taxes and transfers 35.90 in 2025; Gini before taxes and transfers 42.60 in 2025; Median income per household member, S$ 3,909 in 2025. Every figure is read from this country's committed CSVs. Plate 07

    People and Incomes

    One survey prints six coefficients; the two drawn are before and after taxes and transfers, on employment income of resident employed households. Poverty and the minimum wage have no national definition.

    View full size Download vector (SVG)
    Drawn from · 1

    The committed files this plate was read from, as recorded while it was drawn.

    • people/income.csvSingStat Table Builder M810361 — Key Indicators On Household Employment Income Among Resident Employed Households · 2006-2025
    20062025
    35.90 Gini after taxes and transfers 2025
    42.60 Gini before taxes and transfers 2025
    3,909 Median income per household member, S$ 2025
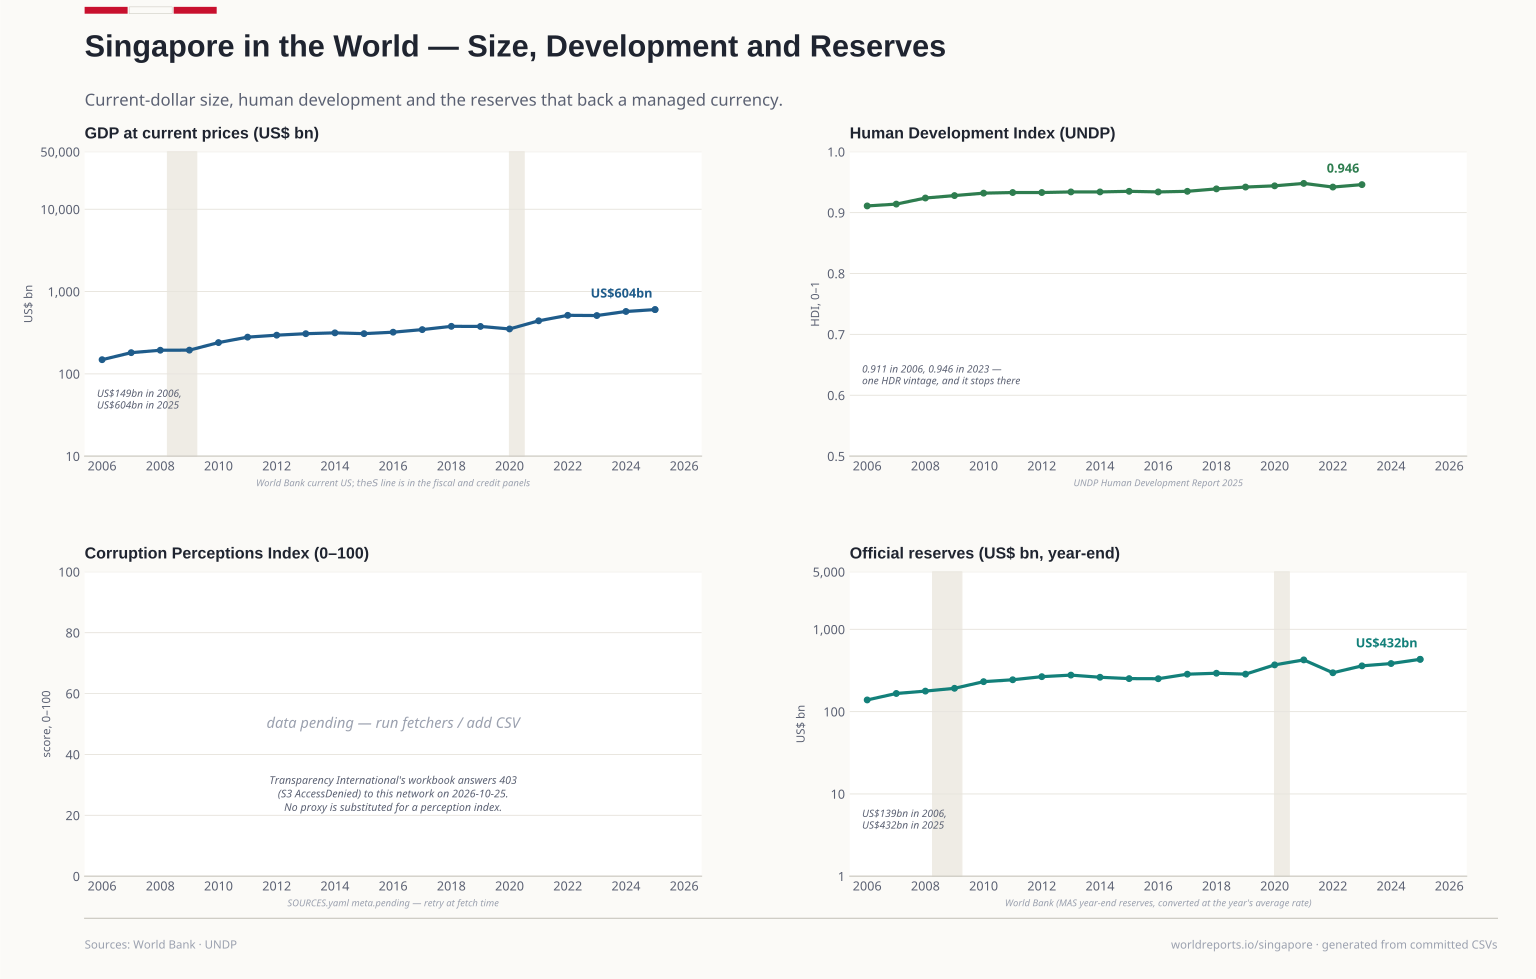
  8. Singapore in the World. A city of six million with the GDP of a mid-sized country, a 2023 HDI of 0.946, and reserves that back a managed currency. The corruption index is not reachable. GDP, US$ bn US$ 604bn in 2025; Human Development Index 0.946 in 2023; Official reserves, US$ bn US$ 432bn in 2025. Every figure is read from this country's committed CSVs. Plate 08

    Singapore in the World

    A city of six million with the GDP of a mid-sized country, a 2023 HDI of 0.946, and reserves that back a managed currency. The corruption index is not reachable.

    View full size Download vector (SVG)
    Drawn from · 1

    The committed files this plate was read from, as recorded while it was drawn.

    • world/world.csvWorld Bank WDI — NY.GDP.MKTP.CD, NY.GDP.PCAP.CD, FI.RES.TOTL.CD; UNDP HDR 2025 (one vintage) HDI; SingStat M700031 for the SGD reserves stock · 2006-2025
    20062025
    US$ 604bn GDP, US$ bn 2025
    0.946 Human Development Index 2023
    US$ 432bn Official reserves, US$ bn latest
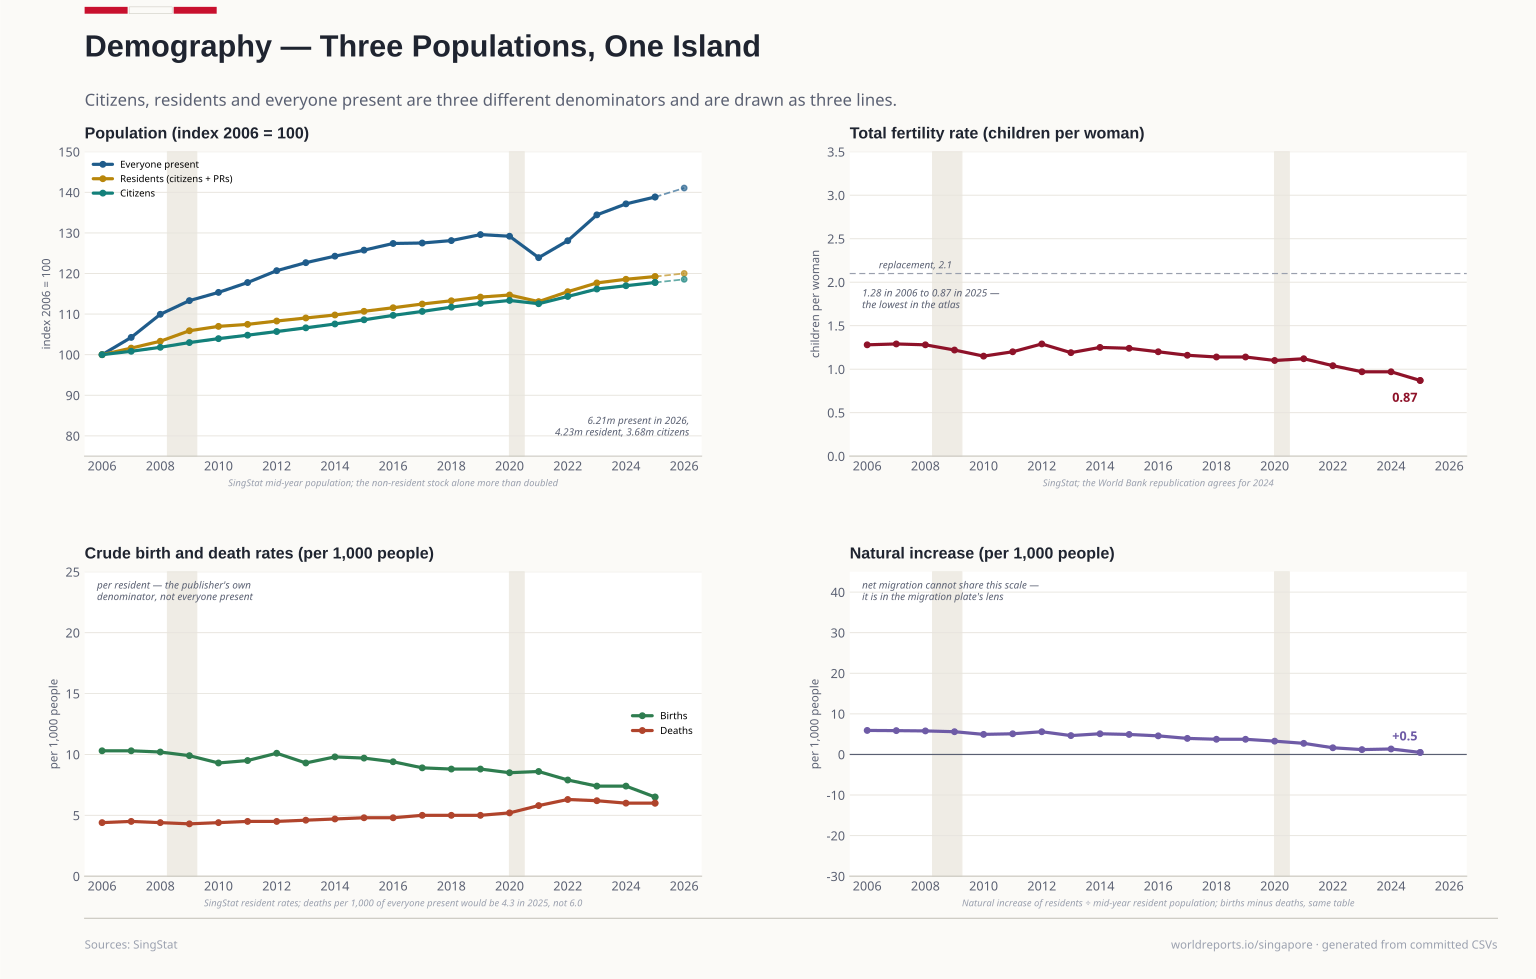
  9. Demography. Citizens, residents and everyone present are three populations, and the third grew twice as fast. Fertility is 0.87 — the lowest in the atlas. Total population 6.2M in 2026; Residents 4.2M in 2026; Total fertility rate 0.87 in 2025. Every figure is read from this country's committed CSVs. Plate 09

    Demography

    Citizens, residents and everyone present are three populations, and the third grew twice as fast. Fertility is 0.87 — the lowest in the atlas.

    View full size Download vector (SVG)
    Drawn from · 1

    The committed files this plate was read from, as recorded while it was drawn.

    • demography/demography.csvSingStat Table Builder M810001 (population, mid-year), M810091 (births and fertility), M810481 (deaths), M810501 (life expectancy), M890151 (land area) · 2006-2026
    20062025
    6.2M Total population latest
    4.2M Residents latest
    0.87 Total fertility rate 2025
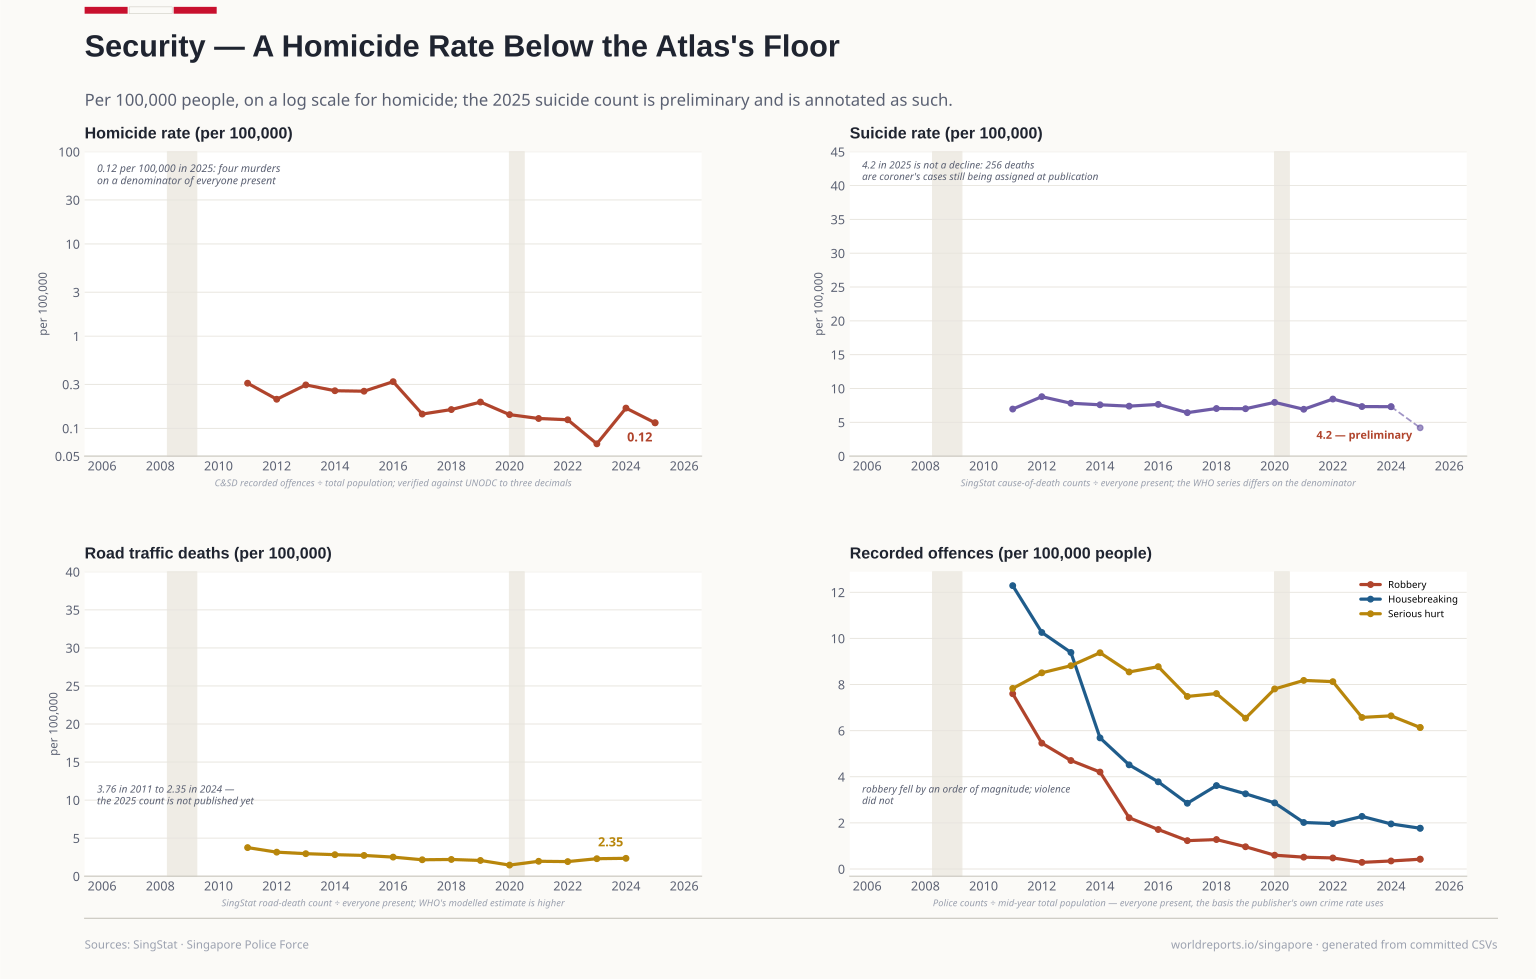
  10. Security. Murder is a Penal Code category and there were seven in 2025; the suicide line's 2025 fall is coroner's cases still being assigned, not a decline. Suicide rate, preliminary year 4.2/100k in 2025; Road deaths 2.4/100k in 2024; Murder rate 0.12/100k in 2025. Every figure is read from this country's committed CSVs. Plate 10

    Security

    Murder is a Penal Code category and there were seven in 2025; the suicide line's 2025 fall is coroner's cases still being assigned, not a decline.

    View full size Download vector (SVG)
    Drawn from · 2

    The committed files this plate was read from, as recorded while it was drawn.

    • demography/demography.csvSingStat Table Builder M810001 (population, mid-year), M810091 (births and fertility), M810481 (deaths), M810501 (life expectancy), M890151 (land area) · 2006-2026
    • security/security.csvSingStat Table Builder M890891 (selected major offences), M810131 (suicides), M651421 (road-traffic death rate); UNODC VC.IHR.PSRC.P5 and WHO SH.STA.SUIC.P5 / SH.STA.TRAF.P5 via the World Bank · 2011-2025
    20112025
    4.2/100k Suicide rate, preliminary year latest
    2.4/100k Road deaths 2024
    0.12/100k Murder rate latest
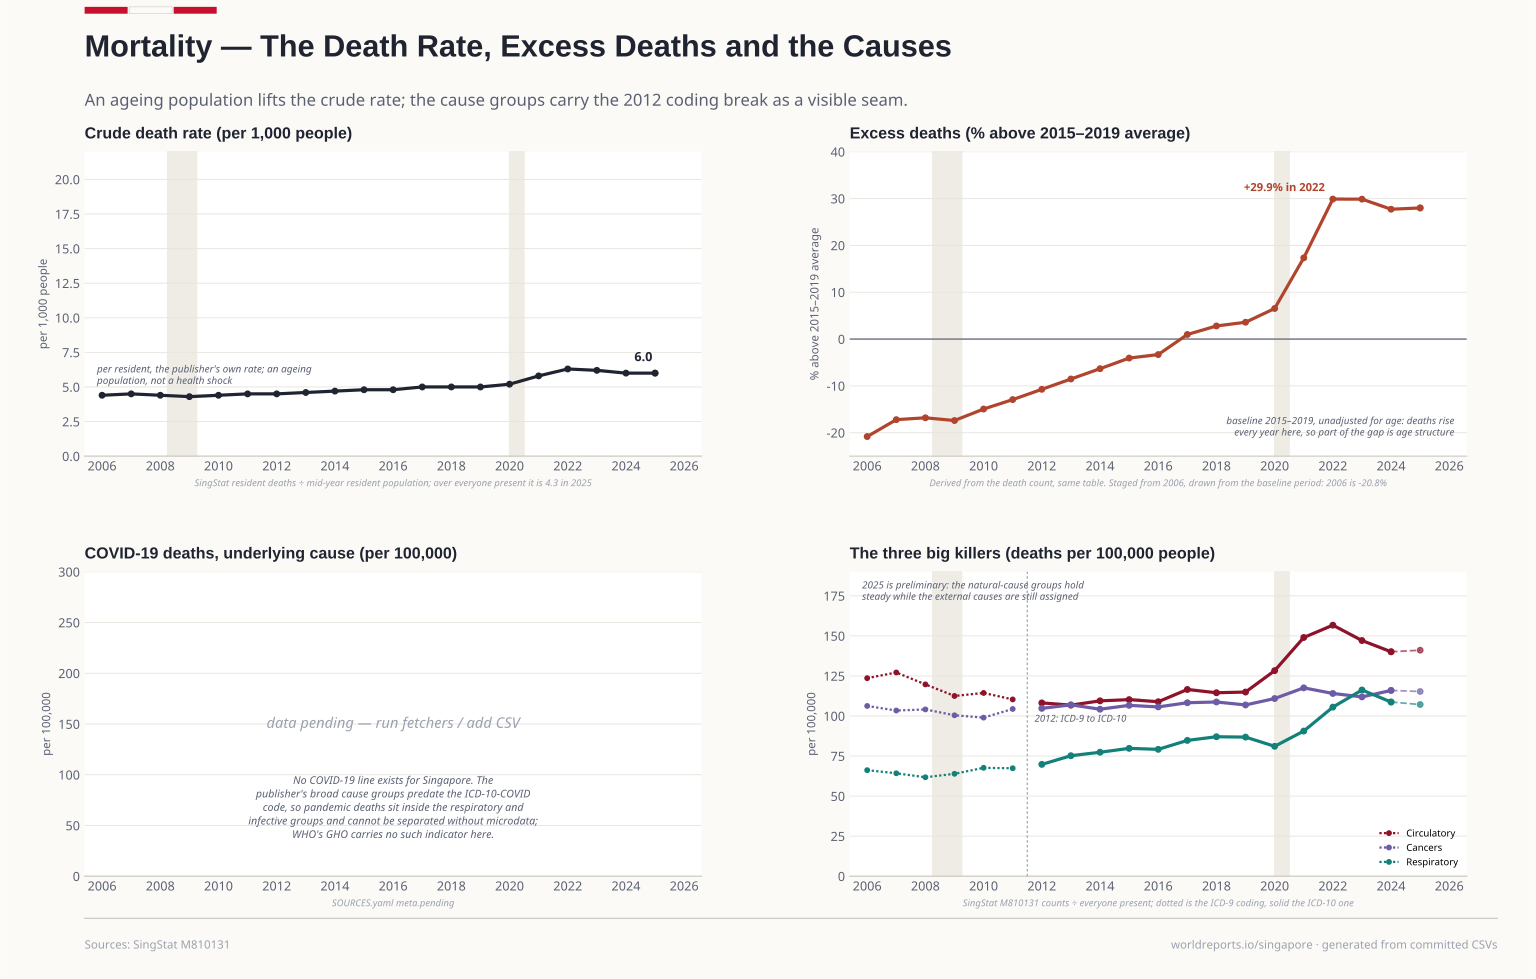
  11. Mortality. Deaths per resident rose with an ageing population, not with a shock: the crude rate went from 4.4 to 6.0 per 1,000. Excess deaths over 2015–2019 peak at 30%. Crude death rate, per 1,000 residents 6.00 in 2025; Deaths in the year 26,499 in 2025; Life expectancy 83.90 in 2025. Every figure is read from this country's committed CSVs. Plate 11

    Mortality

    Deaths per resident rose with an ageing population, not with a shock: the crude rate went from 4.4 to 6.0 per 1,000. Excess deaths over 2015–2019 peak at 30%.

    View full size Download vector (SVG)
    Drawn from · 2

    The committed files this plate was read from, as recorded while it was drawn.

    • demography/demography.csvSingStat Table Builder M810001 (population, mid-year), M810091 (births and fertility), M810481 (deaths), M810501 (life expectancy), M890151 (land area) · 2006-2026
    • mortality/mortality.csvSingStat Table Builder M810131 (deaths by broad cause groups), M810481 (deaths and rates), M810501 (life expectancy); World Bank SP.DYN.CDRT.IN and SP.DYN.LE00.IN · 2006-2025
    20062025
    6.00 Crude death rate, per 1,000 residents 2025
    26,499 Deaths in the year 2025
    83.90 Life expectancy latest
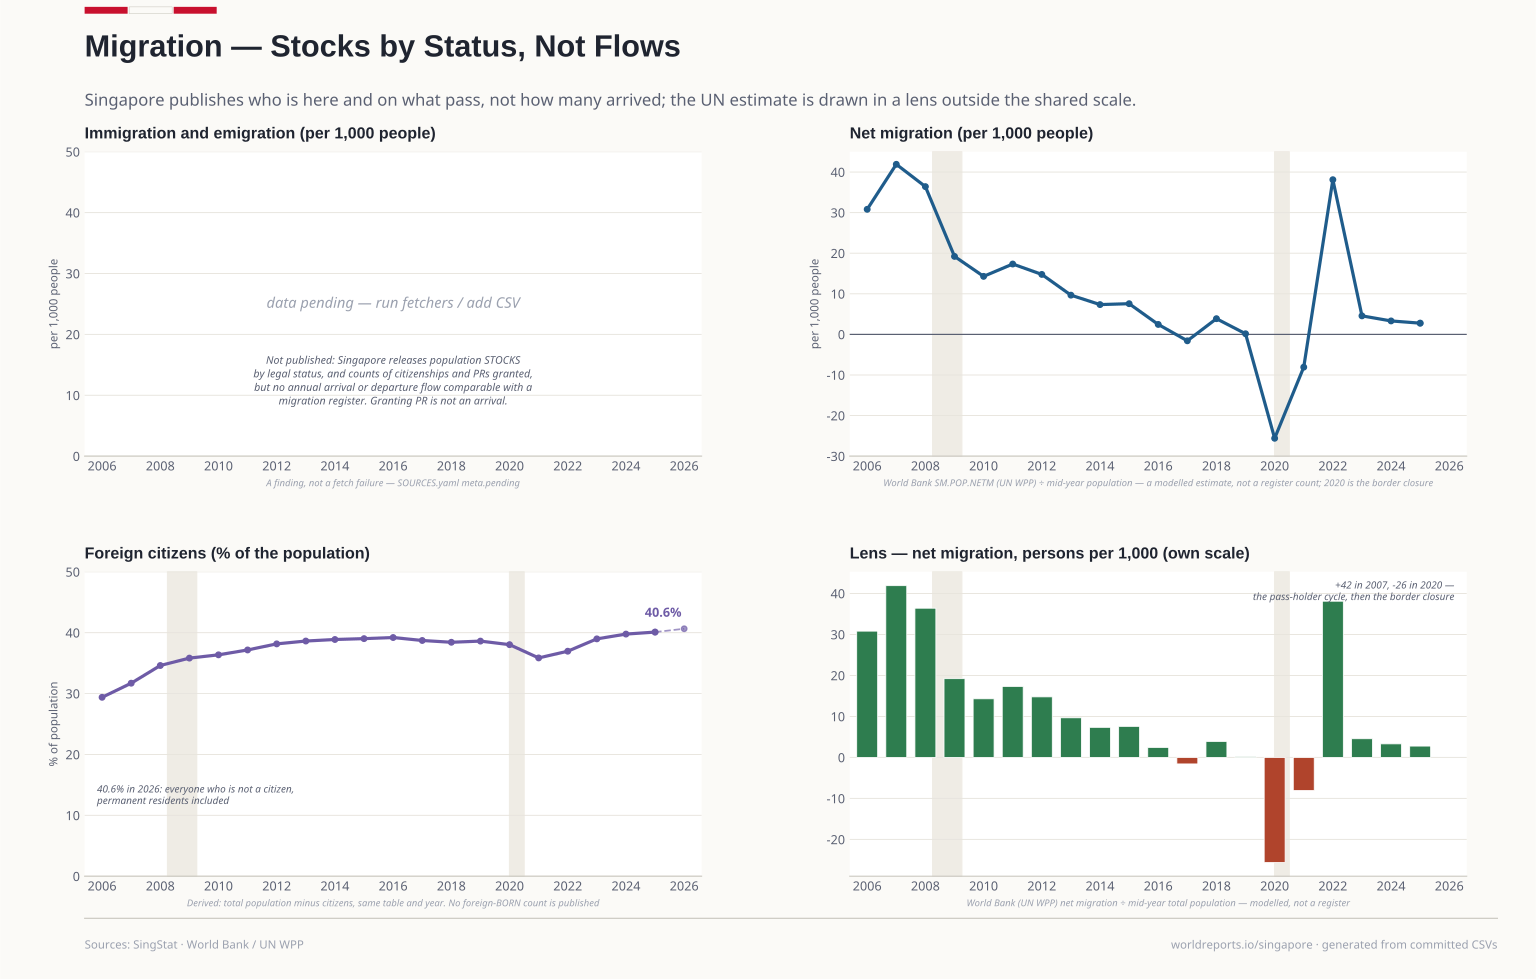
  12. Migration. Singapore publishes who is here and on what pass, not how many arrived: 40% of the population are not citizens. The UN's net estimate is drawn in a lens. Foreign citizens 40.6% in 2026; Non-residents 2.0M in 2026; Net migration, per 1,000 people 2.76 in 2025. Every figure is read from this country's committed CSVs. Plate 12

    Migration

    Singapore publishes who is here and on what pass, not how many arrived: 40% of the population are not citizens. The UN's net estimate is drawn in a lens.

    View full size Download vector (SVG)
    Drawn from · 2

    The committed files this plate was read from, as recorded while it was drawn.

    • demography/demography.csvSingStat Table Builder M810001 (population, mid-year), M810091 (births and fertility), M810481 (deaths), M810501 (life expectancy), M890151 (land area) · 2006-2026
    • migration/migration.csvSingStat Table Builder M810001 (non-resident population) and M810791 (share of non-resident population by pass type); UN WPP net migration SM.POP.NETM via the World Bank · 2006-2026
    20062025
    40.6% Foreign citizens latest
    2.0M Non-residents latest
    2.76 Net migration, per 1,000 people 2025