Venezuela

11 plates of official data, 2006-2026

Every figure on this page comes from a publisher that names its definition — the National Institute of Statistics for the Gini, and the IMF, the World Bank, UNDP and UNHCR for everything the Venezuelan state stopped publishing — and every plate is regenerated from committed CSVs, so the charts and the numbers here cannot drift apart. This is the first country in the atlas whose national statistical system is largely absent: the Central Bank's site does not answer over TLS from this network, the INE publishes no consumer prices and no national accounts, and the open-data portal times out. What is left is the harmonised layer, drawn as what it is — a staff estimate — never as a Venezuelan outturn. Two series leave the atlas's comparison ranges on purpose and are drawn in lens panels on their own axes: a hyperinflation of 65,374% and an emigration wave of −45.5 per 1,000.

Where things stand

The plates

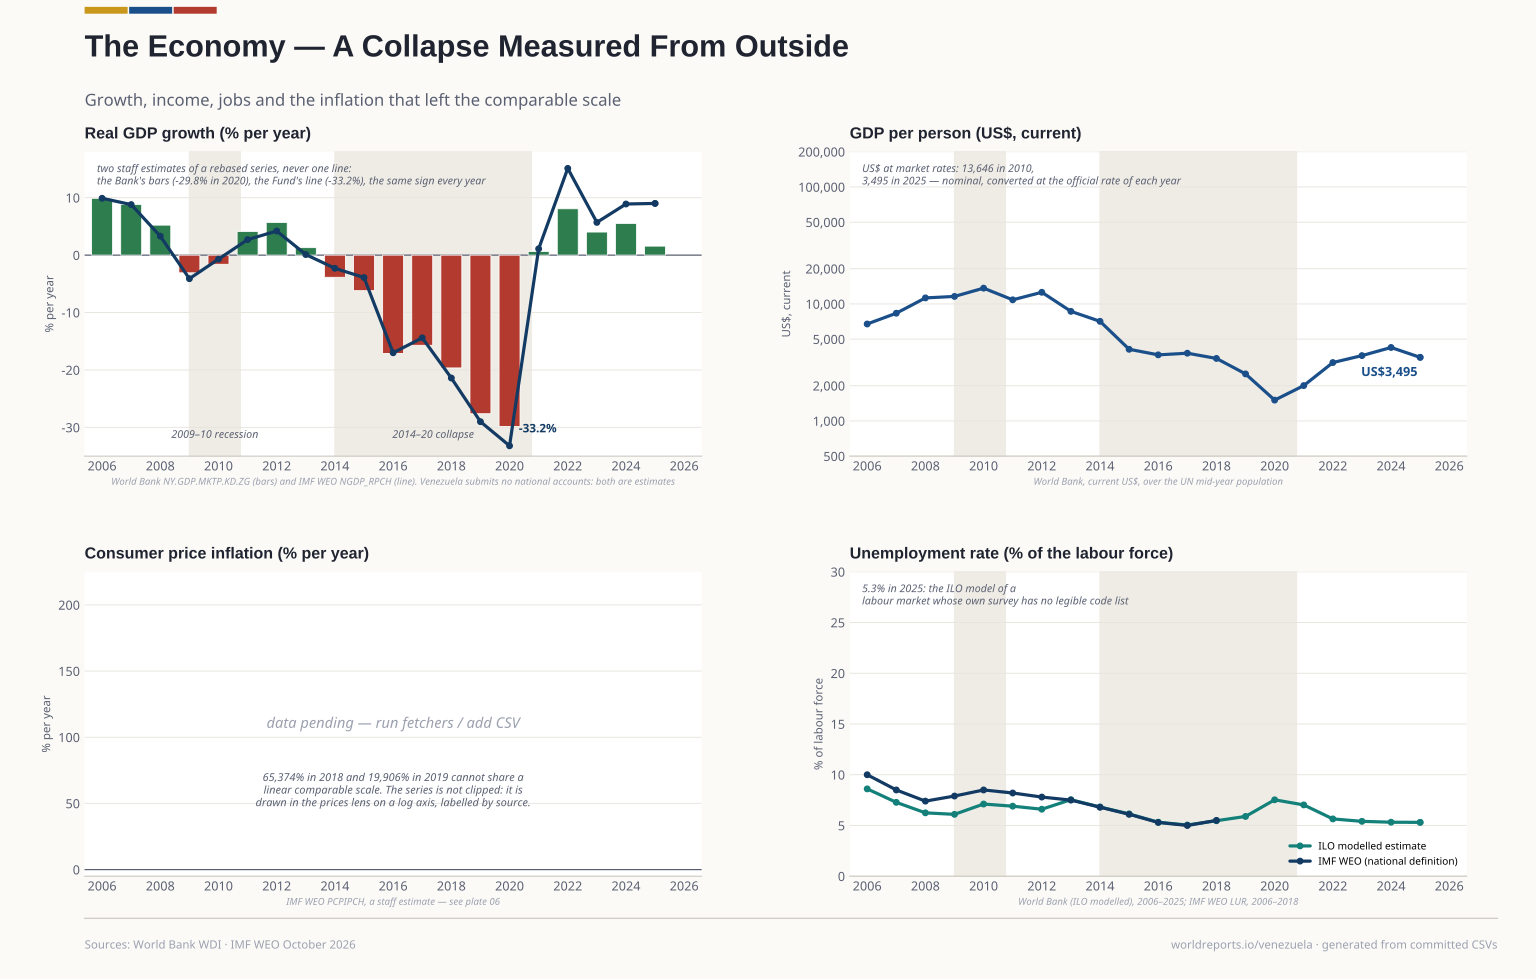
  1. Four panels: real GDP growth as World Bank bars with the IMF's staff estimate as a line, both troughing in 2020; GDP per person on a log axis; a pending inflation slot with its reason; and unemployment on the ILO model beside the Fund's series. Plate 01

    The Economy

    Two staff estimates of the same collapse: the World Bank's bars fall 29.8% in 2020, the Fund's line 33.2%, and income per person ends the window at a quarter of its 2010 level. The inflation that followed is on the people plate, because 65,374% cannot share a linear axis.

    View full size Download vector (SVG)
    Drawn from · 2

    The committed files this plate was read from, as recorded while it was drawn.

    • macro/economy.csvWorld Bank WDI (NY.GDP.MKTP.KD.ZG, FP.CPI.TOTL.ZG, SL.UEM.TOTL.ZS) and IMF WEO October 2026 (NGDP_RPCH, PCPIPCH, LUR) · 2006-2025
    • world/gdp_per_person.csvWorld Bank WDI NY.GDP.PCAP.CD · 2006-2025
    20062025
    3,495 GDP per person, US$ 2025
    +9.0% Real growth, IMF estimate 2025
    5.3% Unemployment, ILO model 2025
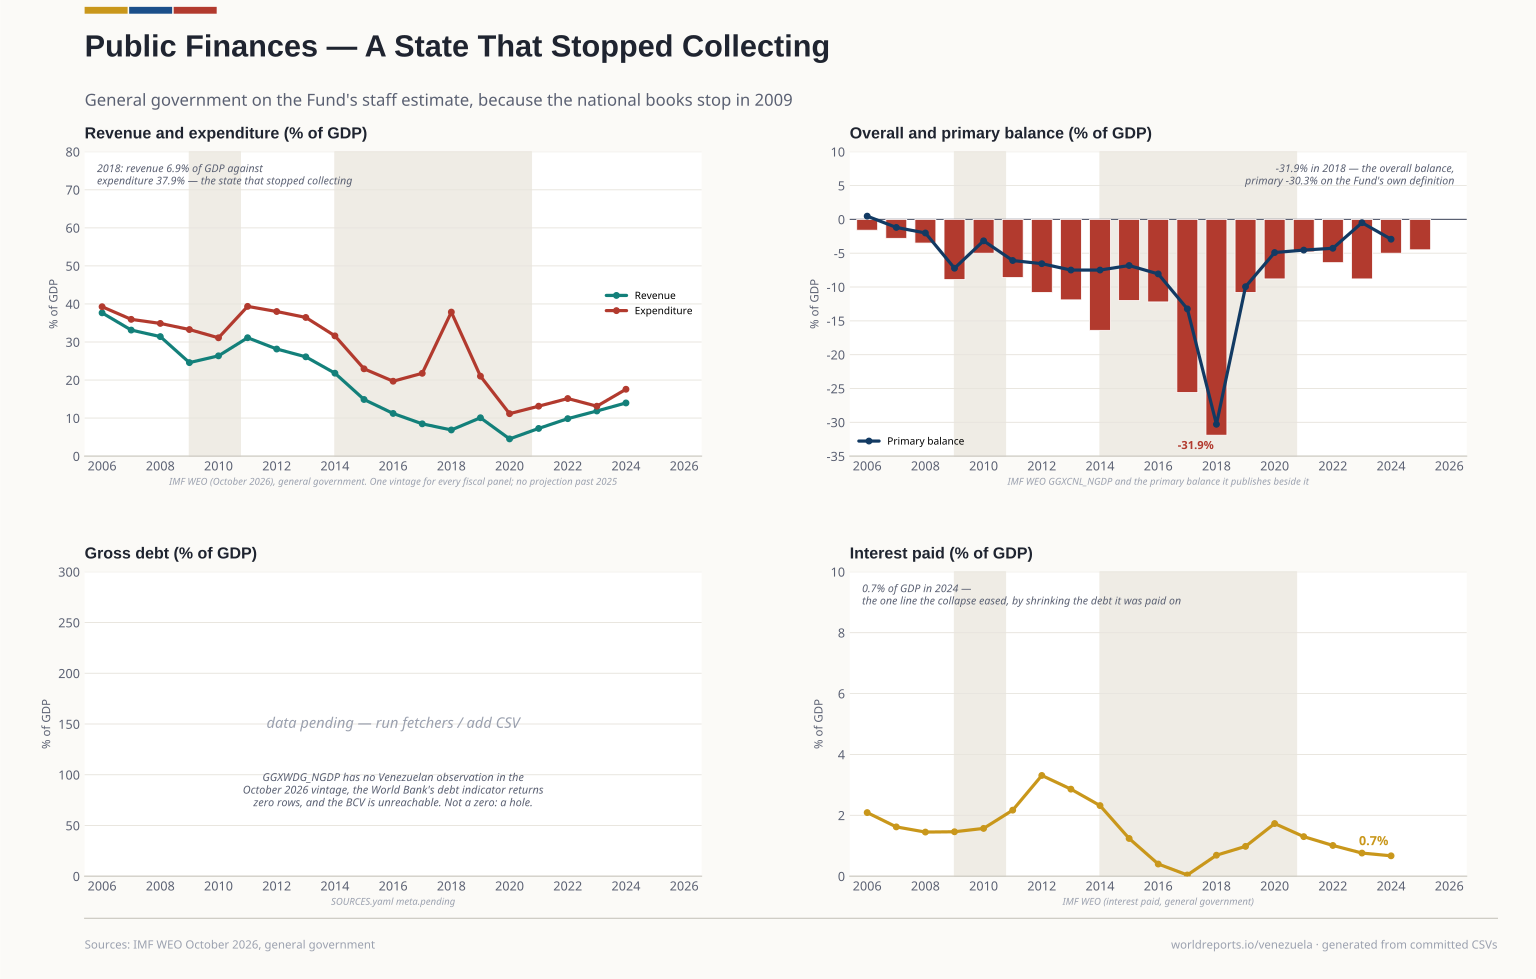
  2. Four panels on the Fund's general-government estimate: revenue and expenditure as shares of GDP; the overall balance as bars with the primary balance as a line; a pending debt slot; and interest paid. Plate 02

    Public Finances

    The Fund's general-government estimate, because the national books stop in 2009: revenue of 6.9% of GDP in 2018 against spending of 37.9%, a deficit of -31.9 points. No debt stock is drawn — the vintage carries no Venezuelan observation, and a hole is not a zero.

    View full size Download vector (SVG)
    Drawn from · 1

    The committed files this plate was read from, as recorded while it was drawn.

    • fiscal/fiscal.csvIMF WEO (October 2026 vintage), general government: rev, exp, GGXCNL_NGDP, pb, ie · 2006-2025
    20062025
    -4.5% GDP Overall balance 2025
    14.0% GDP Revenue 2024
    17.6% GDP Expenditure 2024
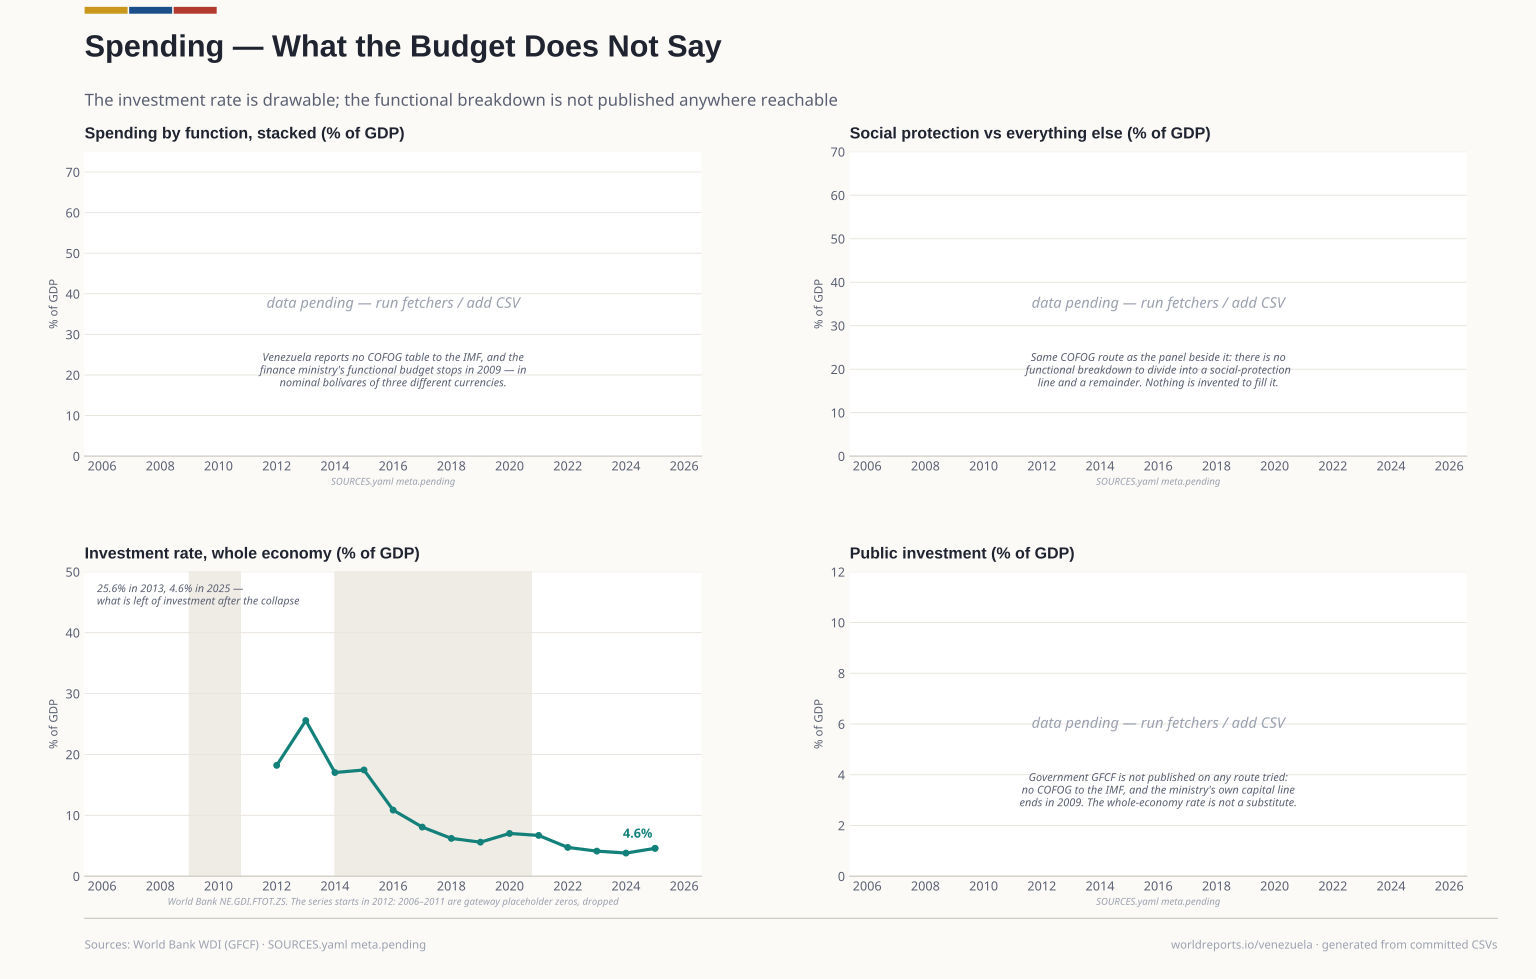
  3. Four panels: three pending for the functional breakdown, the social-protection split and public investment, each with the route that failed; and whole-economy investment falling from a quarter of GDP to under 4%. Plate 03

    What the Budget Does Not Say

    Three of four panels are pending, and that is the finding: Venezuela reports no COFOG to the IMF and the finance ministry's functional budget stops in 2009, in bolívares of three different currencies. What can be drawn is the whole-economy investment rate — 25.6% of GDP in 2013, 3.8% in 2024.

    View full size Download vector (SVG)
    Drawn from · 1

    The committed files this plate was read from, as recorded while it was drawn.

    20122025
    4.6% GDP Investment rate, whole economy 2025
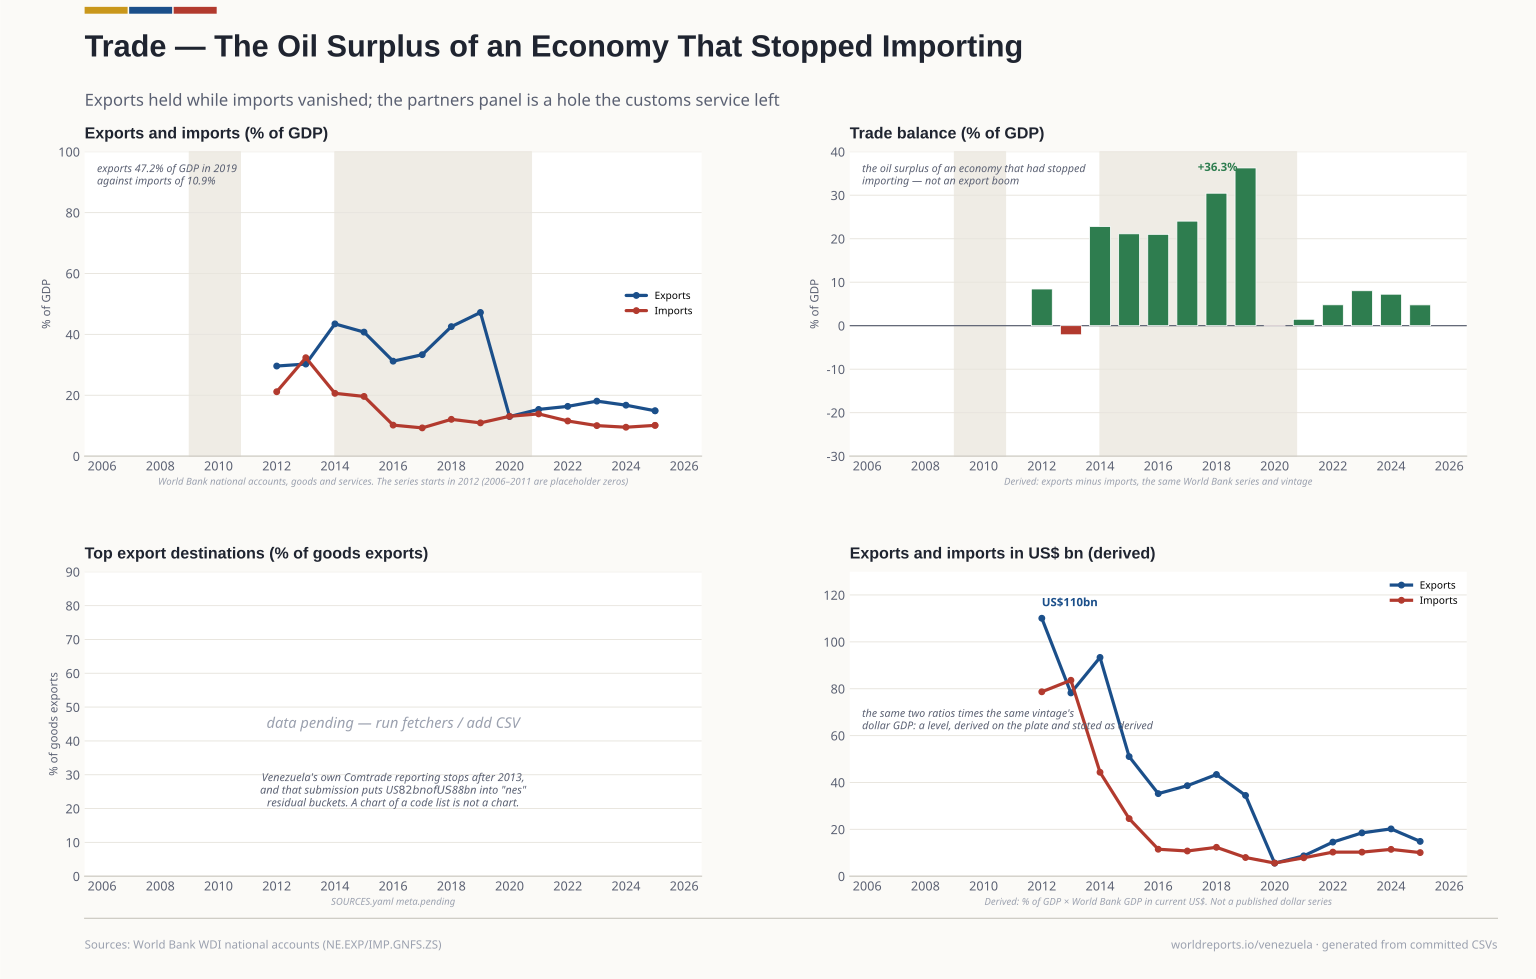
  4. Four panels: exports and imports as shares of GDP from 2012; the trade balance as bars, reaching its surplus in 2019; a pending destinations slot; and a lens deriving the same two flows in US$ billion. Plate 04

    Trade

    The oil surplus of an economy that had stopped importing: exports were 47.2% of GDP in 2019 against imports of 10.9%, a balance of +36.3 points. The destinations panel is a hole — the customs service does not answer and Venezuela's own Comtrade reporting stops in 2013.

    View full size Download vector (SVG)
    Drawn from · 2

    The committed files this plate was read from, as recorded while it was drawn.

    • trade/trade.csvWorld Bank WDI NE.EXP.GNFS.ZS and NE.IMP.GNFS.ZS · 2012-2025
    • world/gdp_usd.csvWorld Bank WDI NY.GDP.MKTP.CD (canonical) and IMF WEO NGDPD (labelled second line) · 2006-2025
    20122025
    +4.8% GDP Trade balance 2025
    14.9% GDP Exports 2025
    10.1% GDP Imports 2025
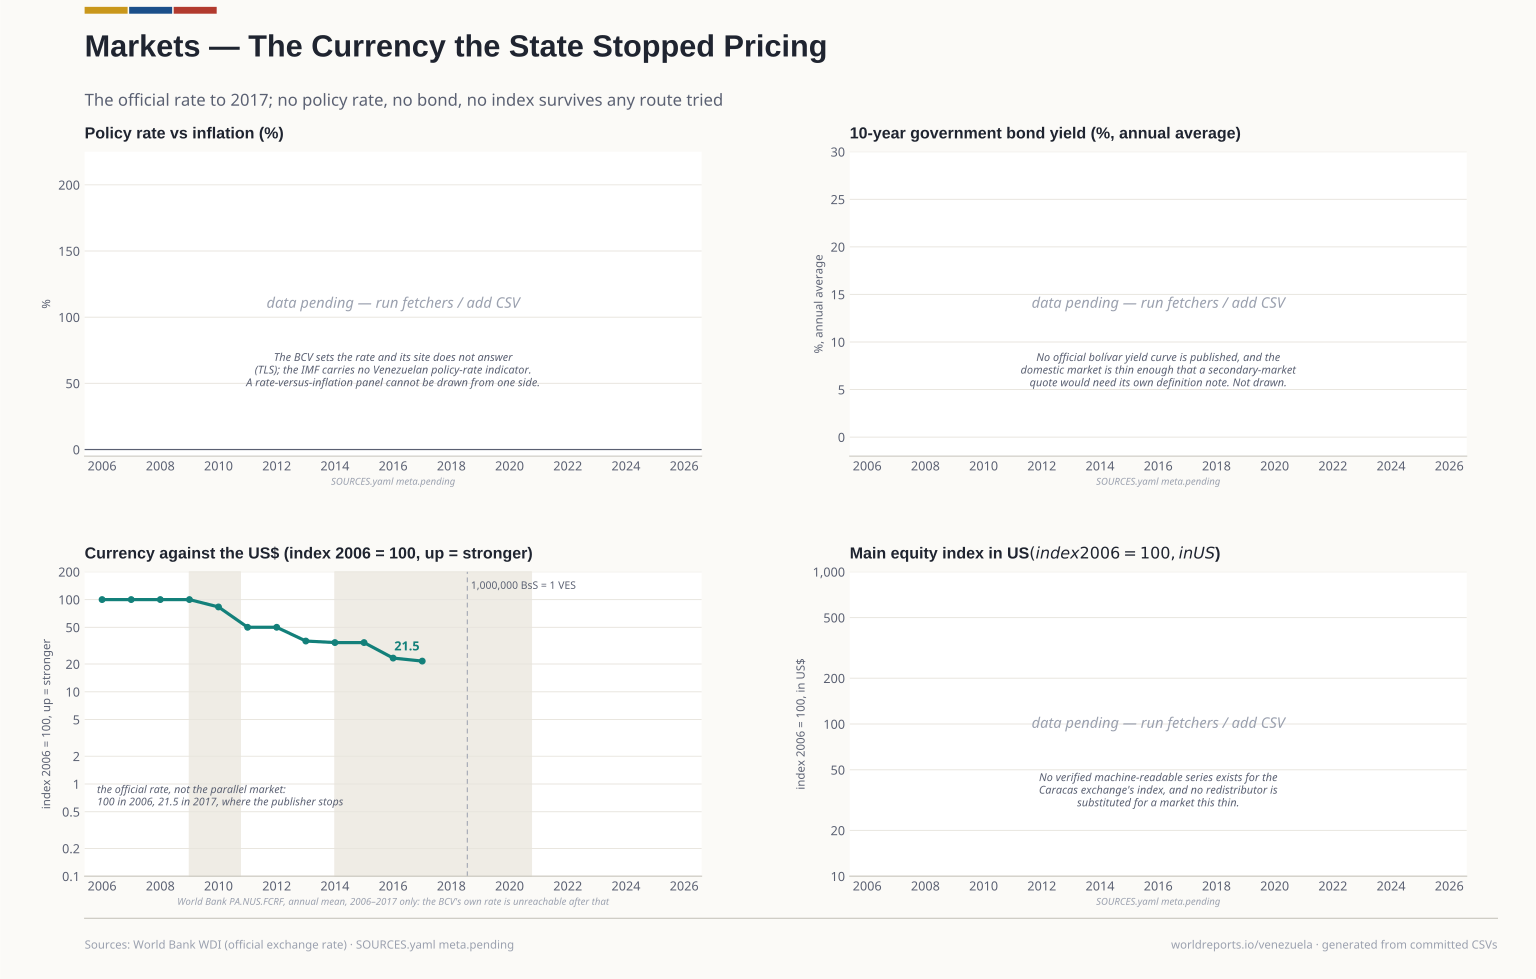
  5. Four panels: pending policy rate, bond yield and equity index, each with its reason; and the official exchange rate as an index on a log axis from 100 in 2006 to 21.5 in 2017, marked with the 2018 redenomination. Plate 05

    Markets

    The Central Bank publishes the policy rate, the reserves and the exchange rate, and its site does not answer over TLS from this network. What is left is the official rate to 2017, as an index: 100 in 2006, 21.5 in 2017. The policy rate, the bond and the equity index stay pending rather than drawn from a substitute.

    View full size Download vector (SVG)
    Drawn from · 1

    The committed files this plate was read from, as recorded while it was drawn.

    20062017
    21.52 Currency index, 2006 = 100 latest
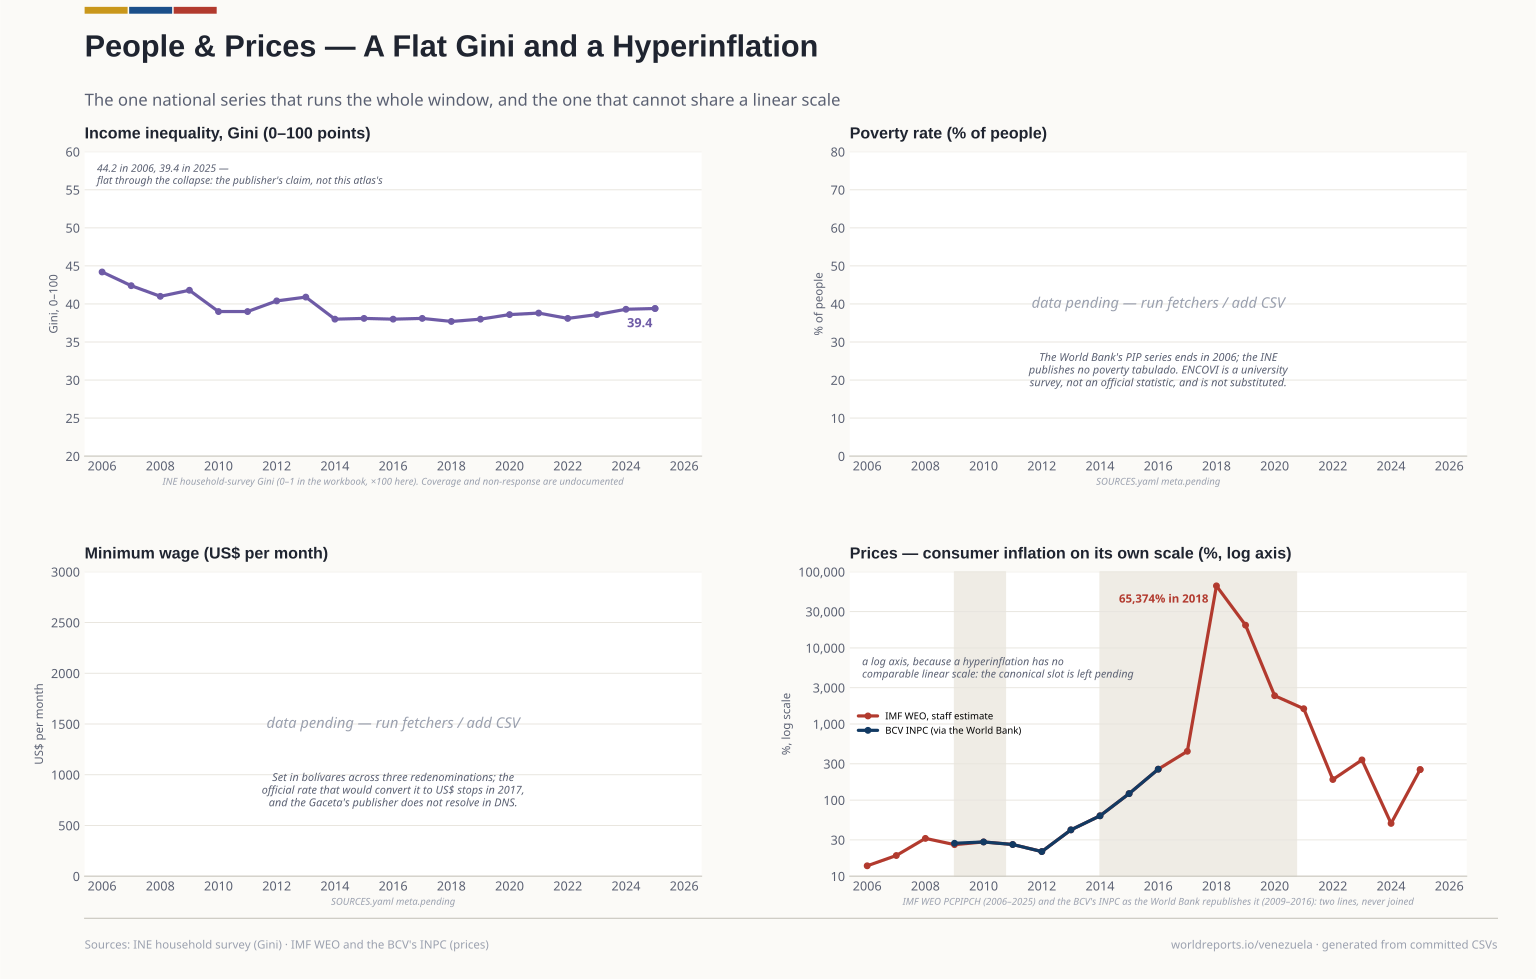
  6. Four panels: the INE's Gini as a nearly flat line; pending poverty and minimum-wage slots; and a prices lens on a log axis where the Fund's staff estimate rises to 65,374% in 2018, with the BCV's own INPC drawn as a separate short line. Plate 06

    People & Prices

    The one national series that runs the whole window is the INE's Gini, and it barely moves: 44.2 at its highest, 37.7 at its lowest in 2018. That flatness is the publisher's claim, not this atlas's finding. Beside it, the prices lens: the Fund's estimate reaches 65,374% in 2018, on a log axis, with the BCV's own INPC as a separate short line.

    View full size Download vector (SVG)
    Drawn from · 2

    The committed files this plate was read from, as recorded while it was drawn.

    • macro/economy.csvWorld Bank WDI (NY.GDP.MKTP.KD.ZG, FP.CPI.TOTL.ZG, SL.UEM.TOTL.ZS) and IMF WEO October 2026 (NGDP_RPCH, PCPIPCH, LUR) · 2006-2025
    • people/gini.csvInstituto Nacional de Estadística (INE), 'Tabulados — Coeficiente GINI' (household survey); World Bank SI.POV.GINI as the 2006 cross-check · 2006-2025
    20062025
    39.40 Gini, INE survey 2025
    252.0% Inflation, IMF estimate 2025
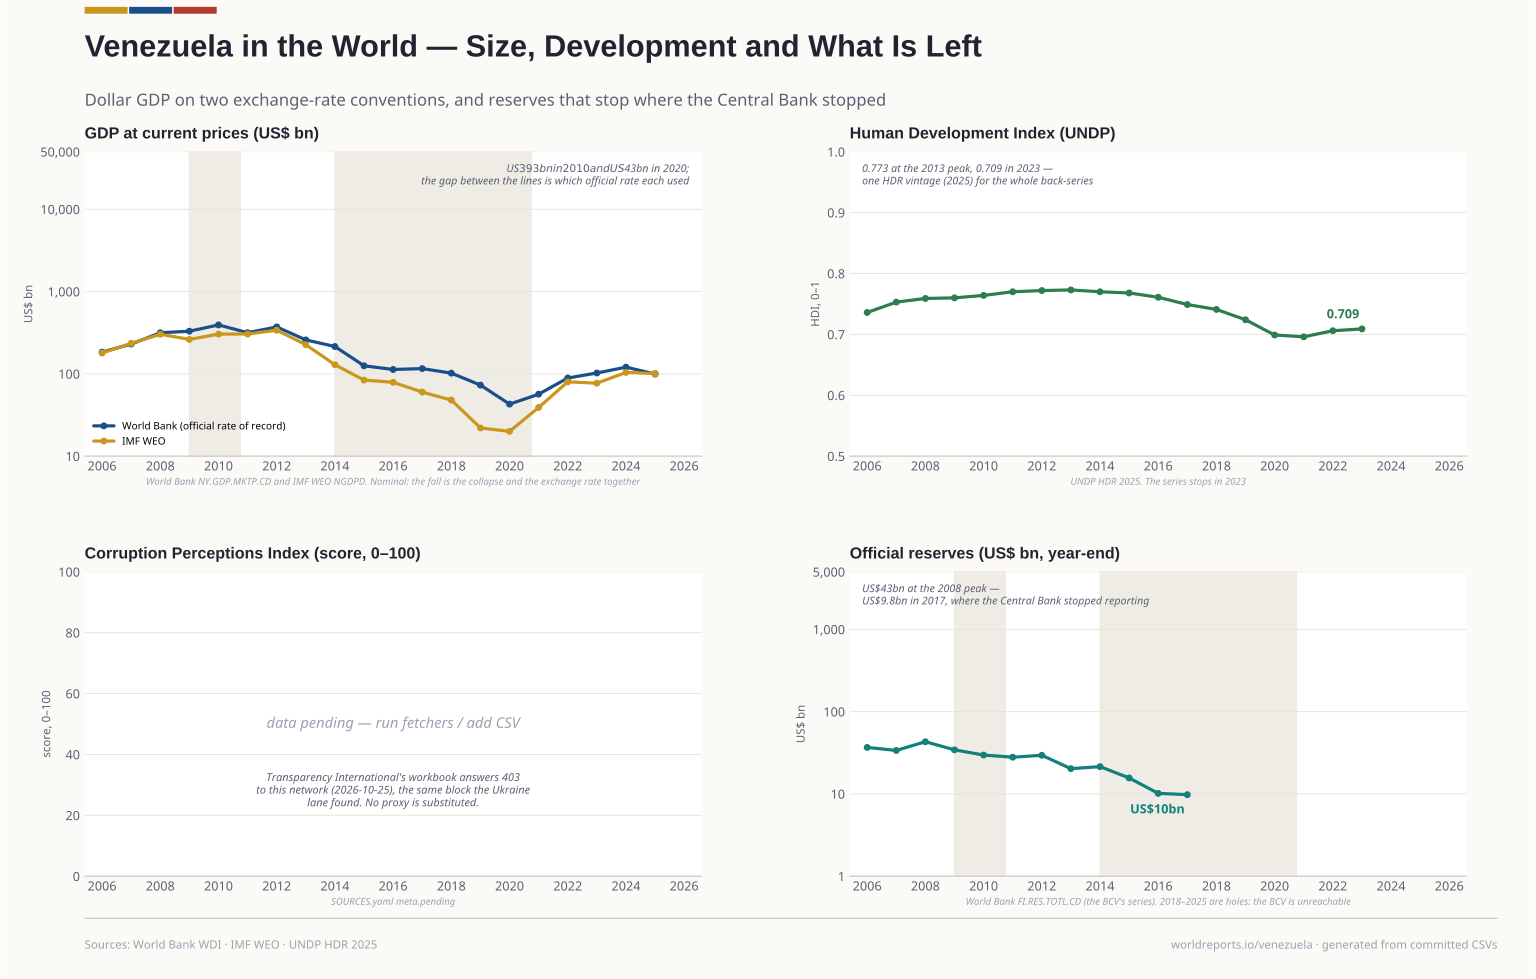
  7. Four panels: GDP in current dollars on a log axis, the World Bank's line and the IMF's; the Human Development Index; a pending corruption index; and reserves on a log axis, ending in 2017. Plate 07

    Venezuela in the World

    Dollar GDP on a log axis, from US$393bn in 2010 to US$100bn in 2025 — and the Fund's line beside it, US$101bn, because the two convert the same bolívar GDP at different official rates. Development fell with it: the HDI is 0.709 in 2023, from 0.773 in 2013.

    View full size Download vector (SVG)
    Drawn from · 3

    The committed files this plate was read from, as recorded while it was drawn.

    • world/gdp_usd.csvWorld Bank WDI NY.GDP.MKTP.CD (canonical) and IMF WEO NGDPD (labelled second line) · 2006-2025
    • world/hdi.csvUNDP Human Development Report 2025 — composite indices, complete time series · 2006-2023
    • world/reserves.csvWorld Bank WDI FI.RES.TOTL.CD · 2006-2017
    20062025
    US$ 100bn GDP, US$ bn 2025
    0.709 Human Development Index 2023
    US$ 10bn Reserves, US$ bn 2017
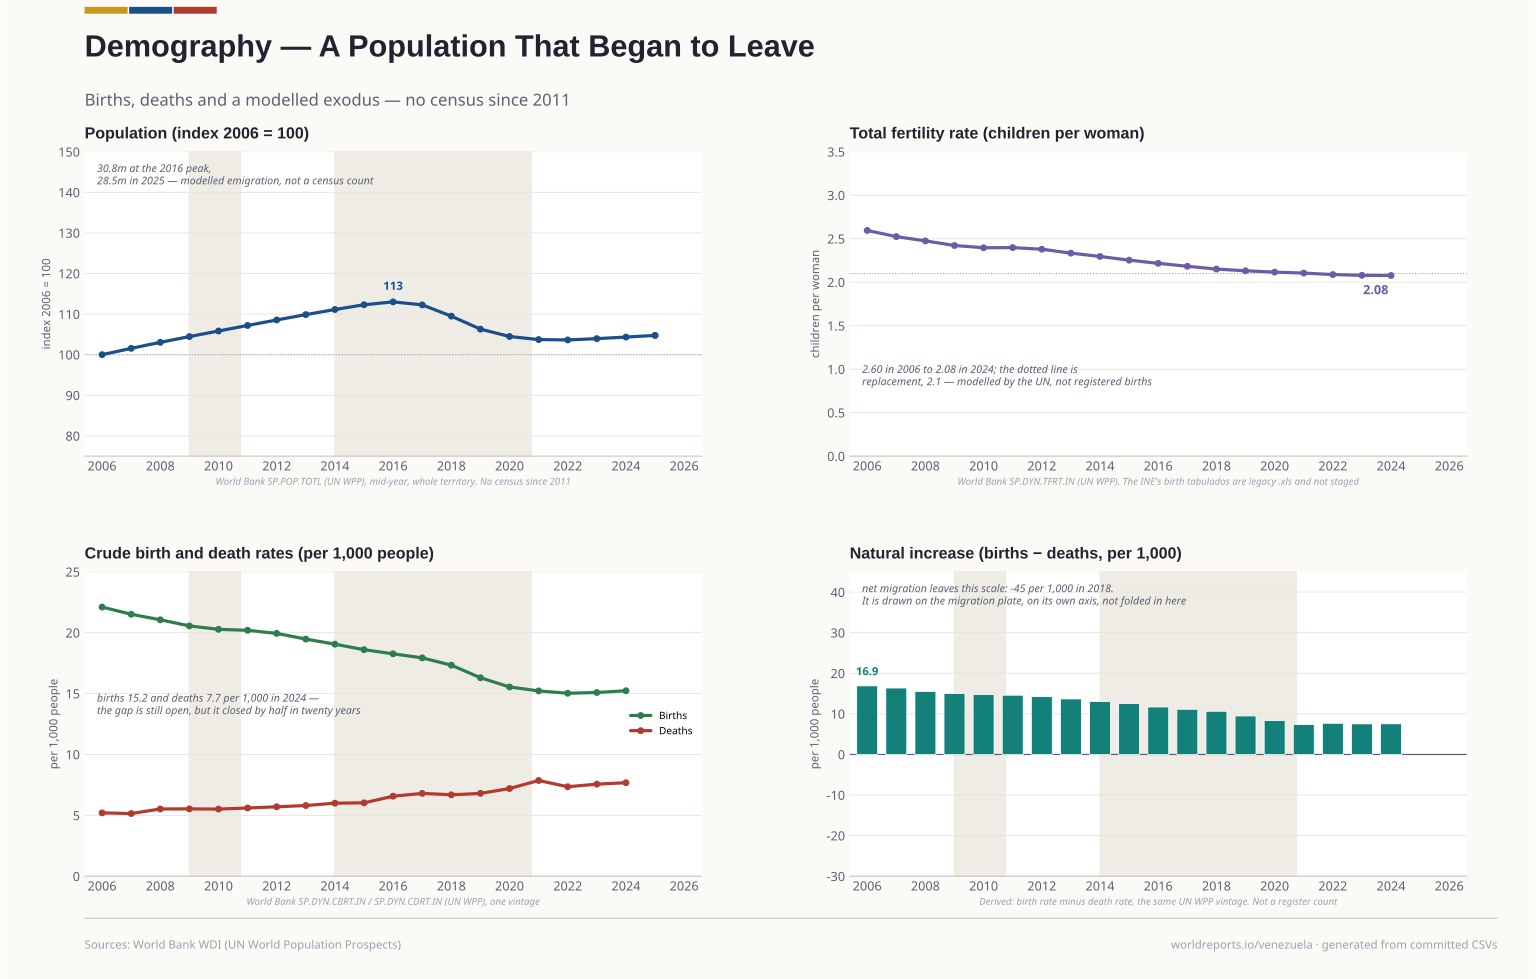
  8. Four panels: the population index peaking in 2016 and settling below it; fertility against the replacement line; crude birth and death rates converging; and natural increase as bars, with net migration left to the migration plate. Plate 08

    Demography

    The UN model peaks at 30.8m in 2016 and settles at 28.5m in 2025; no census has been taken since 2011, so the fall is modelled emigration, not a count. Births nearly halve while deaths creep up, and fertility sits below replacement from the first year of the window.

    View full size Download vector (SVG)
    Drawn from · 2

    The committed files this plate was read from, as recorded while it was drawn.

    20062025
    28.5M Population latest
    2.08 Fertility, children per woman 2024
    7.55 Natural increase, per 1,000 2024
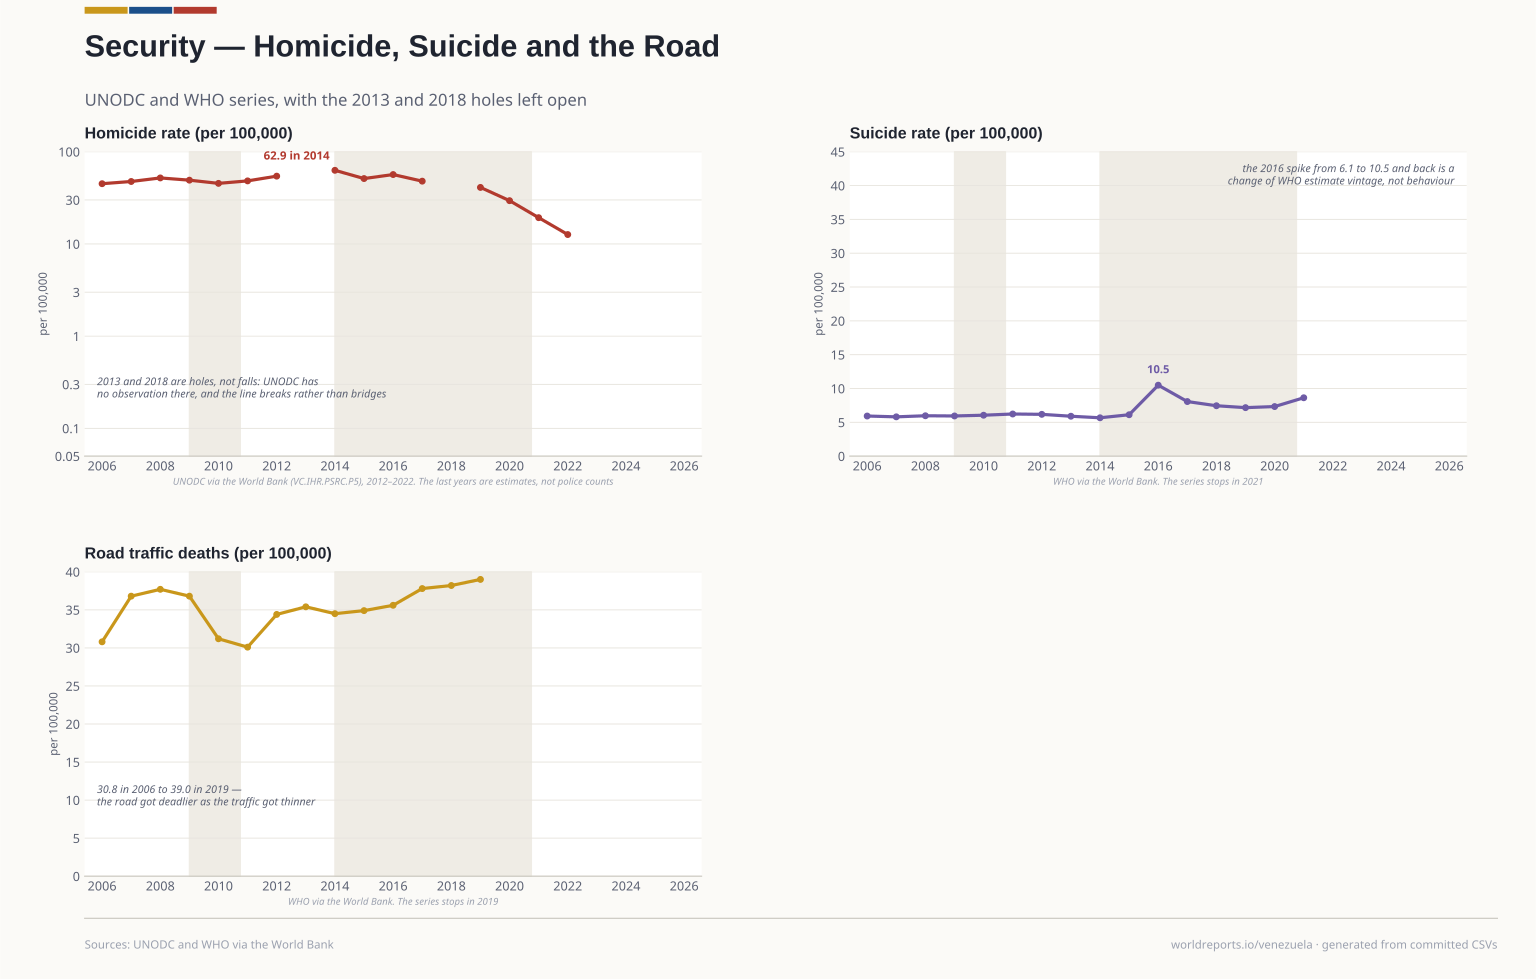
  9. Three panels: the homicide rate on a log axis with the 2013 and 2018 holes left open; the suicide rate with its 2016 estimate spike; and road deaths rising to 2019. Plate 09

    Security

    UNODC puts the homicide peak at 62.9 per 100,000 in 2014 and the last reading at 12.7 in 2022 — an estimate, not a police count, with no observation at all for 2013 and 2018. The suicide spike of 2016 is a change of WHO estimate vintage; road deaths rise as traffic thins.

    View full size Download vector (SVG)
    Drawn from · 1

    The committed files this plate was read from, as recorded while it was drawn.

    • security/security.csvUNODC and WHO via the World Bank — VC.IHR.PSRC.P5, SH.STA.SUIC.P5, SH.STA.TRAF.P5 · 2006-2022
    20062022
    12.7/100k Homicide, per 100,000 2022
    8.6/100k Suicide, per 100,000 2021
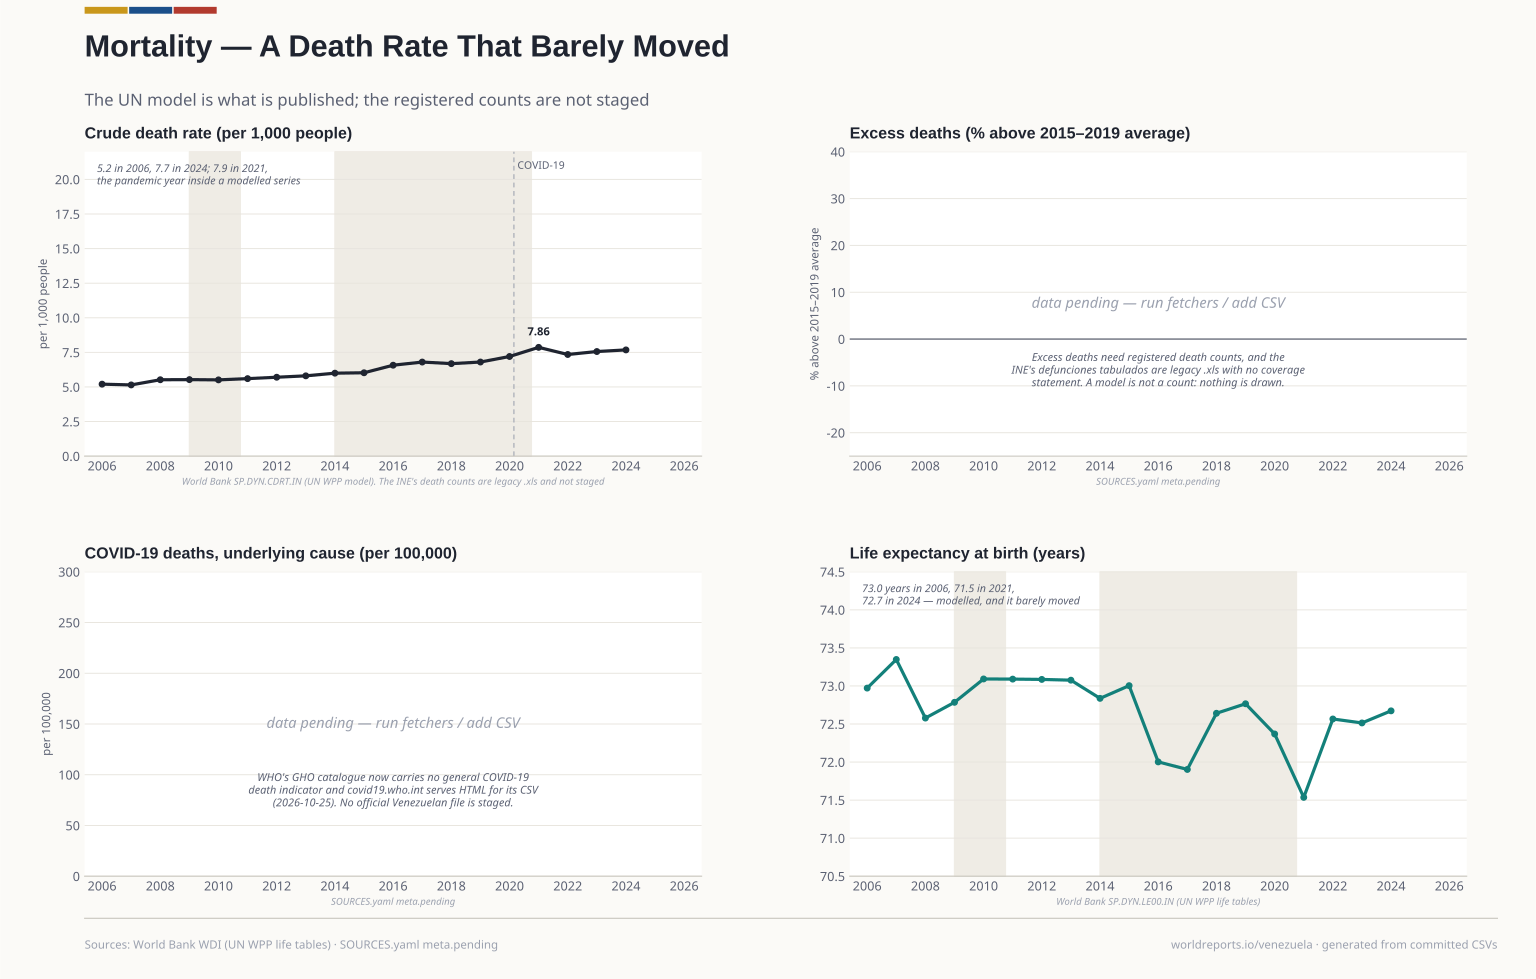
  10. Four panels: the modelled crude death rate rising; pending excess-death and COVID-19 slots with their routes; and life expectancy as a lens, dipping in 2021. Plate 10

    Mortality

    The published death rate is the UN model, not the civil register: 5.2 per 1,000 in 2006, 7.7 in 2024. Life expectancy ends at 72.7 years, half a year below where it started. Excess deaths and COVID-19 stay pending: both need registered death counts, which are legacy .xls files that are not staged.

    View full size Download vector (SVG)
    Drawn from · 1

    The committed files this plate was read from, as recorded while it was drawn.

    • demography/vital.csvWorld Bank WDI SP.DYN.TFRT.IN, SP.DYN.CBRT.IN, SP.DYN.CDRT.IN, SP.DYN.LE00.IN (UN WPP) · 2006-2024
    20062024
    7.68 Deaths per 1,000 2024
    72.7 yrs Life expectancy, years 2024
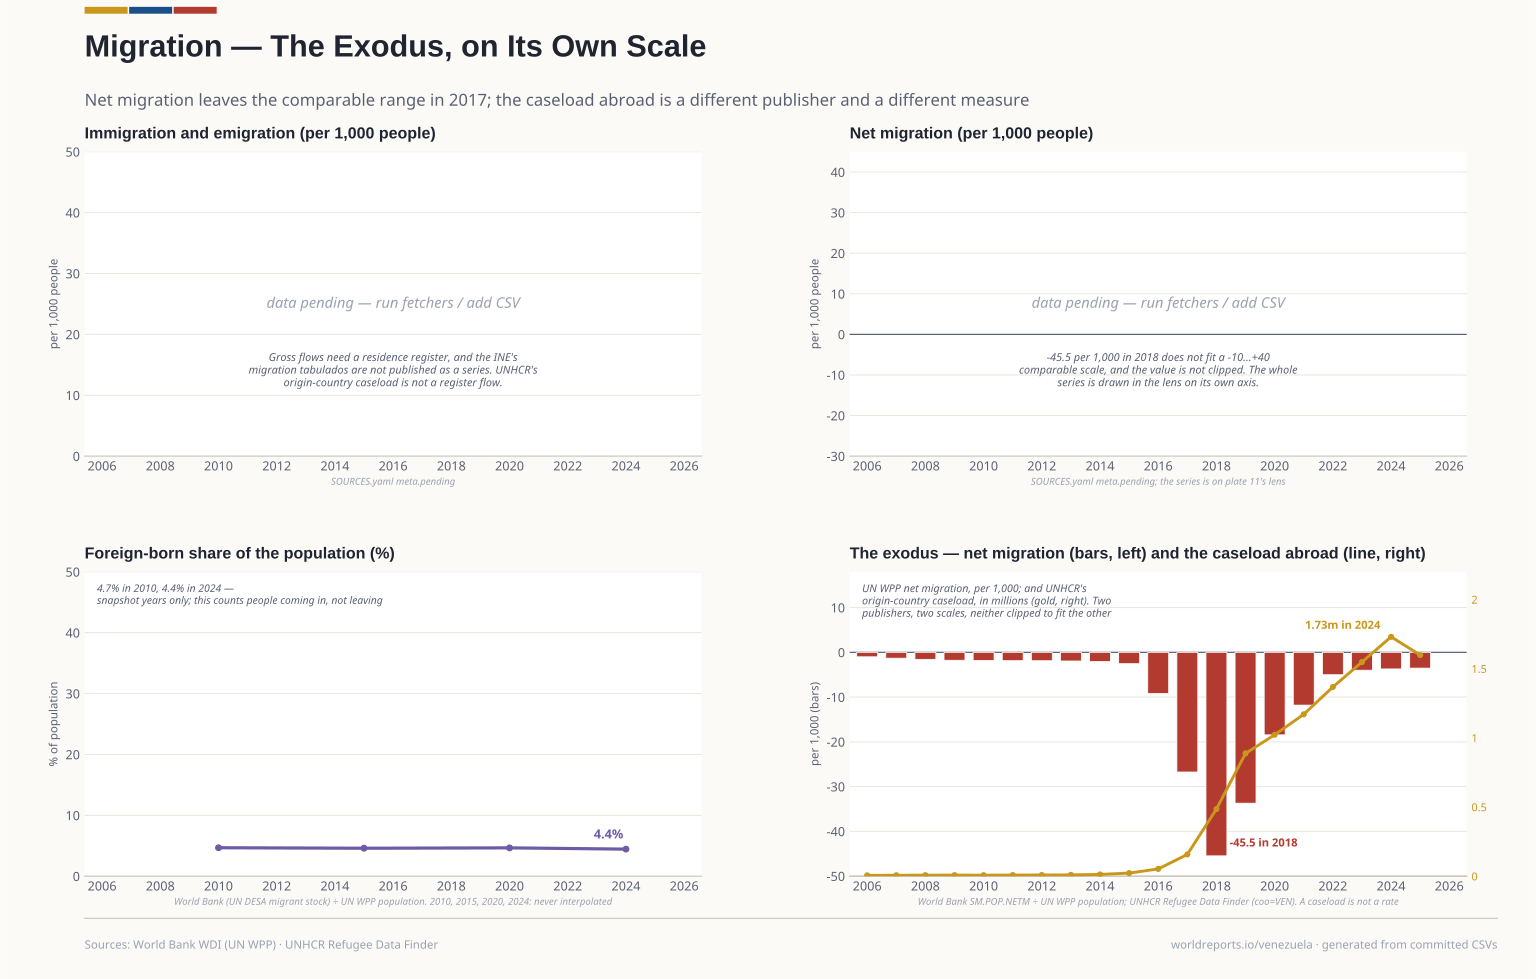
  11. Four panels: pending immigration and emigration flows; a pending net-migration slot; the foreign-born share in snapshot years; and a lens with net migration as bars and UNHCR's caseload abroad as a line on a second axis. Plate 11

    Migration

    Net migration leaves the comparable range in 2017 and reaches -45.5 per 1,000 in 2018, so that slot stays pending and the whole series is drawn in a lens on its own axis. UNHCR's caseload abroad peaks at 1.73 million in 2024: a second publisher, a different measure, drawn on a second axis and never divided by Venezuela's population.

    View full size Download vector (SVG)
    Drawn from · 3

    The committed files this plate was read from, as recorded while it was drawn.

    20062025
    -45.48 Net migration, per 1,000 2018
    1,598,166 Protection status abroad latest
    4.4% Foreign-born share latest