credit/credit_access.csv | The credit card limit is the closest published measure of how much credit households can actually draw on. Utilisation is balance over limit, which… | Federal Reserve Bank of New York — Quarterly Report on Household Debt and Credit, page 10 | 2006-2026 | Official |
|---|
credit/debt_service_from_bis.csv | Interest plus amortisation on household debt as % of household disposable income. A BIS estimate built on an assumed average maturity and the… | BIS — debt service ratios, WS_DSR Q.US.H | 2005-2026 | Other |
|---|
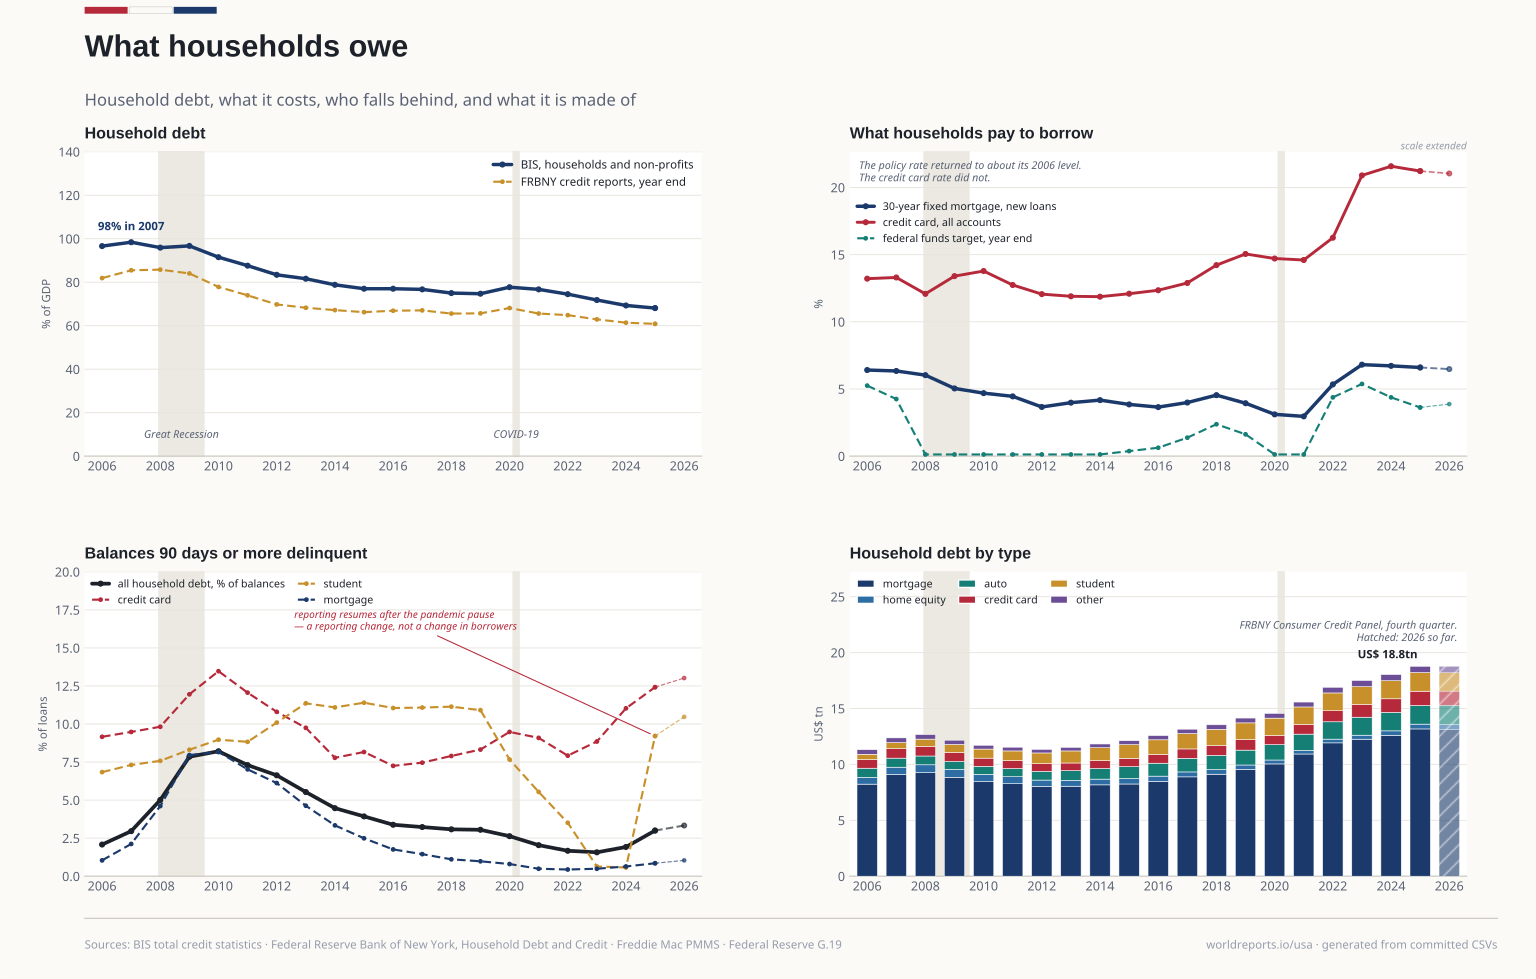
credit/delinquency.csv | Student loan delinquency goes from 0.57% in 2024 to 9.21% in 2025. That is the end of the pandemic credit-reporting pause — a change in what is… | Federal Reserve Bank of New York — Quarterly Report on Household Debt and Credit, page 12 | 2006-2026 | Official |
|---|
credit/household_credit.csv | The curated copy of household_credit_from_bis.csv: credit to households and NPISHs, % of GDP, Q4. Wider than the FRBNY Consumer Credit Panel in… | BIS — total credit statistics, WS_TC Q.US.H.A.M.770.A | 2005-2026 | Other |
|---|
credit/household_credit_from_bis.csv | Credit to households and NPISHs from all sectors, market value, % of GDP, adjusted for breaks. hh_credit_pct_gdp_q4 is the Q4 (year- end) value the… | BIS — total credit statistics, WS_TC Q.US.H.A.M.770.A | 2005-2026 | Other |
|---|
credit/household_debt.csv | Built from the FRBNY Consumer Credit Panel, a 5% anonymised sample of Equifax credit reports. This is NOT the same universe as the Board's Z.1… | Federal Reserve Bank of New York — Quarterly Report on Household Debt and Credit | 2006-2026 | Official |
|---|
credit/rates.csv | | Federal Reserve Board — G.19 Consumer Credit, terms of credit | 2006-2026 | Official |
|---|
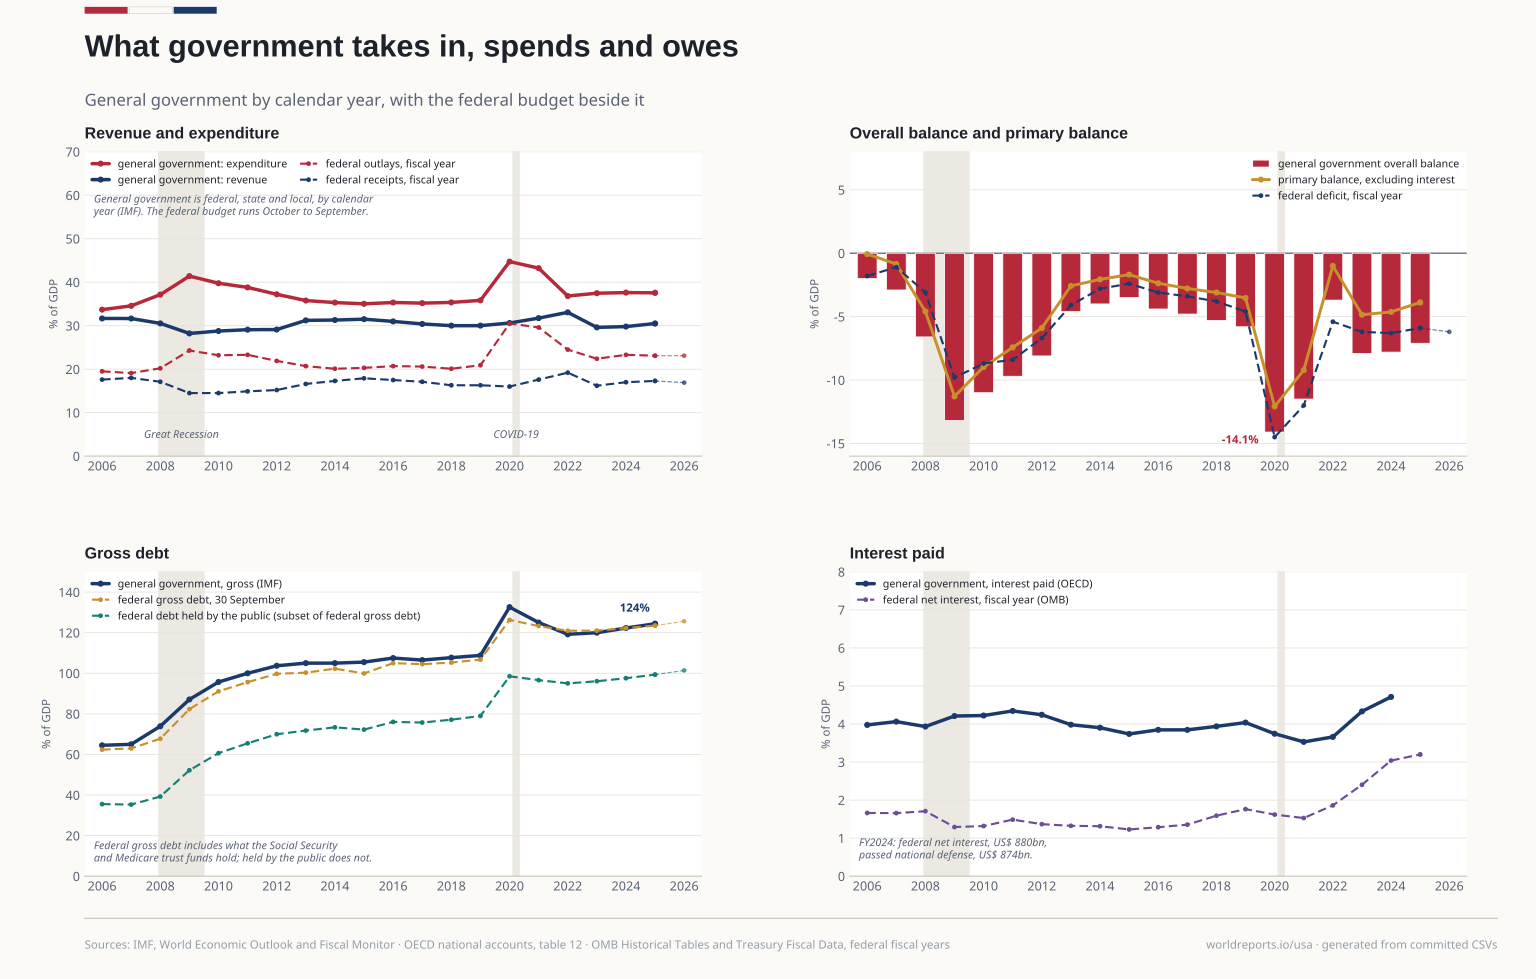
fiscal/budget.csv | ONE publisher per row, recorded in the `source` column. OMB and Treasury do not agree: for FY2019 and FY2021 they are within $2bn, but for FY2020… | OMB Historical Tables 1.1 and 1.2 (FY2027 edition) for FY2006-2025; Treasury Monthly Treasury Statement for FY2026 | — | Official |
|---|
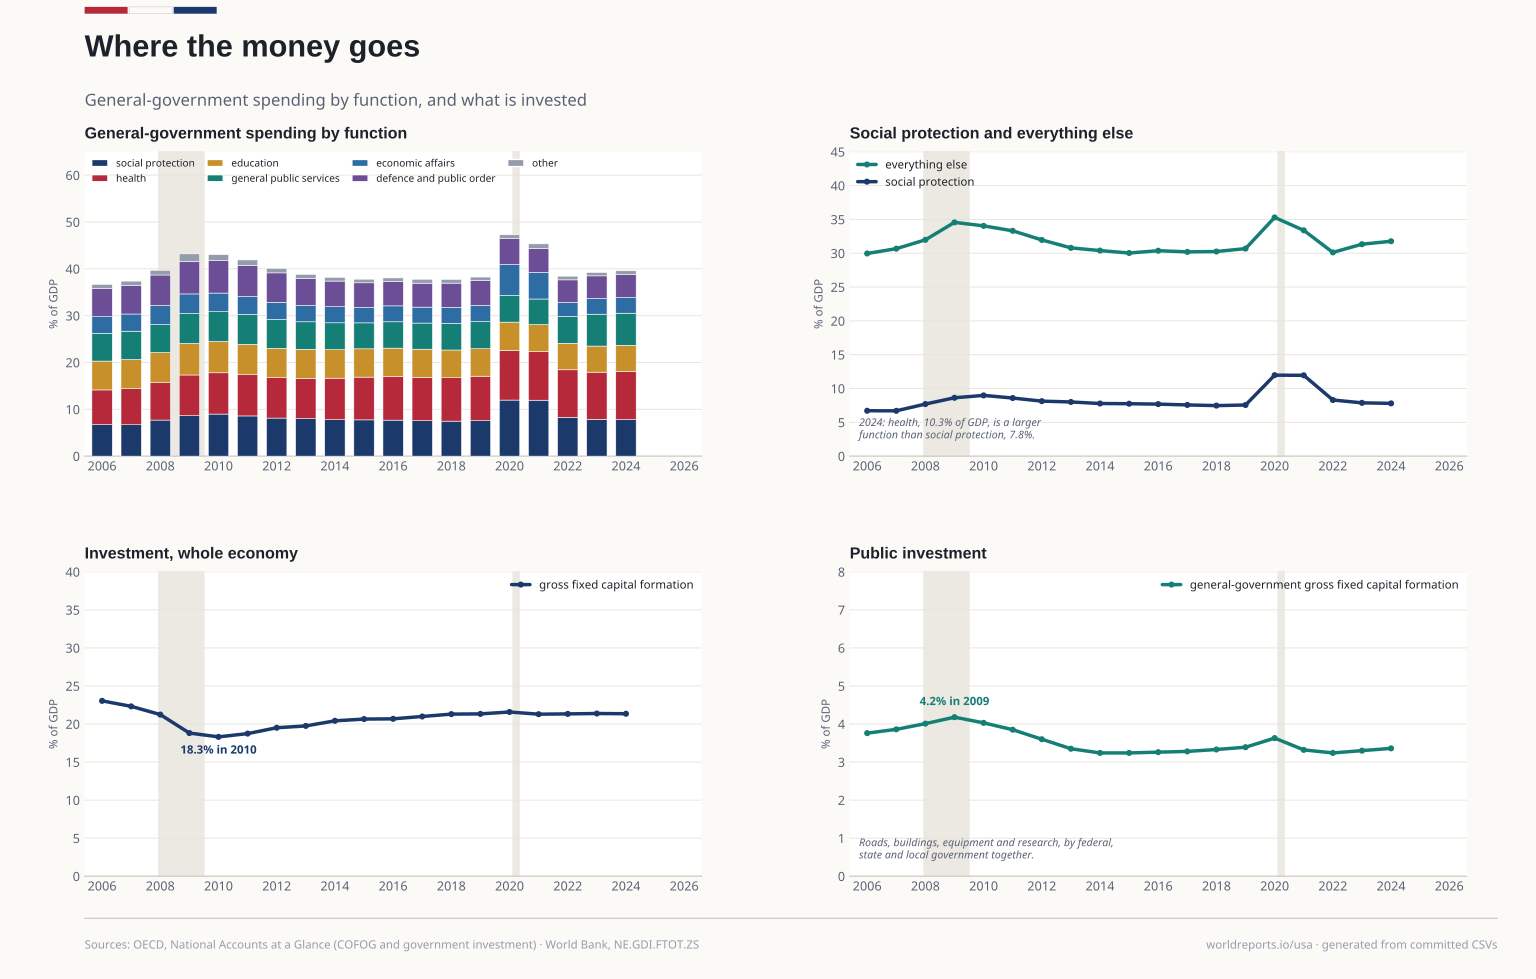
fiscal/cofog.csv | The curated copy of cofog_from_oecd.csv: general-government expenditure by COFOG division, % of GDP. The spine's seven groups are built on the plate… | OECD — National Accounts at a Glance, chapter 6A, OECD.SDD.NAD,DSD_NAAG_VI@DF_NAAG_OTEF, measure OTES13F | 2005-2024 | Other |
|---|
fiscal/cofog_from_oecd.csv | General-government total expenditure by COFOG division, % of GDP (the OECD derives it from table 11, which itself carries only national-currency… | OECD — National Accounts at a Glance, chapter 6A, OECD.SDD.NAD,DSD_NAAG_VI@DF_NAAG_OTEF, measure OTES13F | 2005-2024 | Other |
|---|
fiscal/debt.csv | Read at the last business day of each September, the fiscal year end. Debt held by the public is a SUBSET of gross federal debt — the rest is… | Treasury Fiscal Data — Debt to the Penny | — | Official |
|---|
fiscal/federal_from_api.csv | A CROSS-CHECK ONLY; no plate draws it. This is the national-accounts basis — calendar year and accrual — where the budget is fiscal year and cash… | Bureau of Economic Analysis — NIPA table 3.2, federal government current receipts and expenditures | 2006-2026 | Official |
|---|
fiscal/general_government.csv | The curated copy of general_government_from_imf.csv: general government (federal, state and local), % of GDP, calendar years. This is the spine's… | IMF — World Economic Outlook and Fiscal Monitor, via DataMapper (GGR_G01_GDP_PT, G_X_G01_GDP_PT, GGXCNL_NGDP, GGXONLB_G01_GDP_PT, GGXWDG_NGDP) | 2005-2025 | Other |
|---|
fiscal/general_government_from_imf.csv | General government, % of GDP, calendar years. Balance and gross debt are WEO indicators; revenue, expenditure and the primary balance are not WEO… | IMF — World Economic Outlook and Fiscal Monitor, via DataMapper (GGR_G01_GDP_PT (Fiscal Monitor), G_X_G01_GDP_PT (Fiscal Monitor), GGXCNL_NGDP (WEO), GGXONLB_G01_GDP_PT (Fiscal Monitor), GGXWDG_NGDP (WEO)) | 2005-2025 | Other |
|---|
fiscal/interest.csv | General-government interest payable (SNA D41), US$ millions at current prices; the plate divides by BEA nominal GDP (gdp.csv). It runs 1-2% below… | OECD — annual national accounts, Table 12 (government deficit/surplus, revenue, expenditure), OECD.SDD.NAD,DSD_NASEC10@DF_TABLE12_EXP, S13 D41 payable | 2006-2026 | Other |
|---|
fiscal/interest_from_oecd.csv | Sidecar; curate.py copies it to interest.csv. | OECD — annual national accounts, Table 12, S13 D41 payable | 2006-2026 | Other |
|---|
fiscal/public_investment.csv | The curated copy of public_investment_from_oecd.csv: general- government gross fixed capital formation, % of GDP. | OECD — National Accounts at a Glance, chapter 6, OECD.SDD.NAD,DSD_NAAG_VI@DF_NAAG_VI, measure P51GS13 | 2005-2024 | Other |
|---|
fiscal/public_investment_from_oecd.csv | gov_gfcf_pct_gdp: general-government gross fixed capital formation, % of GDP (spending slot 4). | OECD — National Accounts at a Glance, chapter 6, OECD.SDD.NAD,DSD_NAAG_VI@DF_NAAG_VI, measure P51GS13 | 2005-2024 | Other |
|---|
fiscal/spending.csv | The `estimate` column marks a projected year; those are drawn dashed or hatched and never as actuals. Education, training, employment and social… | OMB Historical Table 3.2 — outlays by function and subfunction (FY2027 edition) | — | Official |
|---|
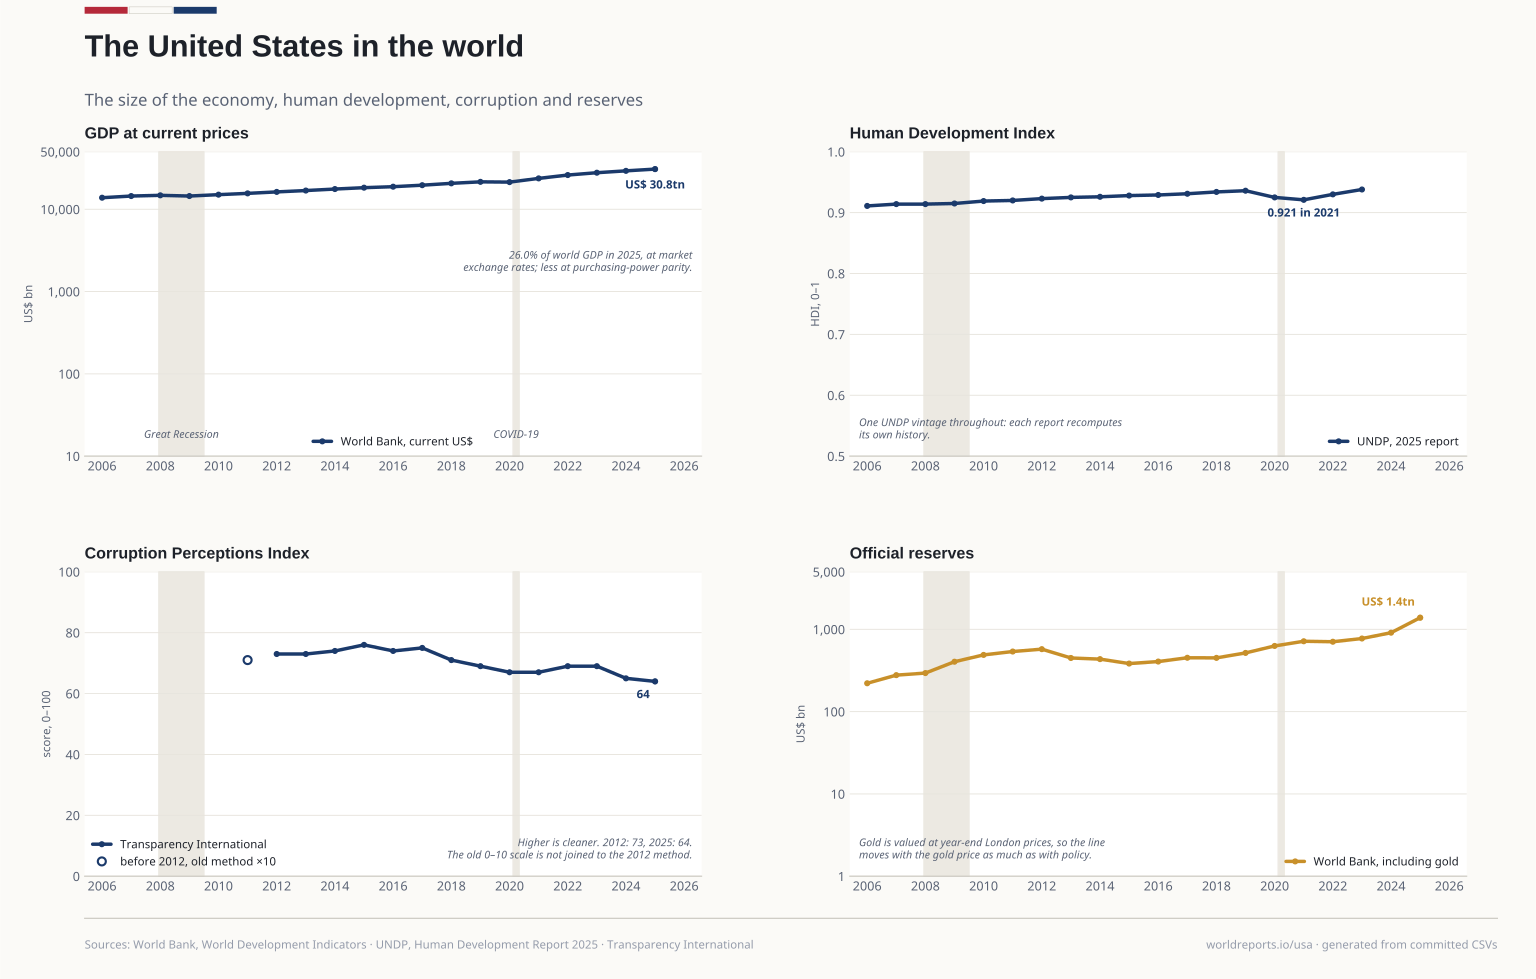
international/corruption.csv | score is the 2012 method, 0-100, the only span TI calls comparable. score_pre2012 is the old 0-10 method as TI published it; only 2011 is fetchable… | Transparency International — Corruption Perceptions Index (CPI 2025 results workbook; CPI 2011 data package) | 2006-2026 | Other |
|---|
international/corruption_from_ti.csv | Sidecar; curate.py copies it to corruption.csv. | Transparency International — Corruption Perceptions Index | 2006-2026 | Other |
|---|
international/world.csv | The curated copy of world_from_wb.csv. Reserves include gold, which the World Bank values at year-end London prices, so the line moves with the gold… | World Bank — World Development Indicators (NY.GDP.PCAP.CD, FI.RES.TOTL.CD) | 2005-2025 | Other |
|---|
international/world_from_wb.csv | Current US$: GDP, GDP per person, and total reserves including gold (year-end, IMF IFS via the WDI). A harmonised cross-country series for the world… | World Bank — World Development Indicators (NY.GDP.PCAP.CD, FI.RES.TOTL.CD) | 2005-2025 | Other |
|---|
international/worldbank.csv | Kept only where the authoritative publisher is an international body or where the point of the measure is the comparison. Where a US agency publishes… | World Bank — World Development Indicators | 2006-2026 | Official |
|---|
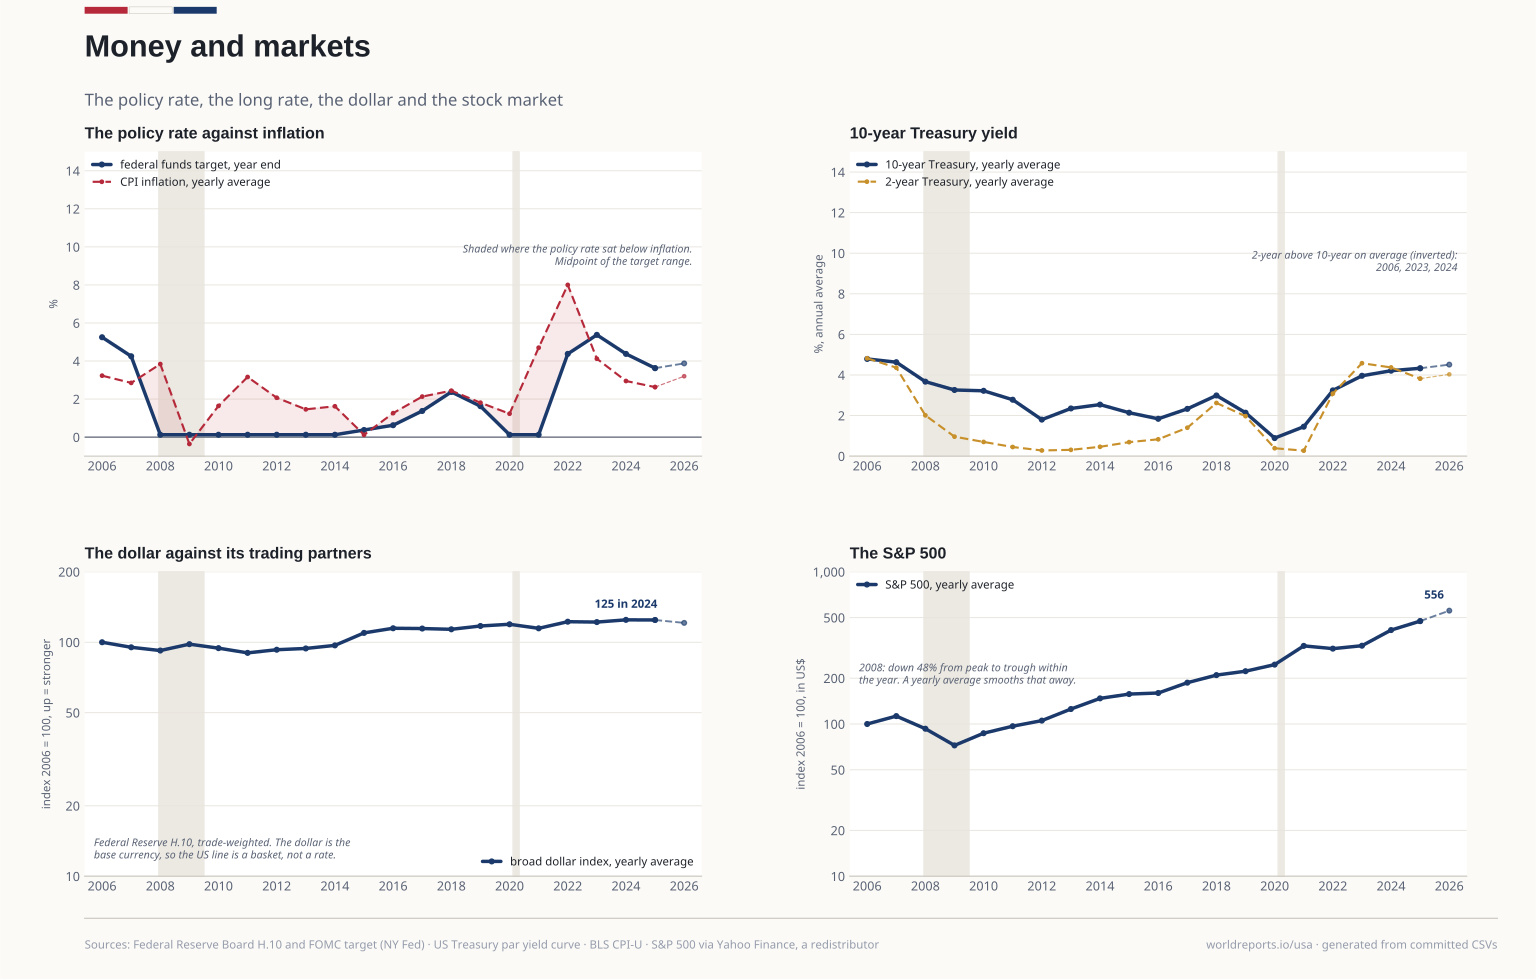
macro/cpi.csv | The annual index is BLS's own M13 annual average where it is published, otherwise the mean of the published months. December 2025 carries no October… | Bureau of Labor Statistics — CPI-U, series CUUR0000SA0 and CUUR0000SA0L1E | 2006-2026 | Official |
|---|
macro/dollar.csv | Based at JANUARY 2006 = 100, which is the first month of this atlas. broad_index_dec is December specifically, not the latest month: a part year has… | Federal Reserve Board — H.10, broad nominal dollar index | 2006-2026 | Official |
|---|
macro/economy_from_wb.csv | gfcf_pct_gdp is whole-economy gross fixed capital formation, % of GDP (spending slot 3). unemployment_pct is the ILO modelled estimate, % of the… | World Bank — World Development Indicators (NE.GDI.FTOT.ZS, SL.UEM.TOTL.ZS) | 2005-2025 | Other |
|---|
macro/economy_wdi.csv | The curated copy of economy_from_wb.csv. gfcf_pct_gdp, whole-economy gross fixed capital formation % of GDP, is the spine's investment rate (spending… | World Bank — World Development Indicators (NE.GDI.FTOT.ZS, SL.UEM.TOTL.ZS) | 2005-2025 | Other |
|---|
macro/fed_funds.csv | The TARGET is the policy series and the average is the market one. effr_last is kept but never used as a headline: EFFR can dislocate on the final… | Federal Reserve Bank of New York — effective federal funds rate and the FOMC target | 2006-2026 | Official |
|---|
macro/gdp.csv | nominal_usdbn is A191RC, real_growth A191RL, gdp_per_capita_usd A939RC and population_mn B230RC. Current-dollar quarterly NIPA series are SEASONALLY… | Bureau of Economic Analysis — NIPA tables 1.1.1, 1.1.5, 7.1 | 2006-2026 | Official |
|---|
macro/mortgage.csv | Freddie Mac is a government-sponsored enterprise under FHFA conservatorship, not a federal agency. There is no federal-agency series for the retail… | Freddie Mac — Primary Mortgage Market Survey | 2006-2026 | Official |
|---|
macro/treasury.csv | spread_10y_2y_avg is the average over the year, which says whether the curve was inverted for the year rather than merely on its last day. The… | US Department of the Treasury — daily par yield curve | 2006-2026 | Official |
|---|
macro/unemployment.csv | 2025 has ELEVEN months, not twelve. The October 2025 household survey was never collected because of the 43-day shutdown and BLS says it cannot be… | Bureau of Labor Statistics — Current Population Survey, LNS14000000 (U-3) and LNS13327709 (U-6); CES0000000001 payrolls | 2006-2026 | Official |
|---|
markets/sp500.csv | The ONE series here not taken from the body that produces it. The S&P 500 is private intellectual property, licensed commercially, with no free… | S&P Dow Jones Indices, via Yahoo Finance | 2006-2026 | Official |
|---|
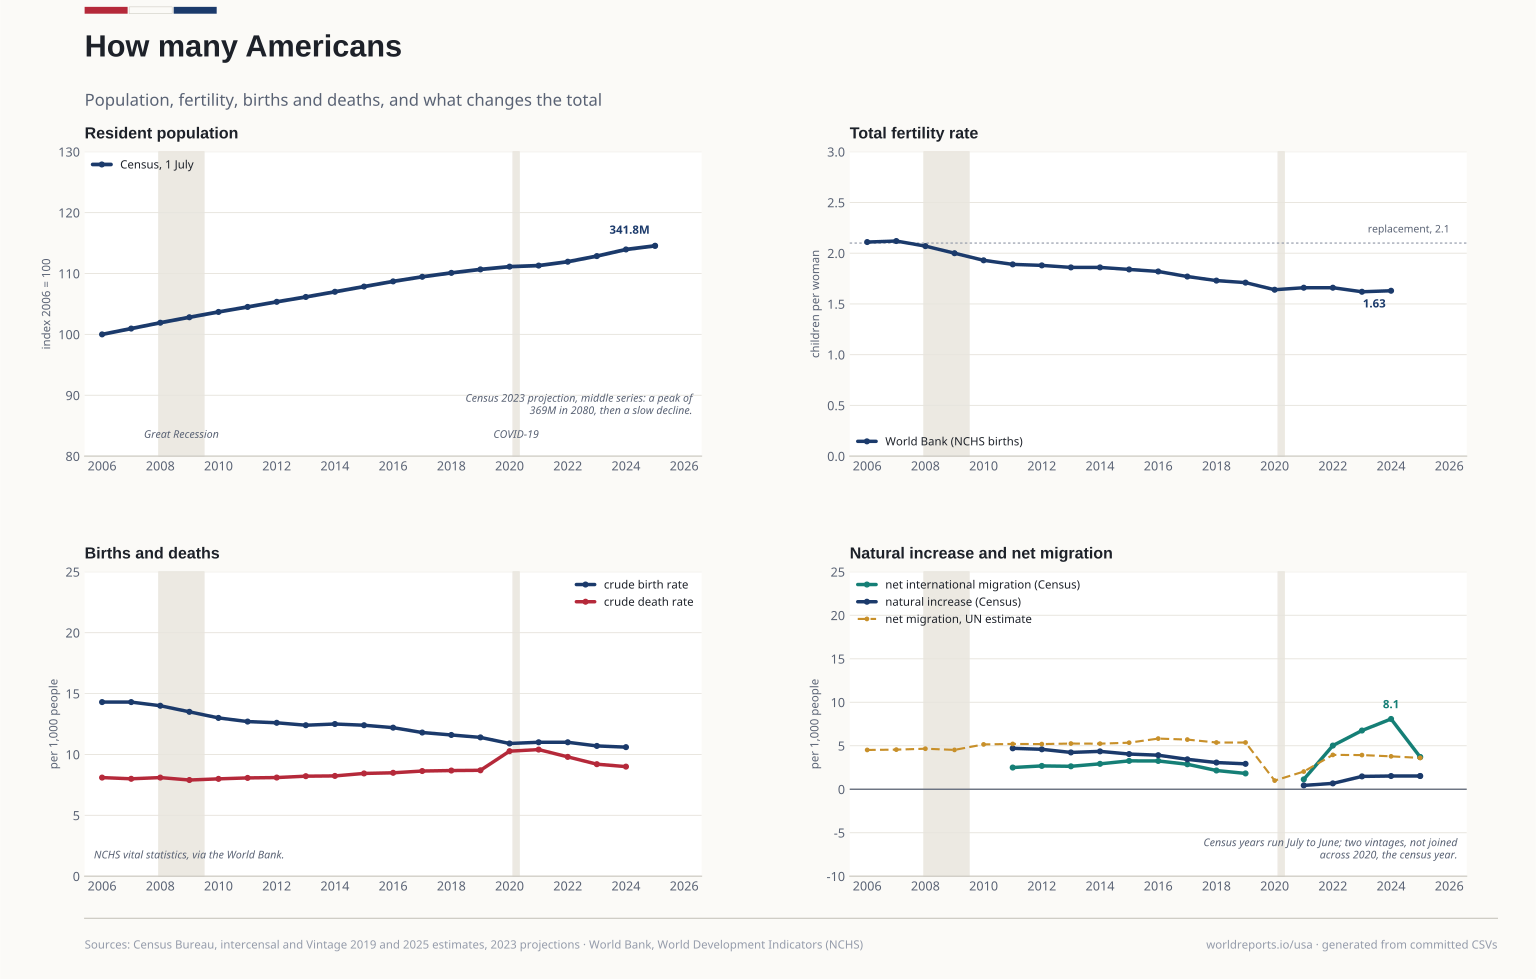
social/components.csv | Rates per 1,000 as the Bureau publishes them, on its July-to-June estimate year (2025 is July 2024 to June 2025). Two vintages, kept apart in the… | Census Bureau — population estimates, components of change, published rates per 1,000 (RBIRTH, RDEATH, RNATURALINC / RNATURALCHG, RNETMIG), Vintages 2019 and 2025 | 2006-2026 | Official |
|---|
social/components_from_census.csv | Sidecar; curate.py copies it to components.csv. | Census Bureau — population estimates, components of change | 2006-2026 | Official |
|---|
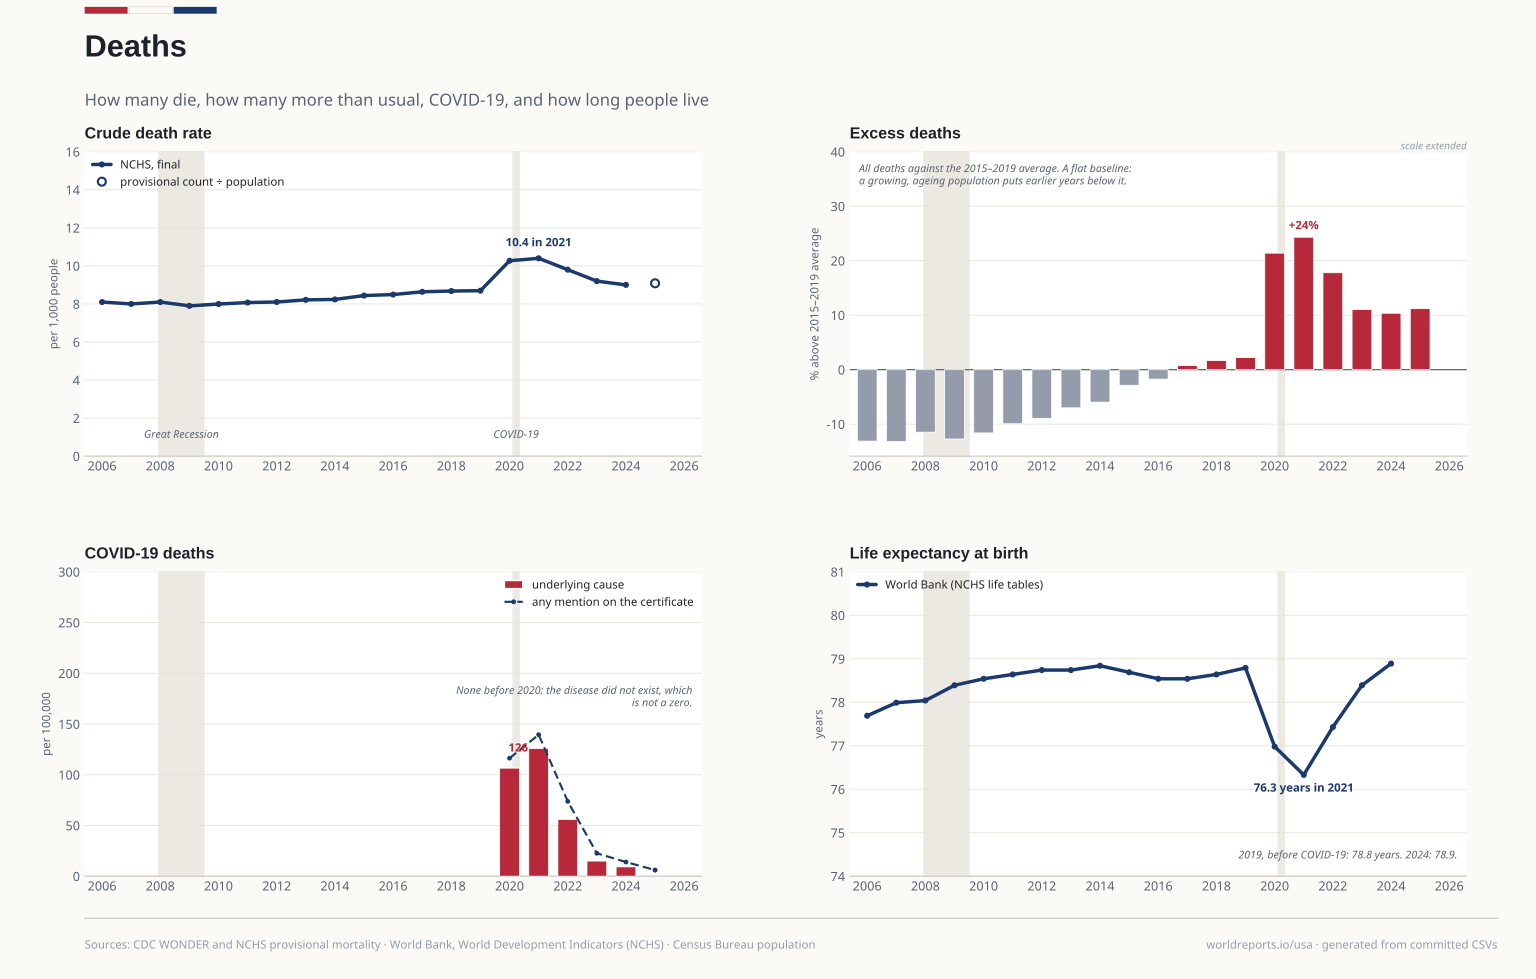
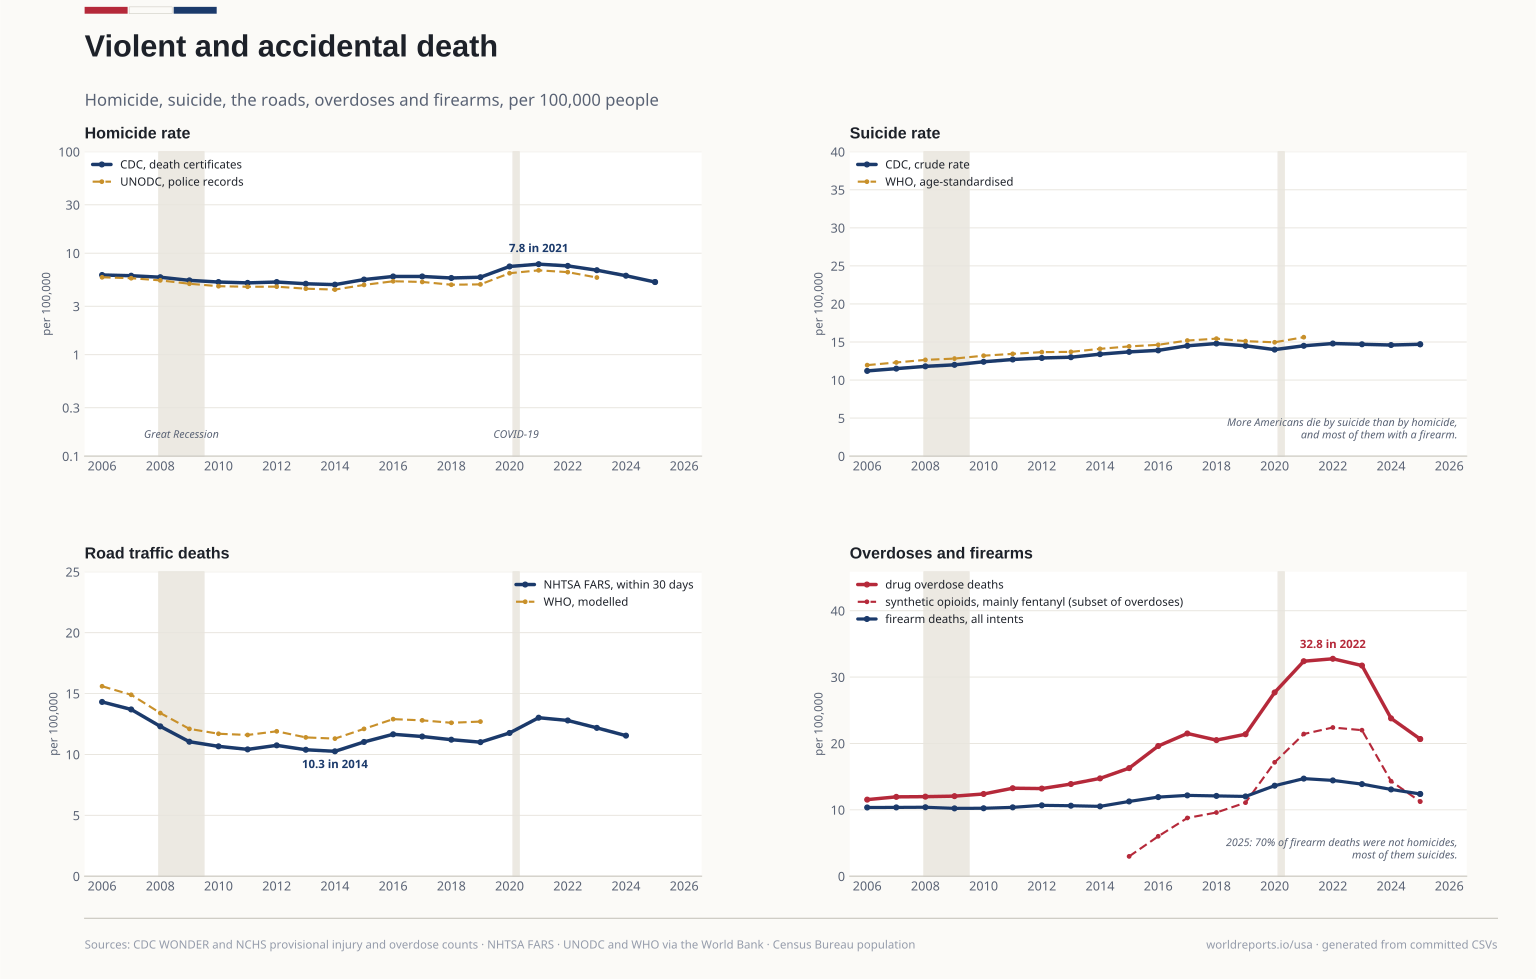
social/death_rates.csv | Published crude rates per 100,000. suicide_rate is WONDER's final rate to 2020 and the provisional dashboard's after (the two agree on 2019 and are… | CDC — WONDER Underlying Cause of Death 1999-2020 (D76); NCHS provisional injury series (t6u2-f84c); Monthly Provisional Counts of Deaths by Select Causes (9dzk-mvmi); VSRR quarterly provisional mortality indicators (489q-934x) | 2006-2026 | Official |
|---|
social/death_rates_from_cdc.csv | Sidecar; curate.py copies it to death_rates.csv. | CDC WONDER and NCHS provisional mortality datasets | 2006-2026 | Official |
|---|
social/demography_from_wb.csv | Mid-year population (total and female), so a rate per 100,000 women can be computed on a mid-year denominator. Crude birth and death rates are per… | World Bank — World Development Indicators (SP.POP.TOTL, SP.POP.TOTL.FE.IN, SP.DYN.CBRT.IN, SP.DYN.CDRT.IN, SM.POP.NETM), from the UN World Population Prospects and national vital statistics | 2005-2025 | Other |
|---|
social/demography_wdi.csv | The curated copy of demography_from_wb.csv. For the United States the crude birth and death rates are the NCHS vital-statistics rates (2019's 8.697… | World Bank — World Development Indicators (SP.POP.TOTL, SP.POP.TOTL.FE.IN, SP.DYN.CBRT.IN, SP.DYN.CDRT.IN, SM.POP.NETM) | 2005-2025 | Other |
|---|
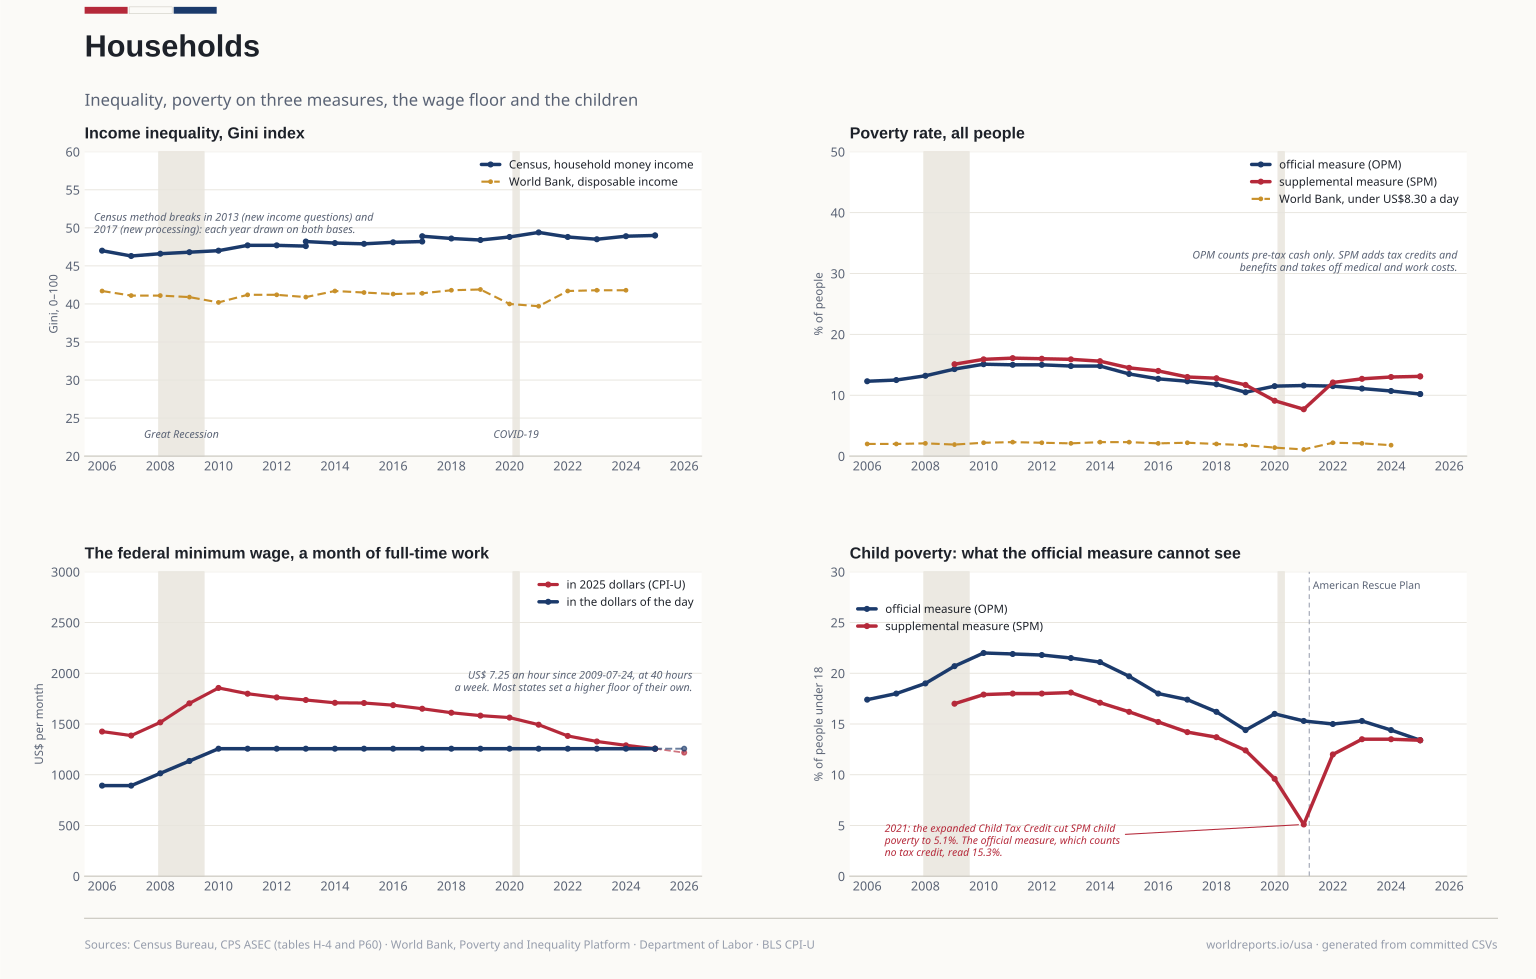
social/gini.csv | Gini x 100. Three columns, one per method, overlapping in the break years: the income questions were redesigned in 2013 and the processing system was… | Census Bureau — CPS ASEC historical income table H-4, Gini index of household money income, all races | 2006-2026 | Official |
|---|
social/gini_from_census.csv | Sidecar; curate.py copies it to gini.csv. | Census Bureau — CPS ASEC table H-4 | 2006-2026 | Official |
|---|
social/hdi.csv | One vintage for the whole series. UNDP recomputes history under the current methodology with each report, so mixing report years produces steps that… | UN Development Programme — Human Development Report 2025, composite indices time series | 2006-2026 | Official |
|---|
social/income.csv | Both dollar bases come from the same table, so the deflator is Census's own. A redesign year is published twice, once on each processing basis; the… | Census Bureau — Current Population Survey ASEC, table H-8 | 2006-2026 | Official |
|---|
social/minimum_wage.csv | Not fetched: DOL publishes effective dates rather than a series, and there are four values across this atlas. Recorded at 1 January and 31 December… | Department of Labor, Wage and Hour Division — history of federal minimum wage rates under the FLSA | 2006-2026 | Official |
|---|
social/mortality.csv | The two files do NOT measure the same thing and are never spliced. WONDER counts the UNDERLYING cause; the provisional file counts deaths that… | CDC WONDER Underlying Cause of Death 1999-2020 (final); CDC provisional COVID-19 death counts (Socrata r8kw-7aab) | 2006-2026 | Official |
|---|
social/population.csv | Growth is only computed WITHIN a vintage. Across the 2019/2020 boundary the jump is the 2020 Census re-basing the estimate upward, not people: it… | Census Bureau — population estimates, vintages 2019 and 2025 | 2006-2026 | Official |
|---|
social/population_july1.csv | One continuous 1 July series, re-anchored on the census at each end, so there is no step at 2020 (the Vintage 2019 estimates in population.csv have… | Census Bureau — resident population on 1 July: intercensal estimates 2000-2010 (us-est00int-tot.csv), intercensal estimates 2010-2020 (nc-est2020int-agesex-res.csv), Vintage 2025 (NST-EST2025-ALLDATA.csv) | 2006-2026 | Official |
|---|
social/population_july1_from_census.csv | Sidecar; curate.py copies it to population_july1.csv. | Census Bureau — intercensal and Vintage 2025 population estimates | 2006-2026 | Official |
|---|
social/poverty.csv | TWO measures, side by side, never spliced. The official measure (OPM) compares pre-tax money income against a threshold set in 1963 and moved only by… | Census Bureau — "Poverty in the United States" P60 report, tables 3 and 8 | 2006-2026 | Official |
|---|
social/poverty_from_wb.csv | poverty_830_pct: share of people below US$8.30 a day, 2021 PPP. Survey years only; the gaps are years without a survey, not zeros. The cross-country… | World Bank — Poverty and Inequality Platform, SI.POV.UMIC | 2005-2024 | Other |
|---|
social/poverty_intl.csv | The curated copy of poverty_from_wb.csv: share of people below US$8.30 a day (2021 PPP), the cross-country line beside the Census measures. | World Bank — Poverty and Inequality Platform, SI.POV.UMIC | 2005-2024 | Other |
|---|
social/projections.csv | A projection, not a measurement. The all-groups row is SEX=0, ORIGIN=0, RACE=0; the file already contains those totals, so summing the group rows… | Census Bureau — 2023 National Population Projections, middle series | 2022-2100 | Official |
|---|
social/road_deaths.csv | Deaths within 30 days of a crash on a public road, the sum of FATALS over each year's accident table. The newest year is NHTSA's Annual Report File… | NHTSA — Fatality Analysis Reporting System, national data files | 2006-2026 | Official |
|---|
social/road_deaths_from_fars.csv | Sidecar; curate.py copies it to road_deaths.csv. | NHTSA — Fatality Analysis Reporting System | 2006-2026 | Official |
|---|
social/security_from_wb.csv | All per 100,000 people. Intentional homicide is UNODC's harmonised count, which usually differs from the national police or death- certificate series… | World Bank — World Development Indicators: VC.IHR.PSRC.P5 (UNODC), SH.STA.SUIC.P5 and SH.STA.TRAF.P5 (WHO Global Health Estimates) | 2005-2023 | Other |
|---|
social/security_intl.csv | The curated copy of security_from_wb.csv, drawn as the harmonised line beside each national series: UNODC homicide (police-recorded, via the FBI)… | World Bank — World Development Indicators: VC.IHR.PSRC.P5 (UNODC), SH.STA.SUIC.P5 and SH.STA.TRAF.P5 (WHO Global Health Estimates) | 2005-2023 | Other |
|---|
social/violence.csv | The seam between final and provisional was MEASURED, not assumed: homicides 2019 final 18,918 against provisional 19,141 (+1.2%) and 2020 24,352… | CDC WONDER Underlying Cause of Death 1999-2020 (final); CDC provisional injury counts (Socrata t6u2-f84c); VSRR provisional overdose counts (Socrata xkb8-kh2a) | 2006-2026 | Official |
|---|
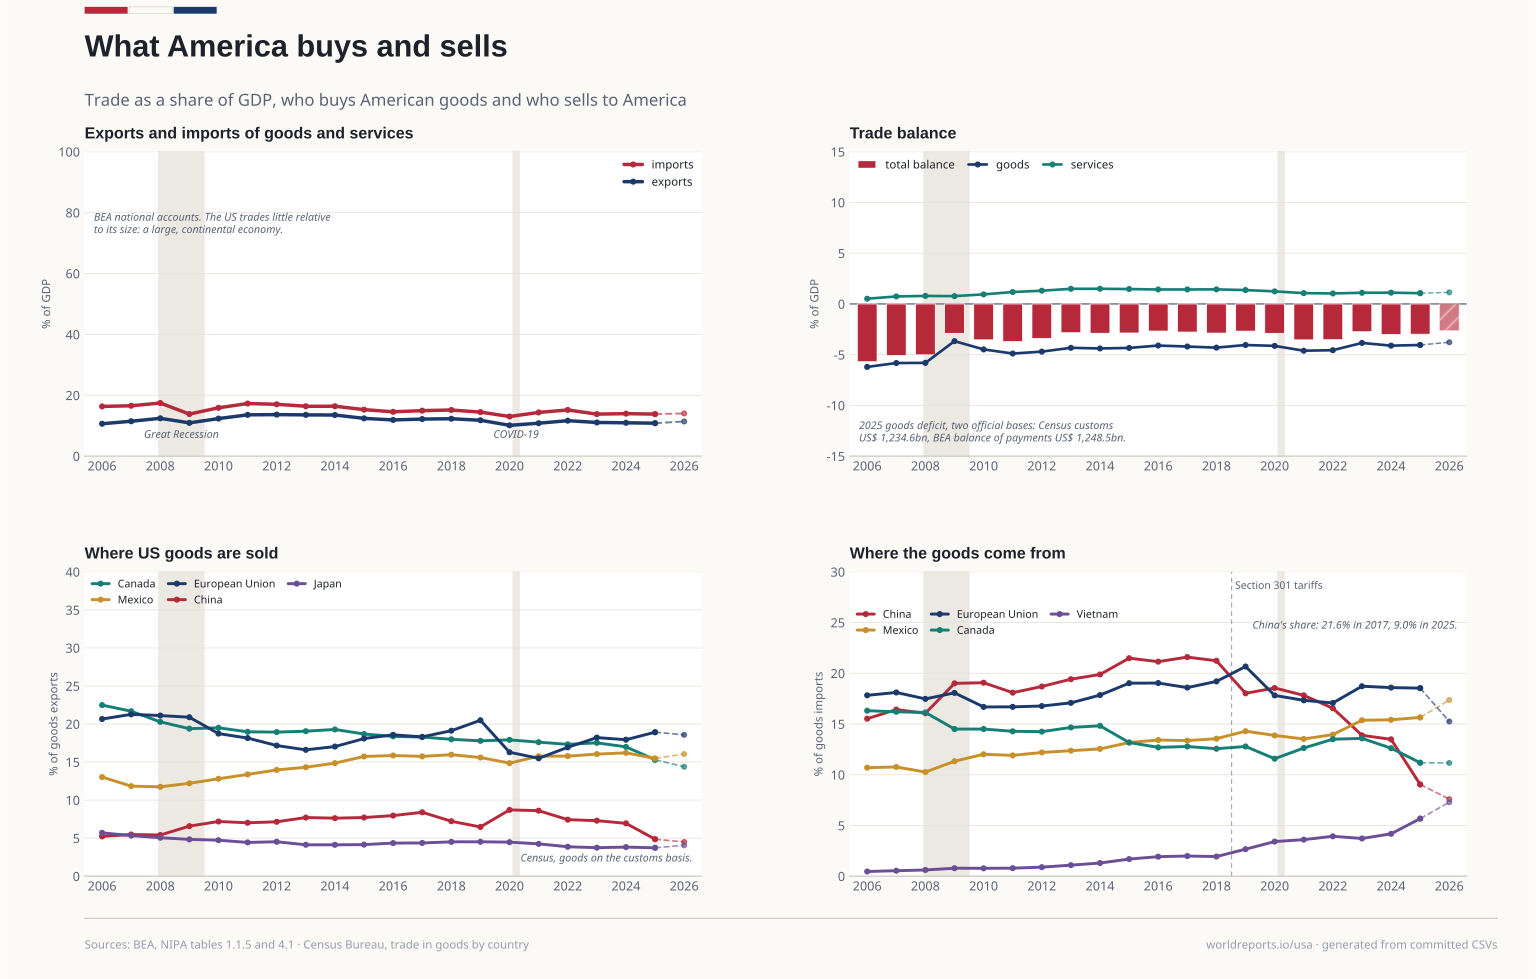
trade/goods.csv | The CENSUS BASIS: goods only, at customs value. This must never be added to or spliced with the BEA figures in trade.csv; for 2024 the two differ by… | Census Bureau — trade in goods by country | 2006-2026 | Official |
|---|
trade/partners.csv | Shares are computed against the Census goods total with BLOCS excluded: Census gives a country group a code beginning with 0, and summing every row… | Census Bureau — trade in goods by country | 2006-2026 | Official |
|---|
trade/trade.csv | Goods AND services, on a balance-of-payments basis. Cross-checked against NIPA table 1.1.5, which agrees exactly on net exports. | Bureau of Economic Analysis — NIPA table 4.1 (goods and services, balance-of-payments basis) | 2006-2026 | Official |
|---|
trade/trade_from_wb.csv | Exports and imports of goods AND services, national-accounts basis, % of GDP — not a customs goods series. The trade balance is their difference and… | World Bank — World Development Indicators (NE.EXP.GNFS.ZS, NE.IMP.GNFS.ZS) | 2005-2024 | Other |
|---|
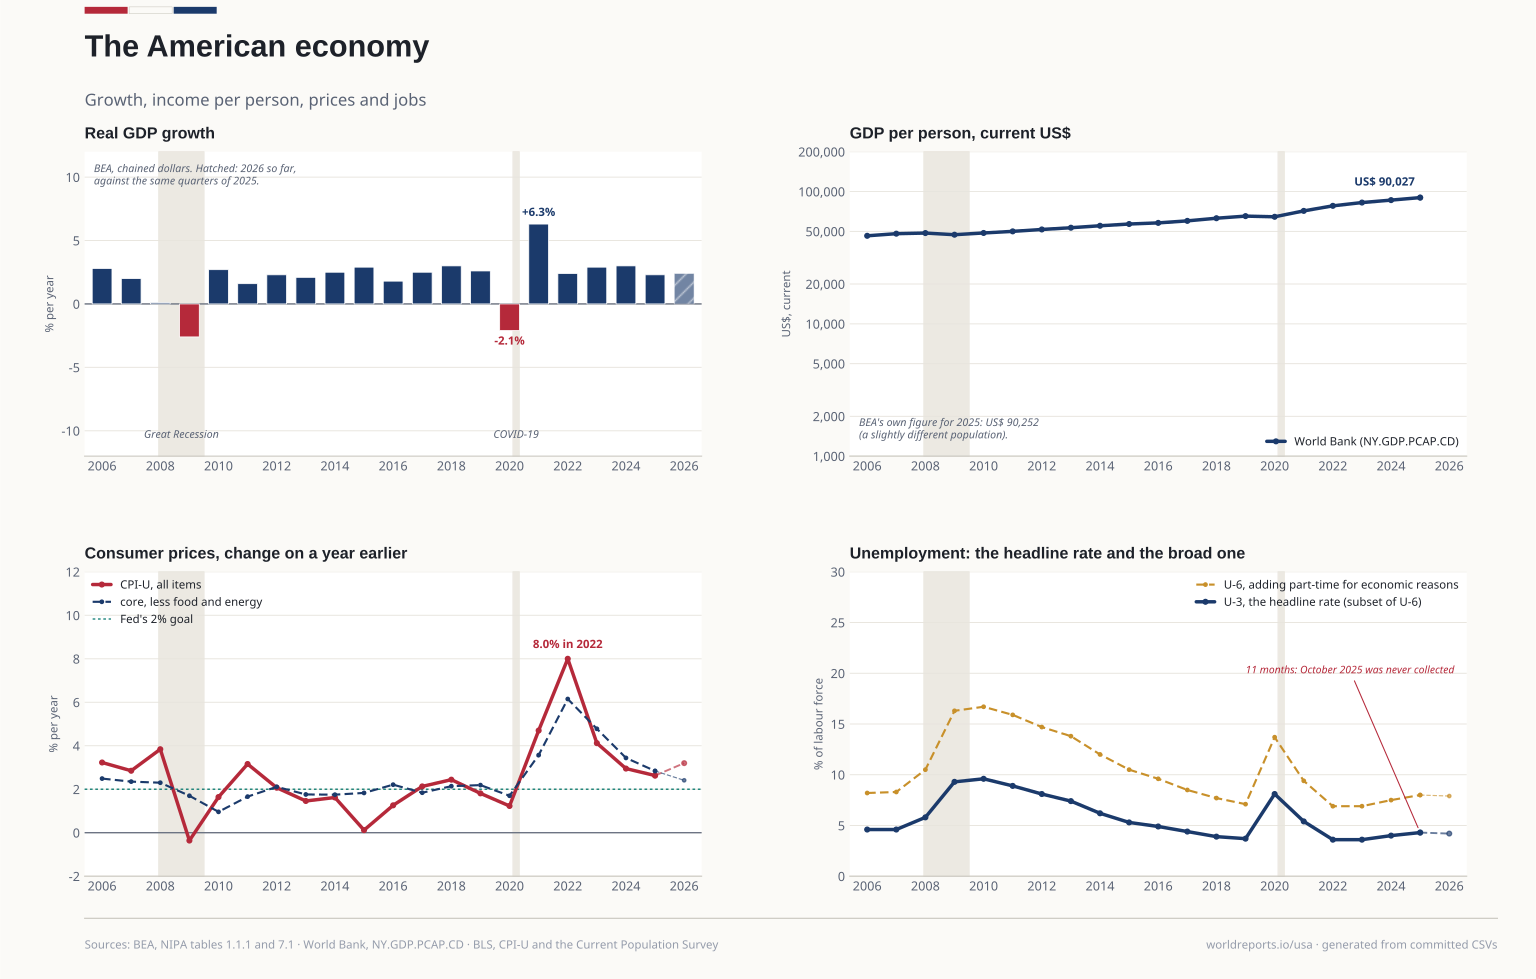 Plate 01