Paraguay

12 plates of official data, 2006-2026

Every figure on this page comes from a publisher that names its definition — the INE for population, poverty and employment, the Ministry of Economy and Finance for the fiscal accounts, UNDP for human development — and from the World Bank and IMF for the harmonised layer. The central bank, which publishes GDP, the CPI, the policy rate and the guaraní's reference rate, answers a Cloudflare challenge to this network: those series are drawn as the Fund and the World Bank record them, and labelled that way. The plates regenerate from committed CSVs, so the charts and the numbers here cannot drift apart.

Where things stand

The plates

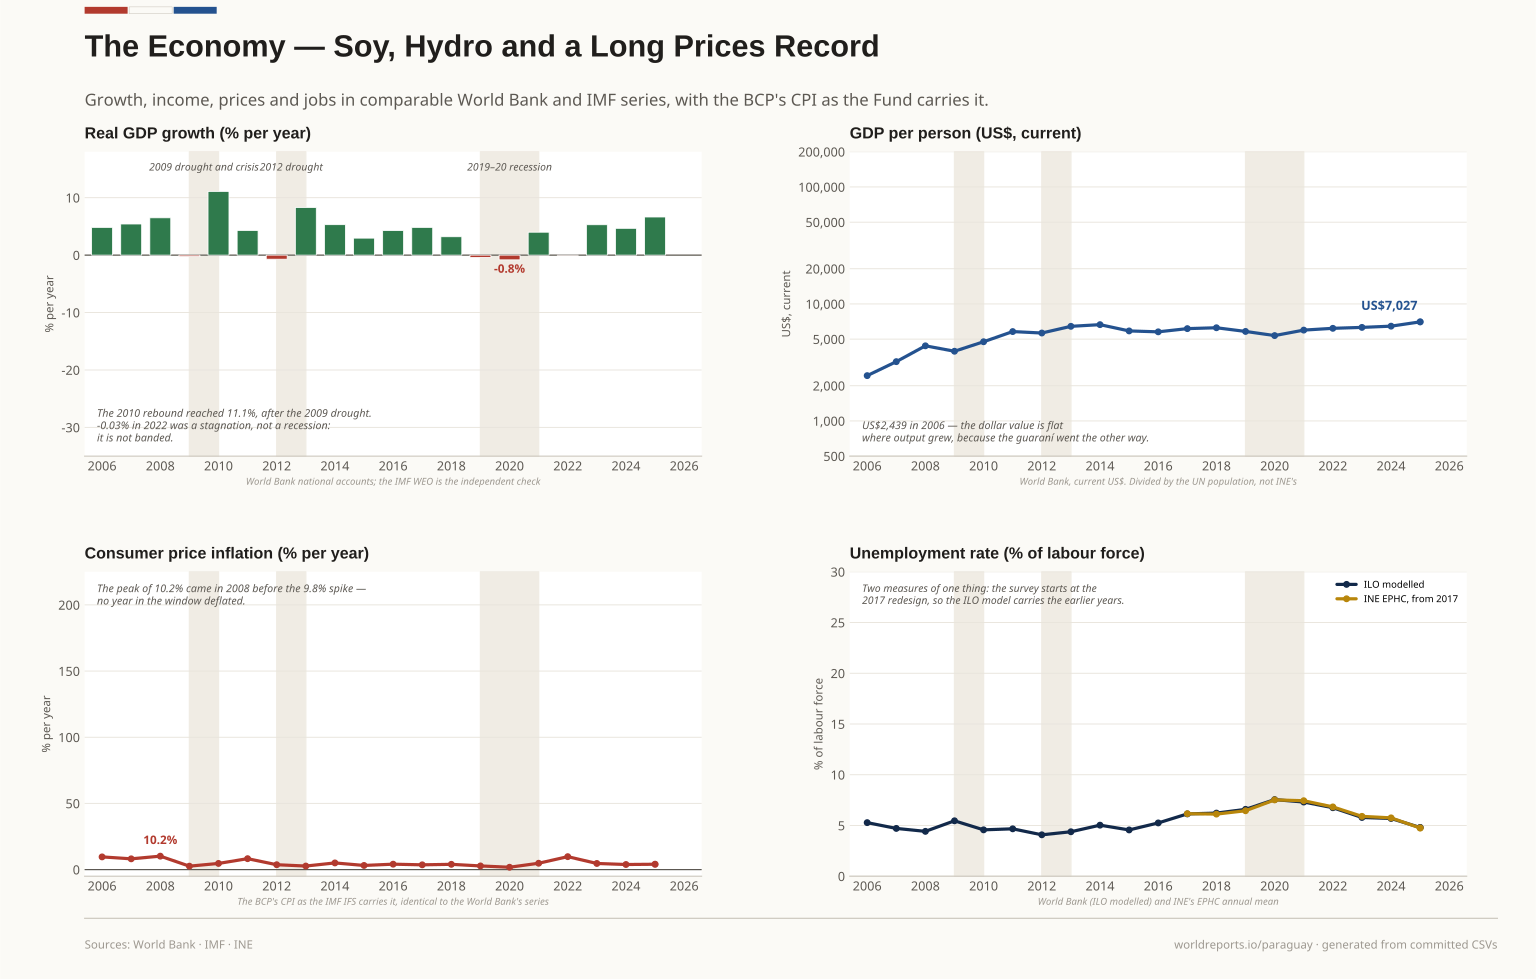
  1. Four panels on Paraguay's economy: real growth with the 2009, 2012 and 2019-20 downturns banded; GDP per person in current dollars; consumer price inflation; and unemployment, the ILO model beside INE's survey from 2017. Plate 01

    The Economy

    Growth, income, prices and jobs in comparable World Bank and IMF series, with the BCP's CPI as the Fund records it.

    View full size Download vector (SVG)
    Show the data
    The figures behind this plate, as committed. Source file: macro/economy.csv
    YearReal GDP, %GDP per person, US$CPI, % year on yearUnemployment, ILO %
    20064.812439.009.595.28
    20075.423212.008.134.71
    20086.504385.0010.154.42
    2009-0.263942.002.595.46
    201011.104751.004.654.57
    20114.295805.008.254.67
    2012-0.715642.003.684.08
    20138.296436.002.684.38
    20145.306652.005.035.03
    20152.965879.003.134.56
    20164.275775.004.095.25
    20174.816152.003.606.14
    20183.206258.003.986.22
    2019-0.405821.002.766.59
    2020-0.825365.001.777.55
    20213.995975.004.797.31
    2022-0.036189.009.776.75
    20235.296303.004.635.79
    20244.676457.003.845.69
    20256.647027.004.044.80
    Drawn from · 1

    The committed files this plate was read from, as recorded while it was drawn.

    • macro/economy.csvWorld Bank WDI (NY.GDP.MKTP.KD.ZG, NY.GDP.PCAP.CD, SL.UEM.TOTL.ZS); IMF IFS (CPI, PRY.CPI._T.YOY_PCH_PA_PT); INE (EPHC unemployment) · 2006-2025
    20062025
    +6.6% Real GDP growth 2025
    4.0% Inflation 2025
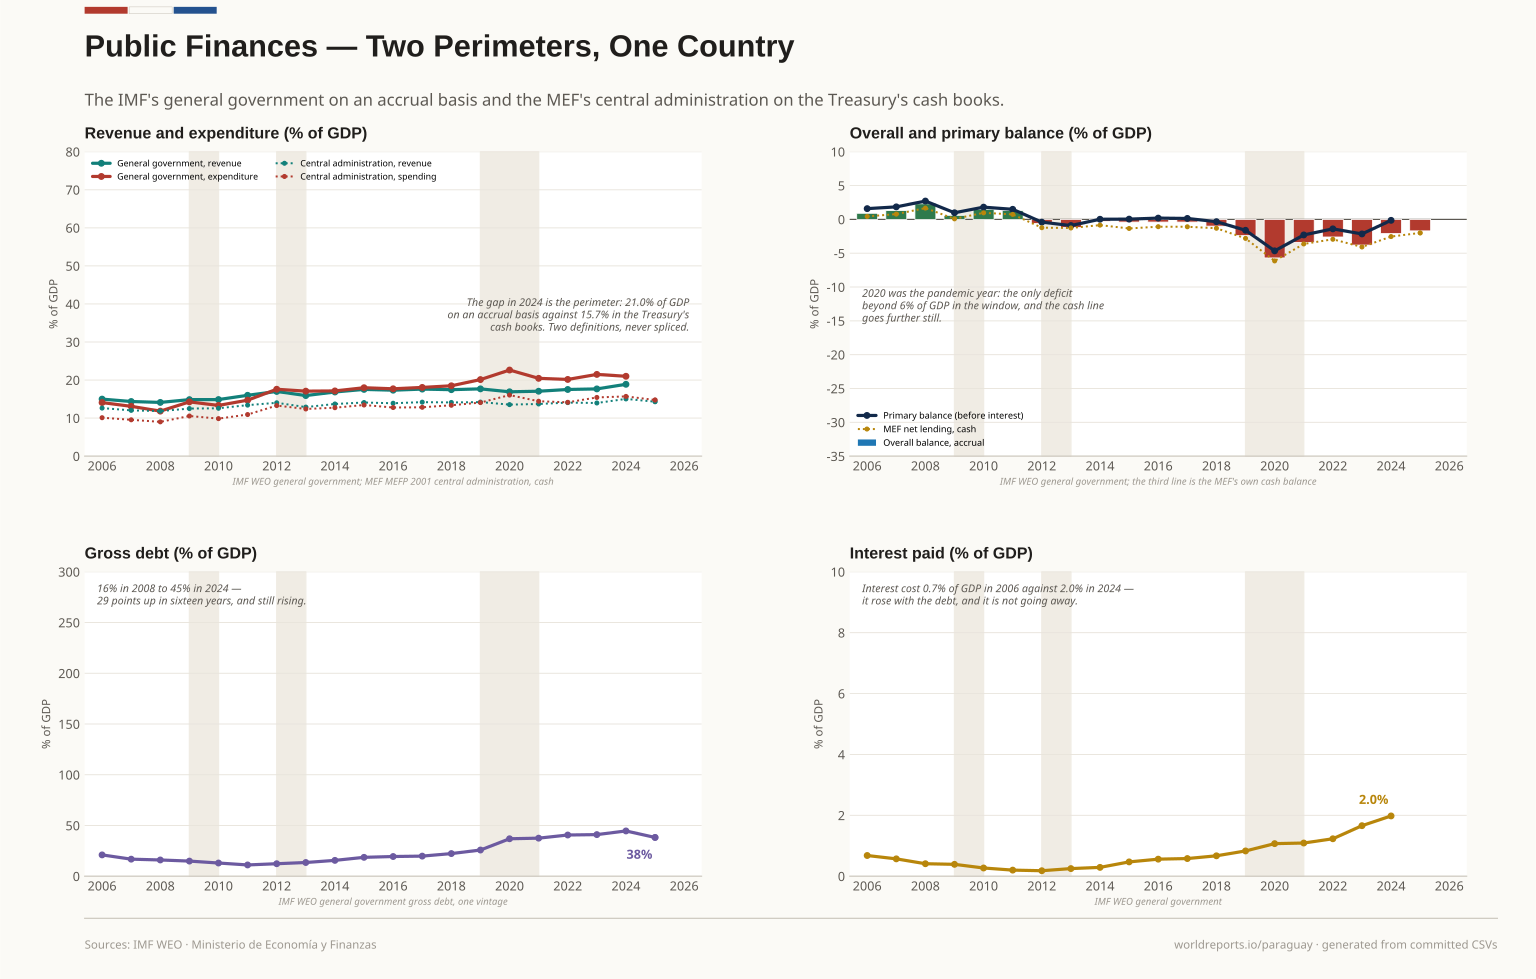
  2. Four panels on Paraguay's public finances: revenue and spending for general government on an accrual basis and for central administration on cash, about four points of GDP apart; the overall and primary balance; gross debt; and interest paid. Plate 02

    Public Finances

    The IMF's general government on an accrual basis and the MEF's central administration on the Treasury's cash books: two perimeters, four points of GDP.

    View full size Download vector (SVG)
    Show the data
    The figures behind this plate, as committed. Source file: fiscal/fiscal.csv
    YearRevenue, % GDPExpenditure, % GDPBalance, % GDPGross debt, % GDP
    200614.9914.080.9021.00
    200714.3613.091.3016.80
    200814.1211.832.3016.00
    200914.8514.260.6014.90
    201014.8713.331.5013.00
    201115.9914.711.3011.10
    201217.0017.58-0.6012.30
    201315.9217.08-1.2013.50
    201416.8617.14-0.3015.60
    201517.5417.98-0.4018.60
    201617.3317.70-0.4019.40
    201717.6218.06-0.4019.80
    201817.4718.49-1.0022.30
    201917.6820.12-2.4025.80
    202016.9122.63-5.7036.90
    202117.0620.45-3.4037.50
    202217.5220.16-2.6040.60
    202317.6721.48-3.8041.00
    202418.8820.99-2.1044.60
    2025-1.7038.20
    Drawn from · 2

    The committed files this plate was read from, as recorded while it was drawn.

    • fiscal/fiscal.csvIMF WEO (October 2026 vintage), general government — rev, exp, GGXCNL_NGDP, pb, ie, GGXWDG_NGDP · 2006-2025
    • fiscal/fiscal_national.csvMinisterio de Economía y Finanzas (Paraguay) — 'MEFP 2001 Administración Central 2003-2025 serie anual' · 2003-2025
    20062025
    -1.7% GDP Overall balance 2025
    38.2% GDP Gross debt latest
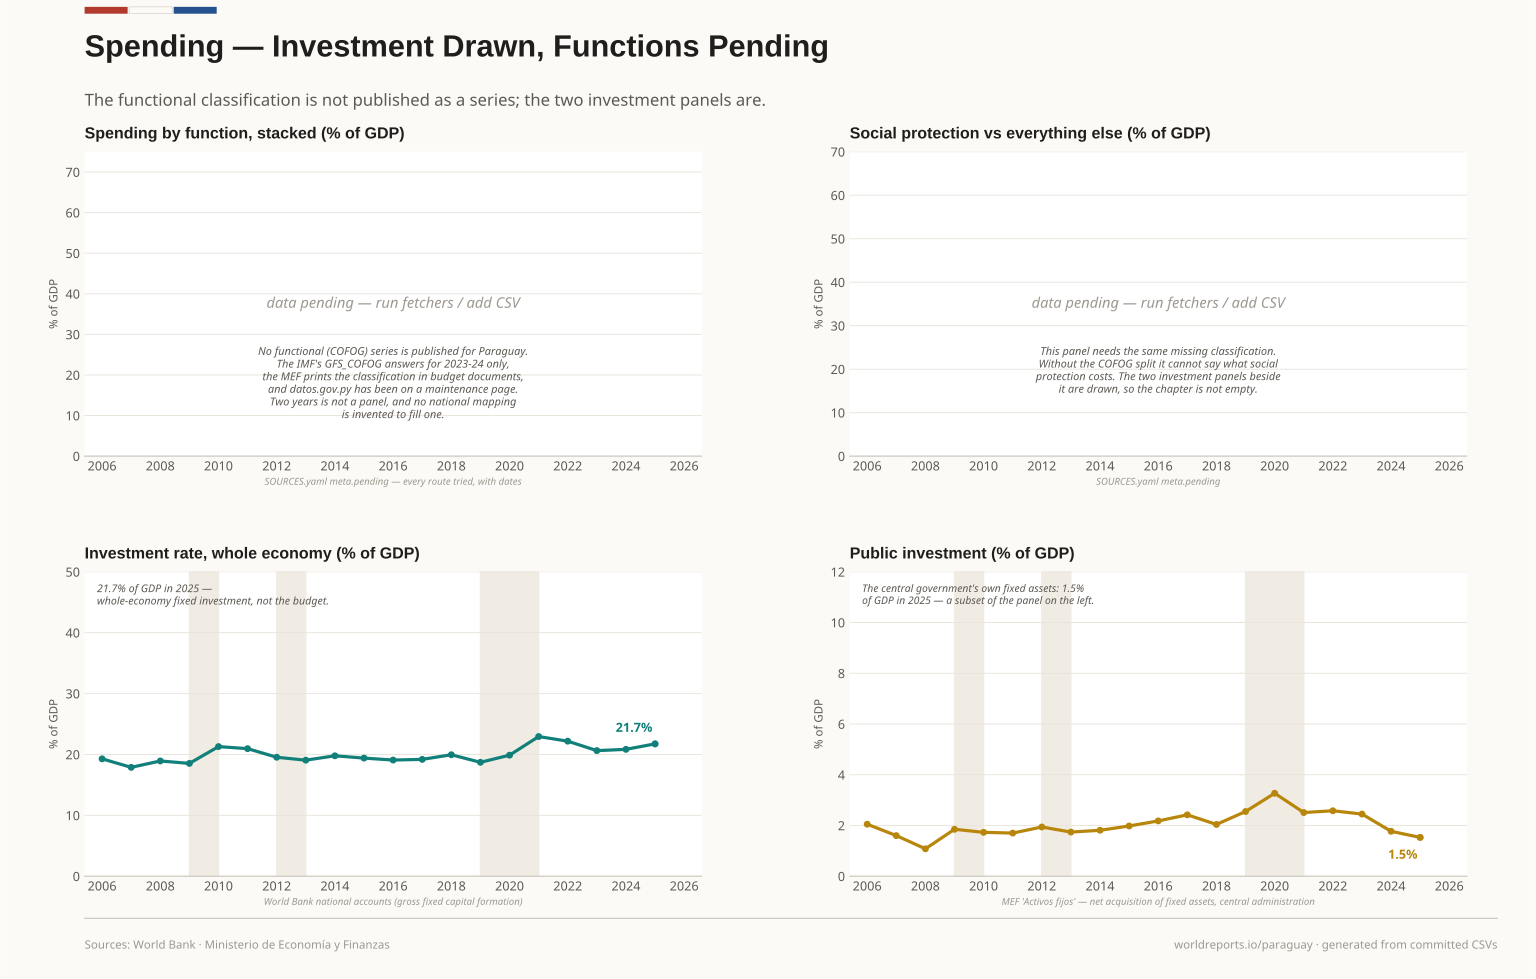
  3. Four panels on spending: two functional panels visibly pending with the routes that failed, the whole-economy investment rate, and the central government's own fixed investment. Plate 03

    Spending and Investment

    The functional classification is not published as a series; the two investment panels are drawn.

    View full size Download vector (SVG)
    Show the data
    The figures behind this plate, as committed. Source file: spending/spending.csv
    YearGFCF, % GDPCentral-government fixed assets, % GDP
    200619.282.05
    200717.881.60
    200818.931.08
    200918.531.85
    201021.291.73
    201120.951.70
    201219.541.94
    201319.061.74
    201419.781.81
    201519.401.98
    201619.082.18
    201719.192.42
    201819.952.04
    201918.712.55
    202019.883.27
    202122.942.51
    202222.182.58
    202320.632.45
    202420.841.77
    202521.741.53
    Drawn from · 1

    The committed files this plate was read from, as recorded while it was drawn.

    • spending/spending.csvWorld Bank NE.GDI.FTOT.ZS (whole-economy GFCF); MEF 'Activos fijos' (central-government fixed investment) · 2006-2025
    20062025
    21.7% GDP Investment rate latest
    1.5% GDP Public investment latest
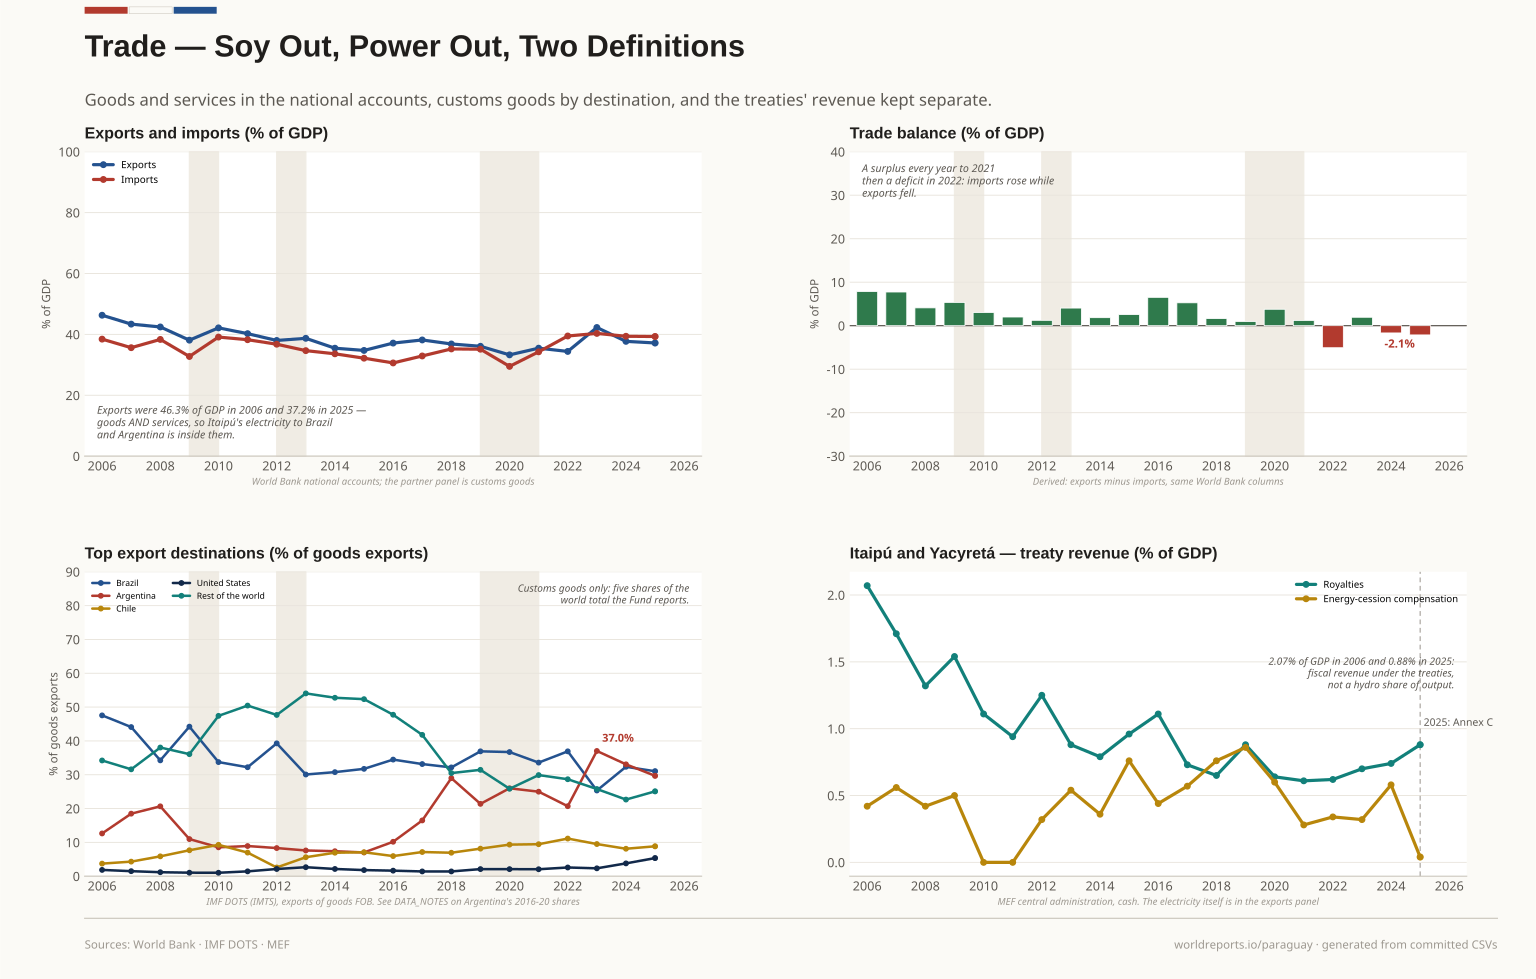
  4. Four panels on Paraguay's trade: exports and imports of goods and services as a share of GDP; their balance; the destinations of customs goods exports since 2006; and Itaipú-Yacyretá royalties as treaty revenue. Plate 04

    Trade

    Goods and services in the national accounts, customs goods by destination, and the treaties' revenue kept separate.

    View full size Download vector (SVG)
    Show the data
    The figures behind this plate, as committed. Source file: trade/trade.csv
    YearExports, % GDPImports, % GDPBalance, % GDP
    200646.2938.447.85
    200743.3735.637.74
    200842.4438.344.10
    200938.1032.745.36
    201042.1439.123.02
    201140.2438.251.99
    201238.0036.771.23
    201338.7134.664.05
    201435.4633.621.84
    201534.7332.182.55
    201637.1430.626.52
    201738.1732.915.26
    201836.8535.221.63
    201936.0935.130.96
    202033.2729.493.78
    202135.4734.271.20
    202234.4039.47-5.07
    202342.2640.321.94
    202437.7139.38-1.67
    202537.1839.30-2.12
    Drawn from · 3

    The committed files this plate was read from, as recorded while it was drawn.

    • fiscal/fiscal_national.csvMinisterio de Economía y Finanzas (Paraguay) — 'MEFP 2001 Administración Central 2003-2025 serie anual' · 2003-2025
    • trade/partners.csvIMF DOTS, IMTS dataflow — exports of goods FOB, US$, by partner · 2006-2025
    • trade/trade.csvWorld Bank WDI — NE.EXP.GNFS.ZS, NE.IMP.GNFS.ZS (goods and services, national accounts) · 2006-2025
    20062025
    37.2% GDP Exports, % of GDP latest
    -2.1% GDP Trade balance, % of GDP 2025
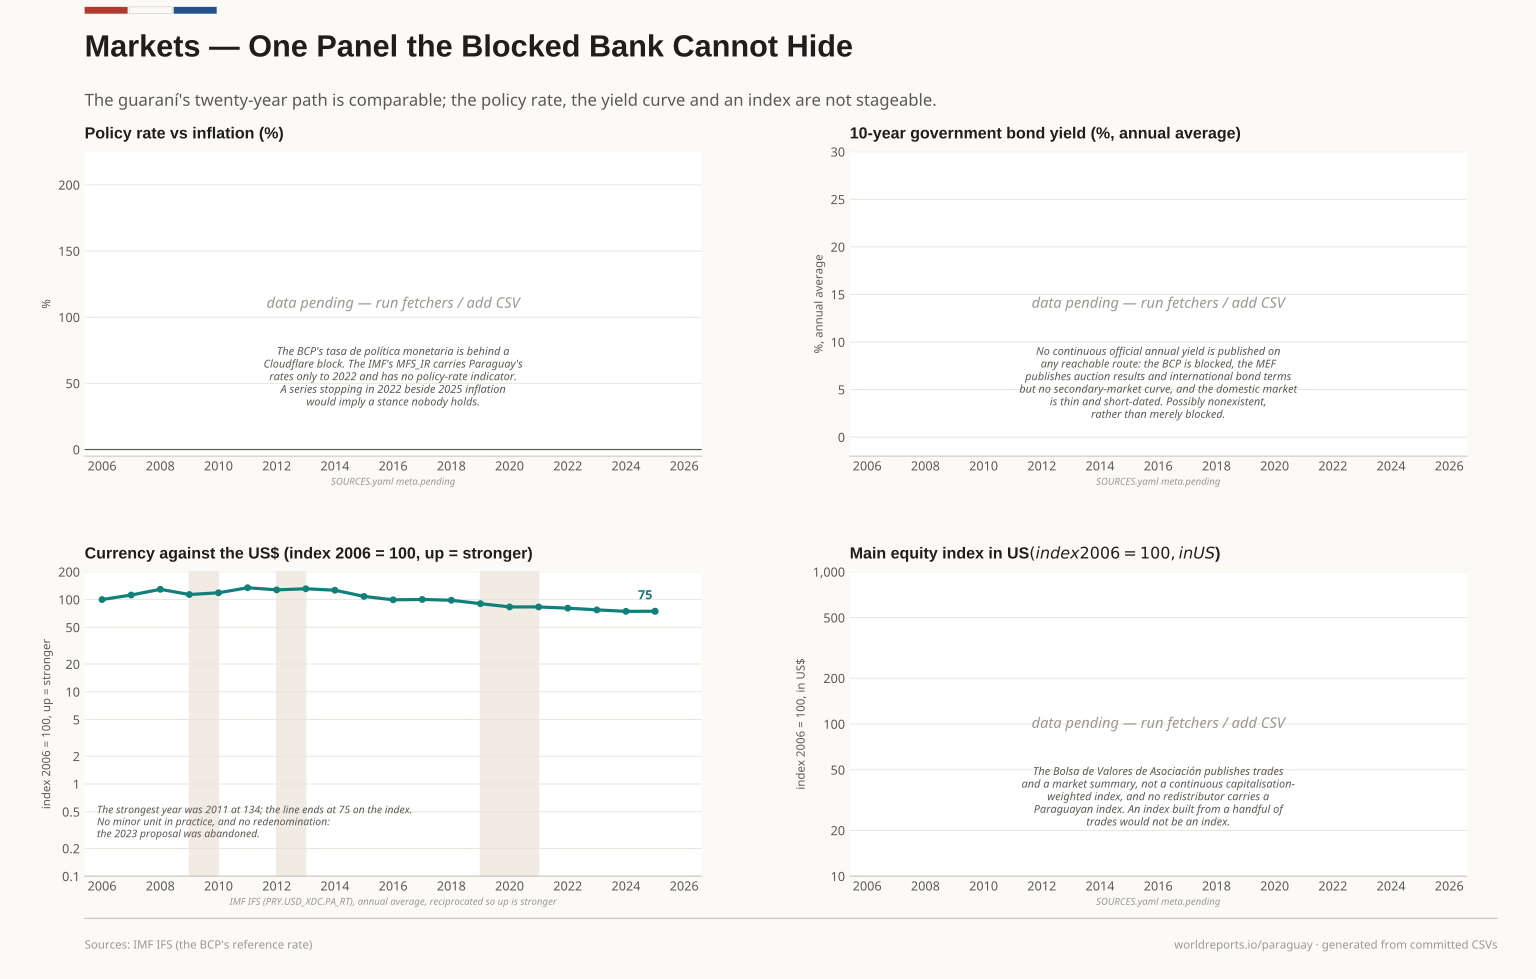
  5. Four panels on markets: three visibly pending panels for the policy rate, the ten-year yield and an equity index, and the guaraní against the dollar indexed to 2006. Plate 05

    Markets

    The guaraní's twenty-year path is comparable; the policy rate, the yield curve and an index cannot be staged.

    View full size Download vector (SVG)
    Show the data
    The figures behind this plate, as committed. Source file: markets/fx.csv
    YearGuaraníes per US$, annual average
    20065635.09
    20075032.71
    20084363.29
    20094966.68
    20104758.43
    20114193.80
    20124421.66
    20134303.88
    20144462.19
    20155204.92
    20165670.54
    20175618.93
    20185732.10
    20196240.72
    20206771.10
    20216774.16
    20226982.75
    20237288.87
    20247560.25
    20257545.45
    Drawn from · 1

    The committed files this plate was read from, as recorded while it was drawn.

    • markets/fx.csvIMF IFS — ER dataflow, PRY.USD_XDC.PA_RT (US$ per guaraní, period average), reciprocated · 2006-2025
    20062025
    75 Guaraníes per dollar latest
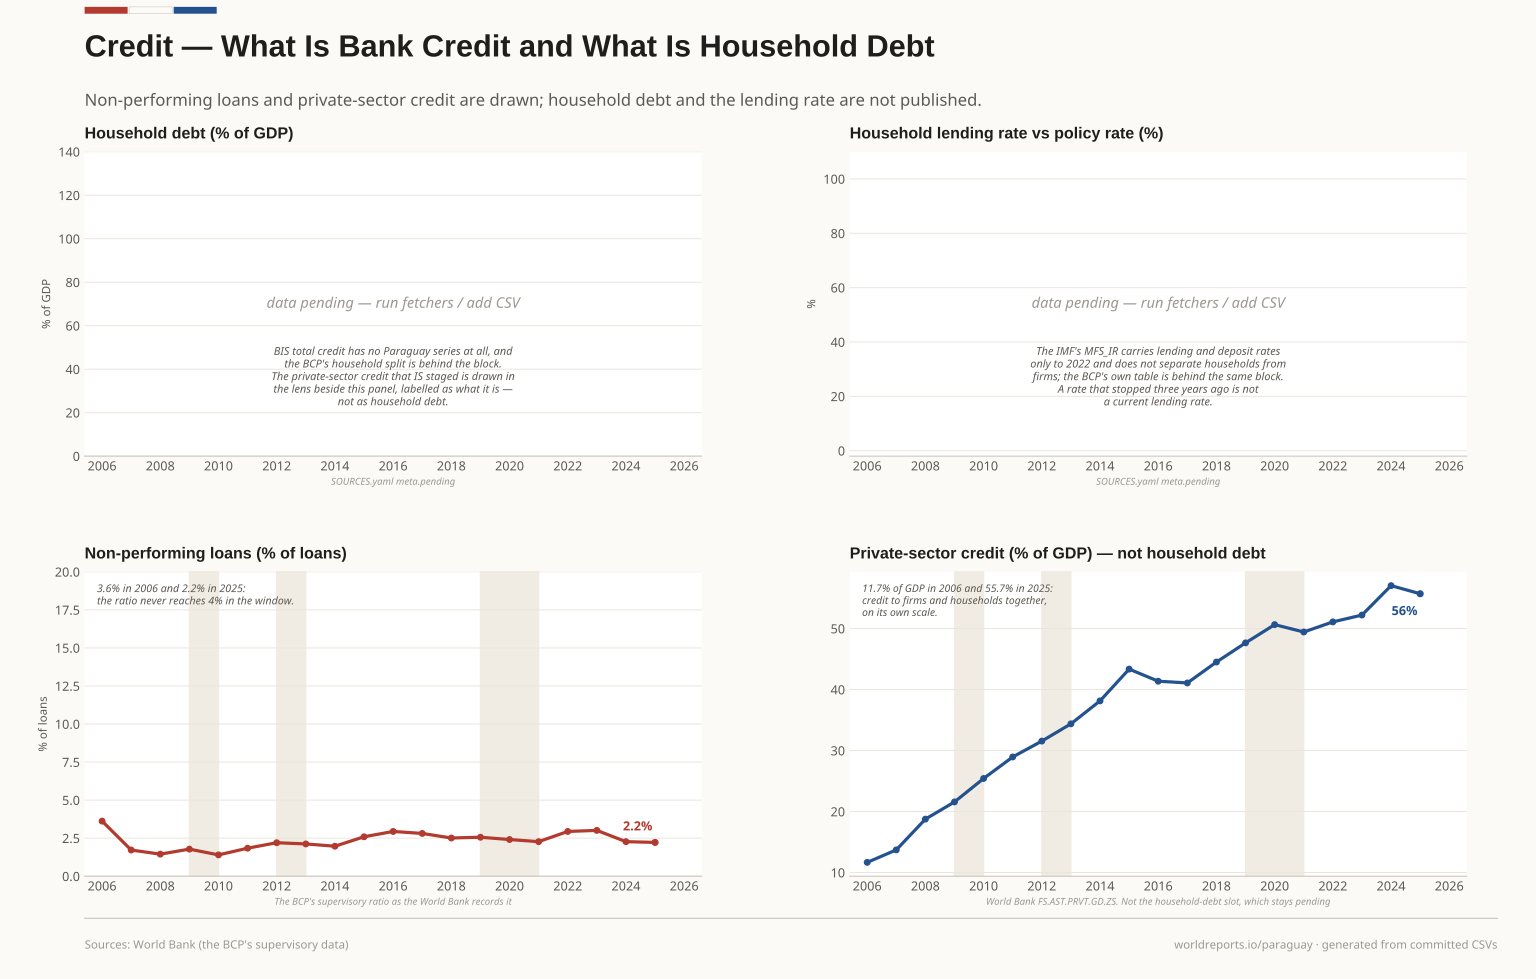
  6. Four panels on credit: household debt and the household lending rate visibly pending, the non-performing loan ratio, and private-sector credit labelled as not household debt. Plate 06

    Credit

    Non-performing loans and private-sector credit are drawn; household debt and the lending rate are not published.

    View full size Download vector (SVG)
    Show the data
    The figures behind this plate, as committed. Source file: credit/credit.csv
    YearNPL, % of loansPrivate credit, % GDP
    20063.6211.67
    20071.7213.72
    20081.4518.76
    20091.7821.58
    20101.4025.42
    20111.8428.95
    20122.2031.55
    20132.1234.38
    20141.9738.14
    20152.5943.35
    20162.9441.36
    20172.8141.08
    20182.5144.51
    20192.5647.65
    20202.4150.64
    20212.2749.43
    20222.9451.09
    20233.0152.21
    20242.2757.03
    20252.2255.70
    Drawn from · 1

    The committed files this plate was read from, as recorded while it was drawn.

    • credit/credit.csvWorld Bank FB.AST.NPER.ZS (NPL to gross loans) and FS.AST.PRVT.GD.ZS (private credit by banks, % of GDP) · 2006-2025
    20062025
    2.2% Non-performing loans latest
    55.7% GDP Private credit, % of GDP latest
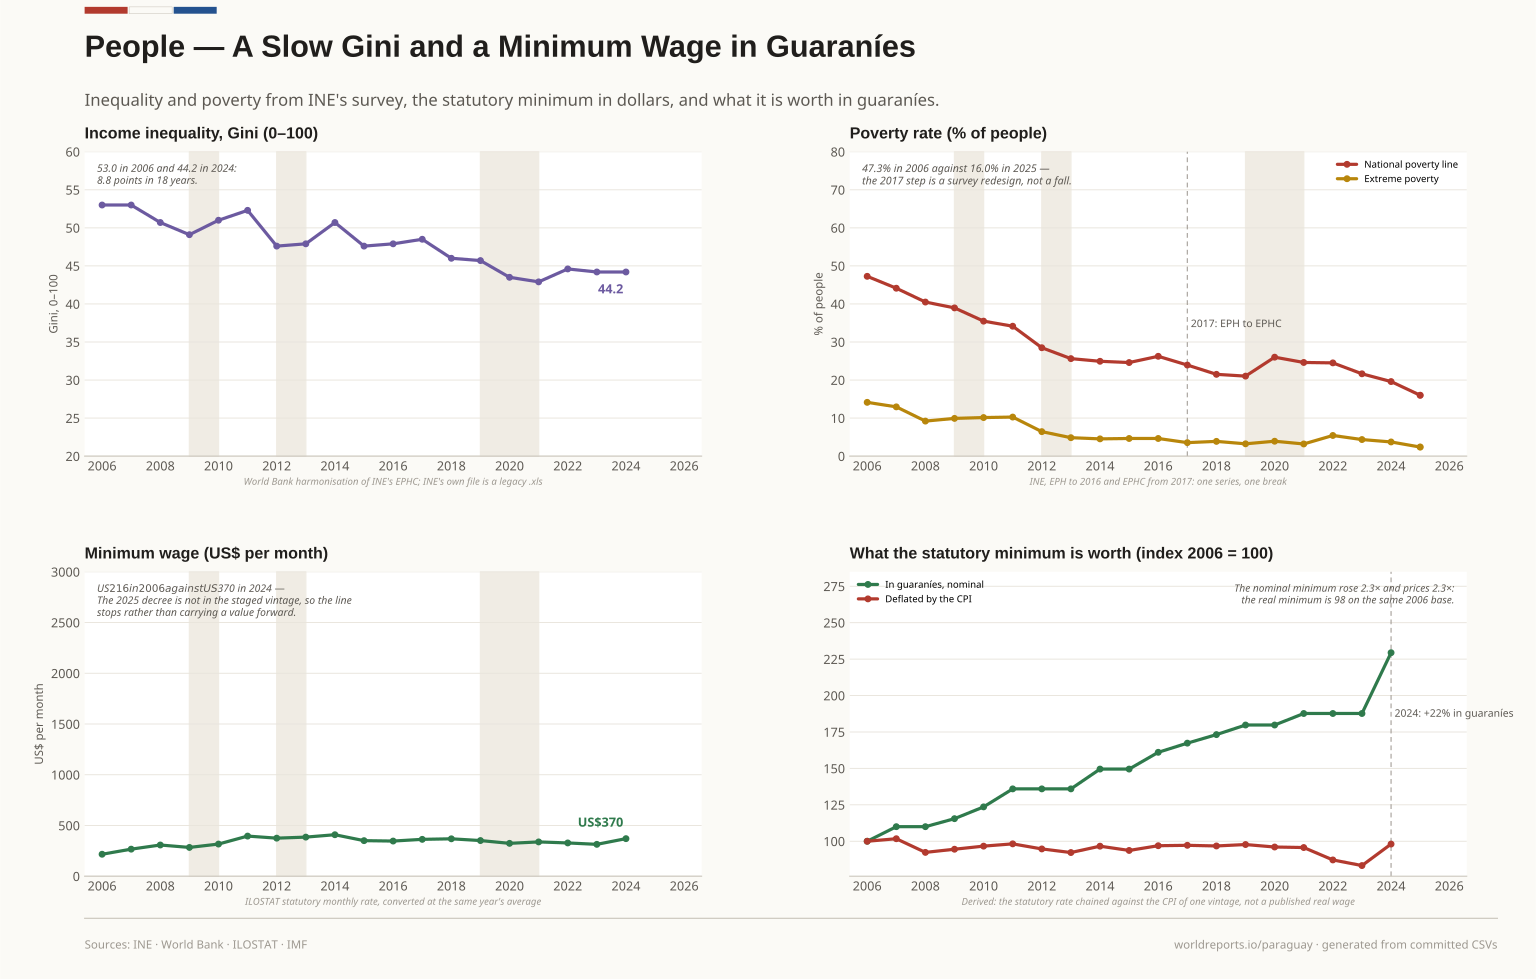
  7. Four panels on people: the Gini coefficient; the national poverty rate with its 2017 survey break marked; the statutory minimum wage in dollars per month; and its value in guaraníes against the CPI. Plate 07

    People

    Inequality and poverty from INE's survey, the statutory minimum in dollars, and what it is worth in guaraníes.

    View full size Download vector (SVG)
    Show the data
    The figures behind this plate, as committed. Source file: people/income.csv
    YearGiniPoverty, % of peopleMinimum wage, US$ per month
    200256.77
    200351.05
    200447.95
    200543.98
    200653.0047.26216.46
    200753.0044.13266.61
    200850.7040.50307.51
    200949.1038.96283.66
    201051.0035.48316.80
    201152.3034.15395.40
    201247.6028.49375.02
    201347.9025.63385.29
    201450.7024.93408.78
    201547.6024.60350.45
    201647.9026.24346.44
    201748.5023.94363.26
    201846.0021.50368.55
    201945.7021.03351.38
    202043.5026.01323.85
    202142.9024.62337.95
    202244.6024.51327.85
    202344.2021.64314.08
    202444.2019.60370.13
    202516.00
    Drawn from · 2

    The committed files this plate was read from, as recorded while it was drawn.

    • macro/economy.csvWorld Bank WDI (NY.GDP.MKTP.KD.ZG, NY.GDP.PCAP.CD, SL.UEM.TOTL.ZS); IMF IFS (CPI, PRY.CPI._T.YOY_PCH_PA_PT); INE (EPHC unemployment) · 2006-2025
    • people/income.csvWorld Bank SI.POV.GINI; INE EPHC poverty incidence; ILOSTAT DF_EAR_INEE_CUR_NB minimum wage; IMF FX for the US$ conversion · 2002-2025
    20022025
    16.0% Poverty 2025
    44.20 Gini latest
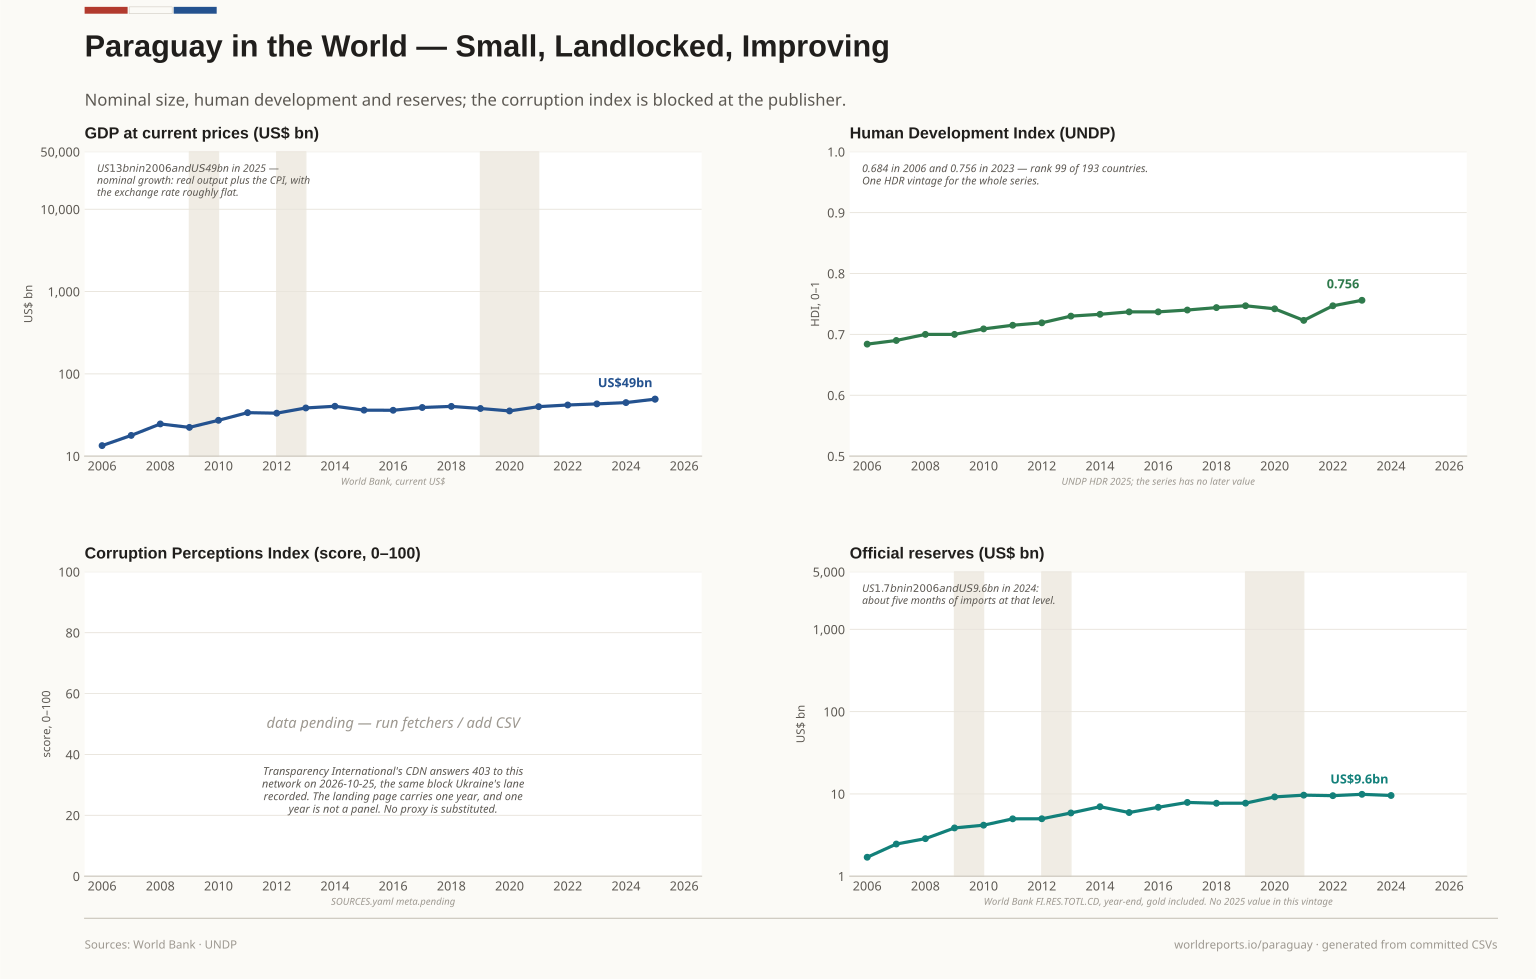
  8. Four panels placing Paraguay in the world: nominal GDP in dollars, the Human Development Index, a pending corruption index with its reason, and official reserves. Plate 08

    Paraguay in the World

    Nominal size, human development and reserves; the corruption index is blocked at the publisher.

    View full size Download vector (SVG)
    Show the data
    The figures behind this plate, as committed. Source file: world/gdp_usd.csv
    YearGDP, US$ bnReserves, US$ bn
    200613.431.70
    200717.862.46
    200824.622.86
    200922.363.86
    201027.264.17
    201133.764.98
    201233.274.99
    201338.505.87
    201440.386.99
    201536.215.94
    201636.096.88
    201739.007.88
    201840.237.70
    201937.937.72
    202035.439.20
    202139.949.66
    202241.849.52
    202343.149.89
    202444.749.57
    202549.28
    Drawn from · 2

    The committed files this plate was read from, as recorded while it was drawn.

    • world/gdp_usd.csvWorld Bank WDI — NY.GDP.MKTP.CD (GDP, current US$), FI.RES.TOTL.CD (total reserves incl. gold) · 2006-2025
    • world/hdi.csvUNDP Human Development Report 2025 — composite indices, one vintage · 2006-2023
    20062025
    US$ 49bn GDP, US$ bn latest
    0.756 HDI latest
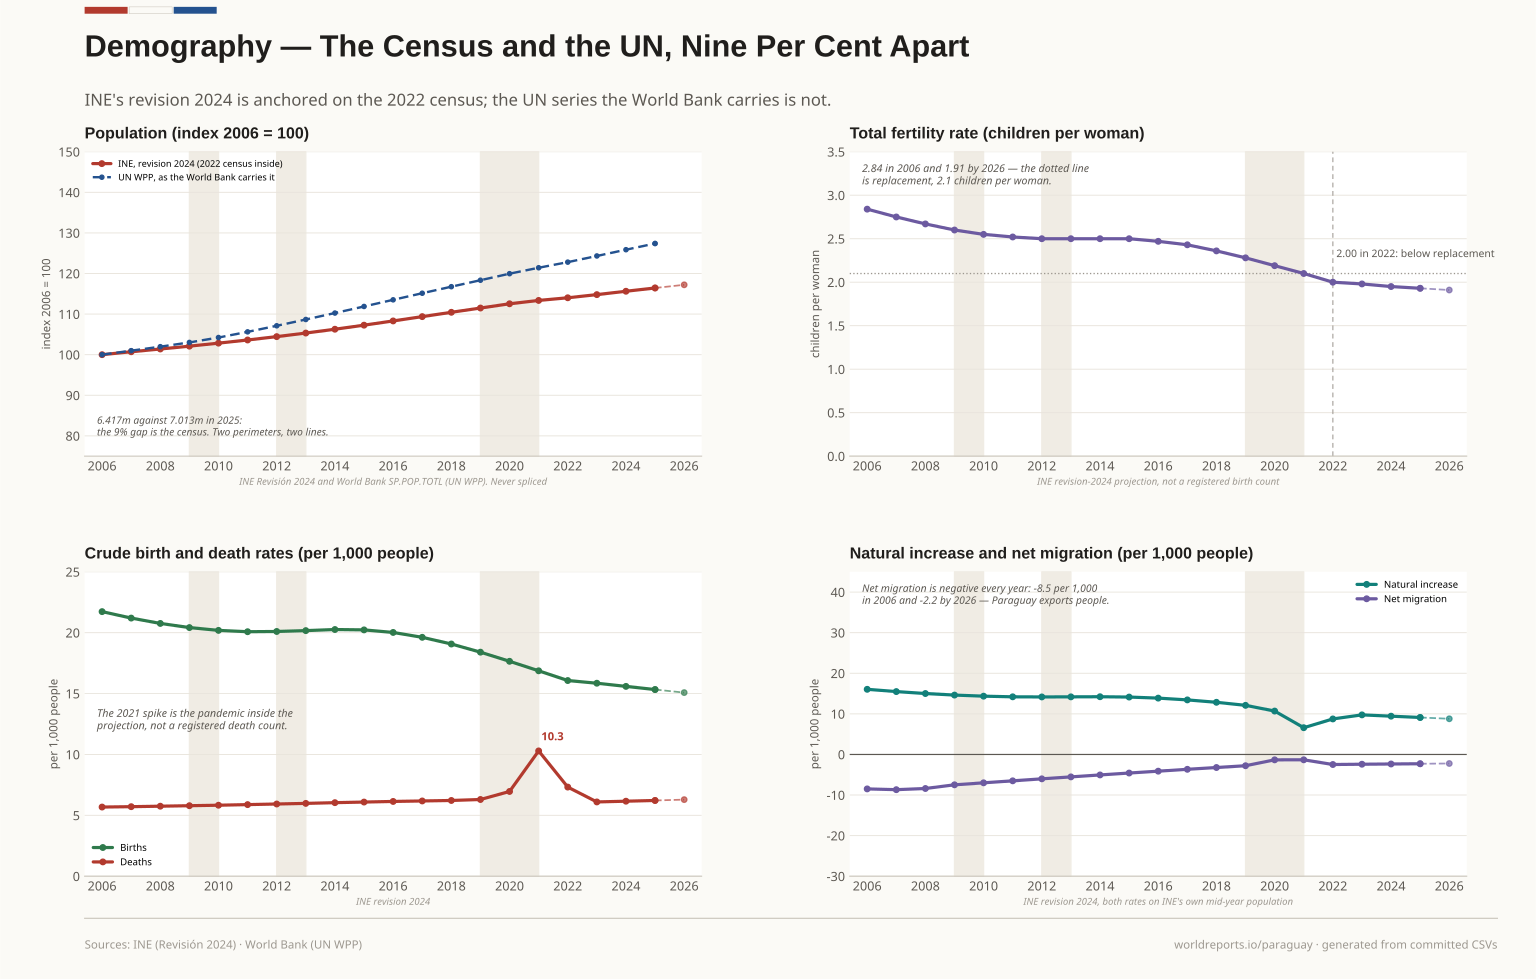
  9. Four panels on demography: the population index on two perimeters nine per cent apart; the fertility rate falling below replacement in 2022; crude birth and death rates; and natural increase against net migration. Plate 09

    Demography

    INE's revision 2024 is anchored on the 2022 census; the UN series the World Bank carries is not.

    View full size Download vector (SVG)
    Show the data
    The figures behind this plate, as committed. Source file: demography/population.csv
    YearPopulation (INE)Children per womanDeaths, per 1,000
    20065511383.002.845.68
    20075551108.002.755.71
    20085588470.002.675.75
    20095627047.002.605.79
    20105668042.002.555.83
    20115710913.002.525.88
    20125756397.002.505.93
    20135805006.002.505.98
    20145856972.002.506.04
    20155912082.002.506.09
    20165969497.002.476.14
    20176028083.002.436.18
    20186086887.002.366.22
    20196144832.002.286.30
    20206202478.002.196.96
    20216247916.002.1010.29
    20226284020.002.007.32
    20236326825.001.986.10
    20246372623.001.956.16
    20256417076.001.936.22
    20266460159.001.916.29
    20276501860.001.896.35
    20286542162.001.876.43
    20296581105.001.866.50
    20306618731.001.846.58
    20316655078.001.836.66
    20326690178.001.826.75
    20336724075.001.816.83
    20346756797.001.806.92
    20356788357.001.797.02
    20366818771.001.787.11
    20376848016.001.777.21
    20386876081.001.777.30
    20396902958.001.767.40
    20406928644.001.757.50
    20416953097.001.757.61
    20426976359.001.757.71
    20436998436.001.747.82
    20447019325.001.747.92
    20457039039.001.738.03
    20467057562.001.738.14
    20477074865.001.738.25
    20487090927.001.738.36
    20497105697.001.728.48
    20507119137.001.728.59
    Drawn from · 2

    The committed files this plate was read from, as recorded while it was drawn.

    20062025
    6.4M Population latest
    1.72 Fertility rate latest
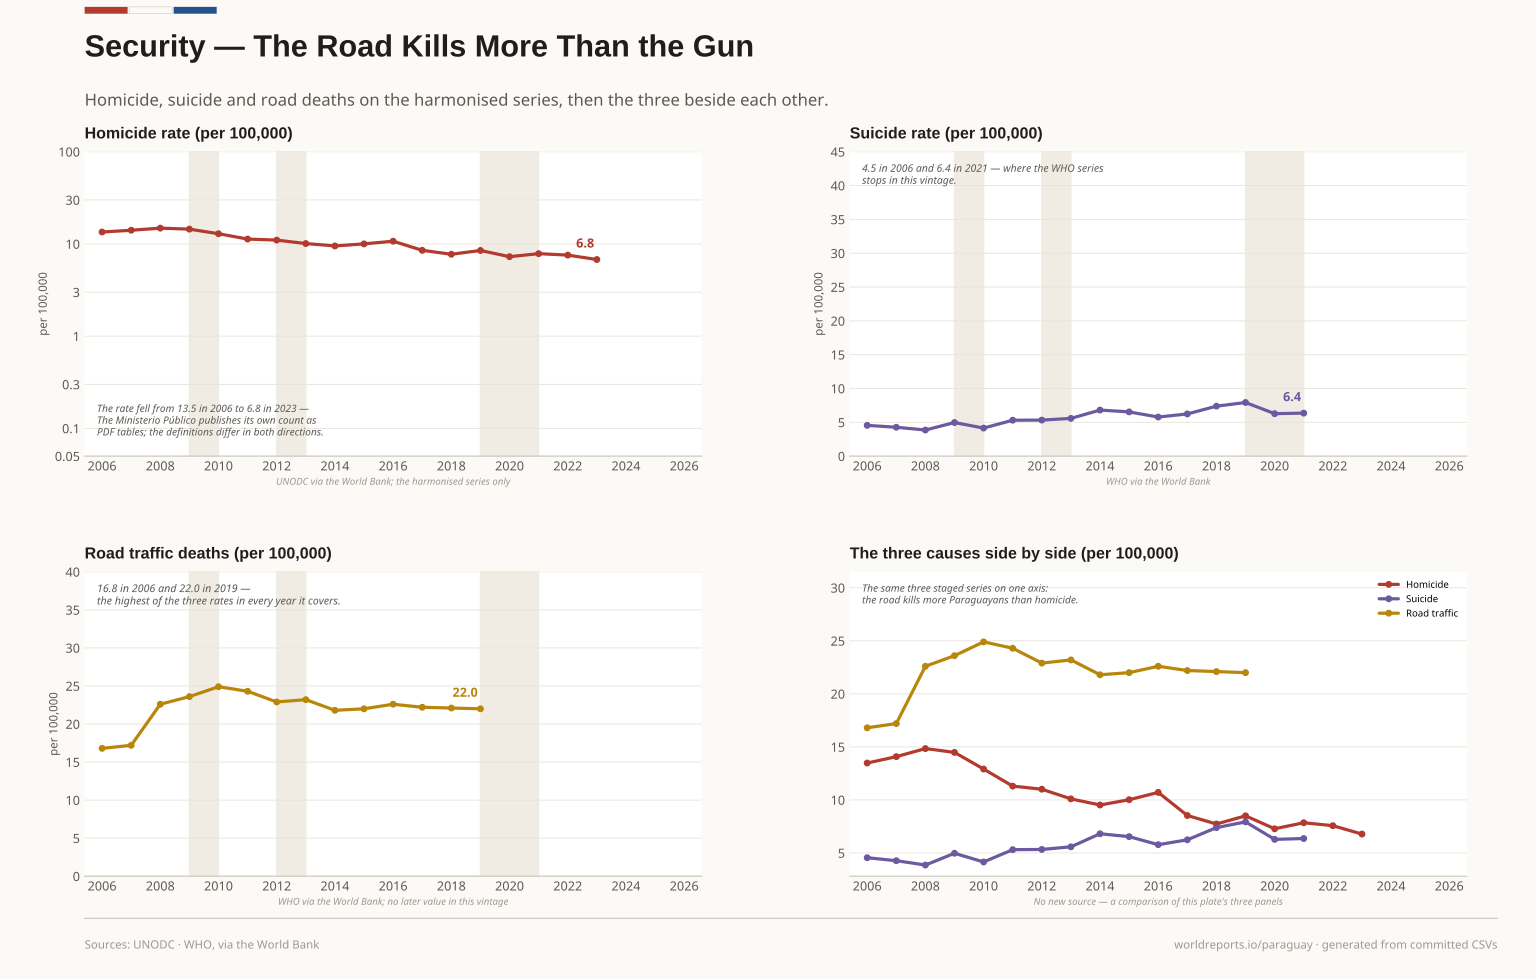
  10. Four panels on security: the homicide rate on a log scale, the suicide rate, road traffic deaths, and the three rates drawn together on one axis. Plate 10

    Security

    Homicide, suicide and road deaths on the harmonised series, then the three beside each other.

    View full size Download vector (SVG)
    Show the data
    The figures behind this plate, as committed. Source file: security/security.csv
    YearHomicide, per 100,000Suicide, per 100,000Road, per 100,000
    200613.484.5516.80
    200714.084.2717.20
    200814.843.8622.60
    200914.484.9723.60
    201012.914.1524.90
    201111.305.3124.30
    201211.015.3322.90
    201310.105.5823.20
    20149.526.8121.80
    201510.026.5422.00
    201610.715.7822.60
    20178.536.2422.20
    20187.737.3922.10
    20198.507.9322.00
    20207.286.28
    20217.856.36
    20227.57
    20236.78
    Drawn from · 1

    The committed files this plate was read from, as recorded while it was drawn.

    • security/security.csvUNODC (VC.IHR.PSRC.P5) and WHO (SH.STA.SUIC.P5, SH.STA.TRAF.P5) via the World Bank · 2006-2023
    20062023
    6.8/100k Homicide, per 100,000 latest
    22.0/100k Road deaths, per 100,000 2019
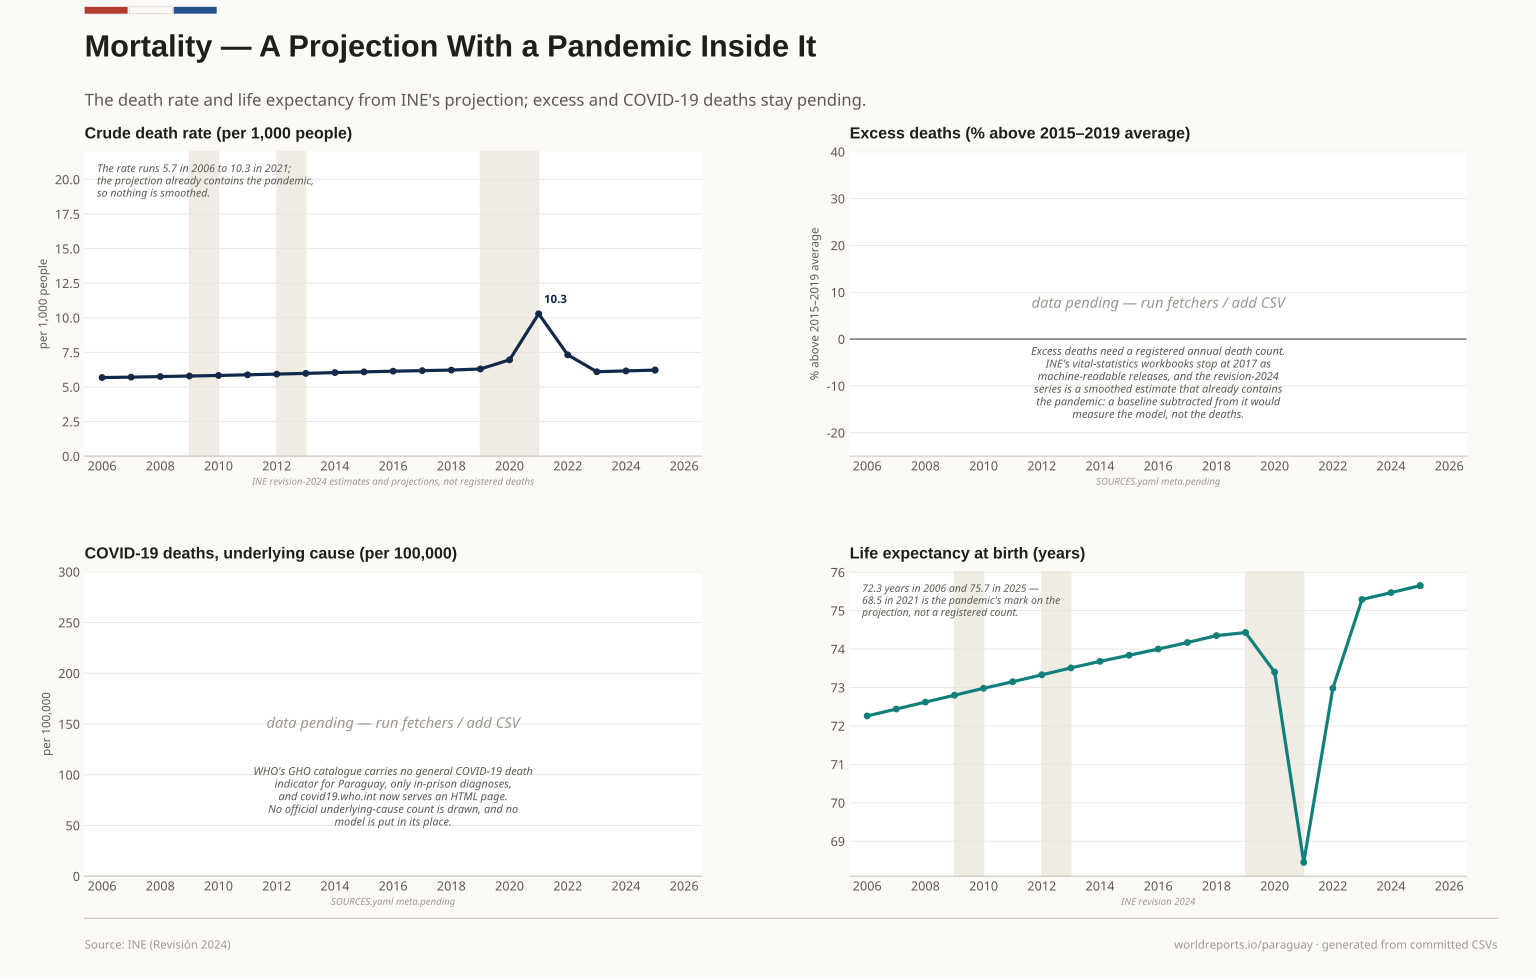
  11. Four panels on mortality: the crude death rate with its 2021 spike, two visibly pending panels for excess and COVID-19 deaths with their reasons, and life expectancy. Plate 11

    Mortality

    The death rate and life expectancy from INE's projection; excess and COVID-19 deaths stay pending.

    View full size Download vector (SVG)
    Show the data
    The figures behind this plate, as committed. Source file: mortality/mortality.csv
    YearDeaths (projection)Crude rate, per 1,000Life expectancy, years
    200631293.005.6872.26
    200731698.005.7172.44
    200832124.005.7572.62
    200932574.005.7972.80
    201033062.005.8372.98
    201133582.005.8873.15
    201234134.005.9373.33
    201334708.005.9873.51
    201435354.006.0473.68
    201536009.006.0973.84
    201636657.006.1474.00
    201737276.006.1874.17
    201837840.006.2274.35
    201938690.006.3074.43
    202043179.006.9673.40
    202164274.0010.2968.45
    202245995.007.3272.98
    202338567.006.1075.29
    202439225.006.1675.47
    202539904.006.2275.65
    Drawn from · 1

    The committed files this plate was read from, as recorded while it was drawn.

    • mortality/mortality.csvINE Paraguay — revision-2024 estimates and projections (deaths, crude death rate, life expectancy) · 2006-2025
    20062025
    75.7 yrs Life expectancy latest
    6.22 Death rate, per 1,000 latest
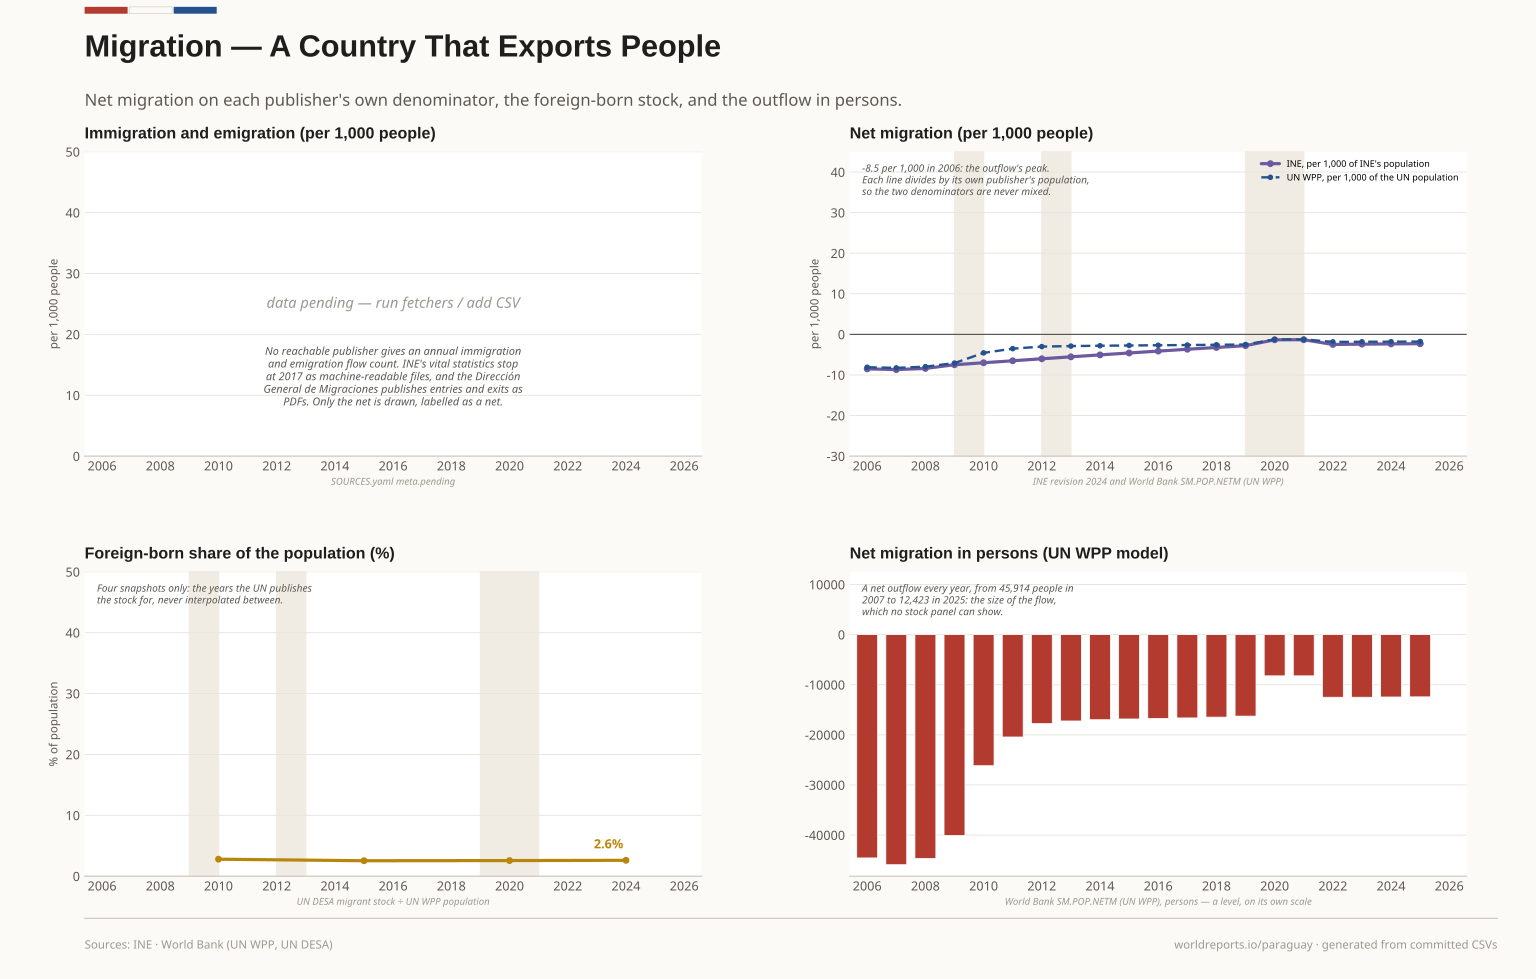
  12. Four panels on migration: gross flows visibly pending; net migration from INE and from the UN, each on its own population; the foreign-born share in four snapshots; and net migration in persons. Plate 12

    Migration

    Net migration on each publisher's own denominator, the foreign-born stock, and the outflow in persons.

    View full size Download vector (SVG)
    Show the data
    The figures behind this plate, as committed. Source file: migration/migration.csv
    YearINE net migration, per 1,000UN net migration, personsMigrant stock (UN)
    2006-8.49-44568.00
    2007-8.68-45914.00
    2008-8.39-44679.00
    2009-7.48-40112.00
    2010-6.99-26169.00160299.00
    2011-6.50-20427.00
    2012-6.01-17763.00
    2013-5.53-17232.00
    2014-5.05-16989.00
    2015-4.58-16834.00156462.00
    2016-4.12-16737.00
    2017-3.66-16630.00
    2018-3.22-16472.00
    2019-2.78-16263.00
    2020-1.33-8226.00169567.00
    2021-1.32-8226.00
    2022-2.48-12500.00
    2023-2.41-12500.00
    2024-2.35-12451.00180837.00
    2025-2.29-12423.00
    Drawn from · 2

    The committed files this plate was read from, as recorded while it was drawn.

    20062025
    -2.29 Net migration, per 1,000 latest
    2.6% Foreign-born, % of population latest