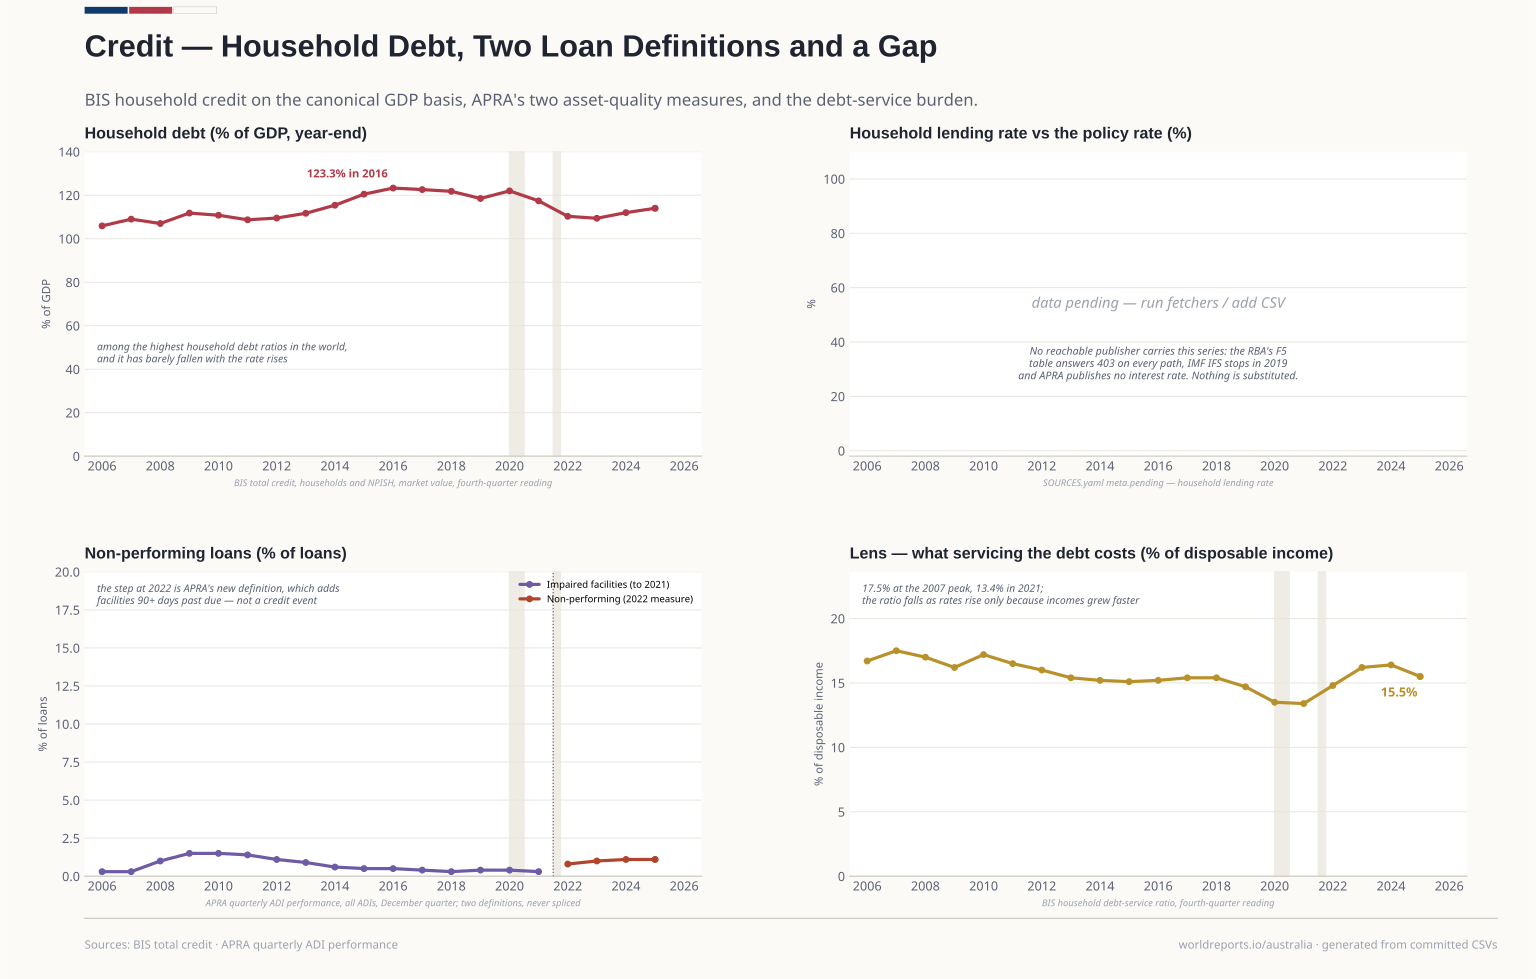
credit/household_debt.csv | VERIFIED 2026-10-25. Credit to households and NPISHs from all sectors, market value, as % of GDP, adjusted for breaks; year-end (Q4) reading, the… | BIS total credit statistics — WS_TC Q.AU.H.A.M.770.A and WS_DSR household series | 2006-2025 | Official |
|---|
credit/npl.csv | VERIFIED 2026-10-25. TWO definitions, two columns, never spliced: npl_impaired_pct is "impaired facilities to loans and advances" (September 2004 to… | APRA — Quarterly authorised deposit-taking institution performance, Table 1g (all ADIs) | 2006-2025 | Official |
|---|
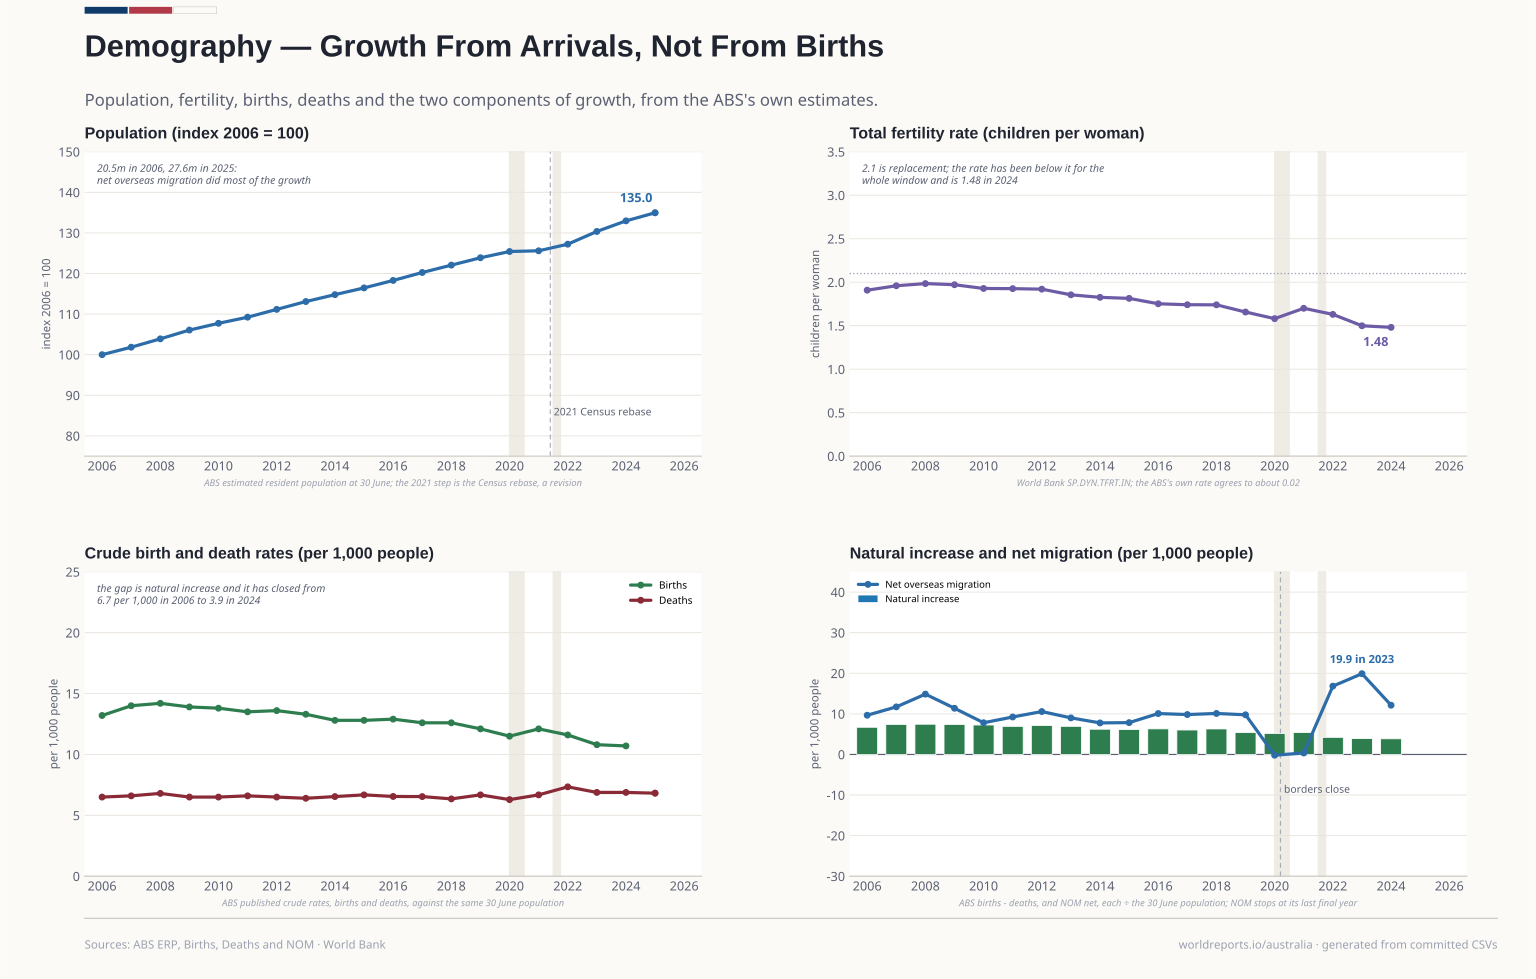
demography/births_deaths.csv | VERIFIED 2026-10-25. Registered births and the crude birth rate (births per 1,000 population) for 2006-2024; deaths and the crude death rate for… | ABS Births, Australia (BIRTHS_SUMMARY) and Deaths, Australia (DEATHS_SUMMARY) via ABS SDMX | 2006-2025 | Official |
|---|
demography/fertility.csv | VERIFIED 2026-10-25. Children per woman, 2006-2024 (2025 not yet published). 2006 1.91, 2024 1.48. The ABS publishes its own TFR in Births, Australia… | World Bank WDI — SP.DYN.TFRT.IN (total fertility rate) | 2006-2024 | Official |
|---|
demography/natural_increase.csv | VERIFIED 2026-10-25. Natural increase = (births − deaths) ÷ ERP × 1,000; net migration = NOM net ÷ ERP × 1,000. Both are derived, and the formula is… | Derived from the two files above and ABS Net Overseas Migration (NOM_CY) | 2006-2025 | Official |
|---|
demography/population.csv | VERIFIED 2026-10-25. ERP at 30 June each year (the Q2 quarter), the population the ABS publishes its own rates against; the index is 2006 = 100 for… | ABS Estimated Resident Population, quarterly (ERP_Q), persons, 30 June | 2006-2025 | Official |
|---|
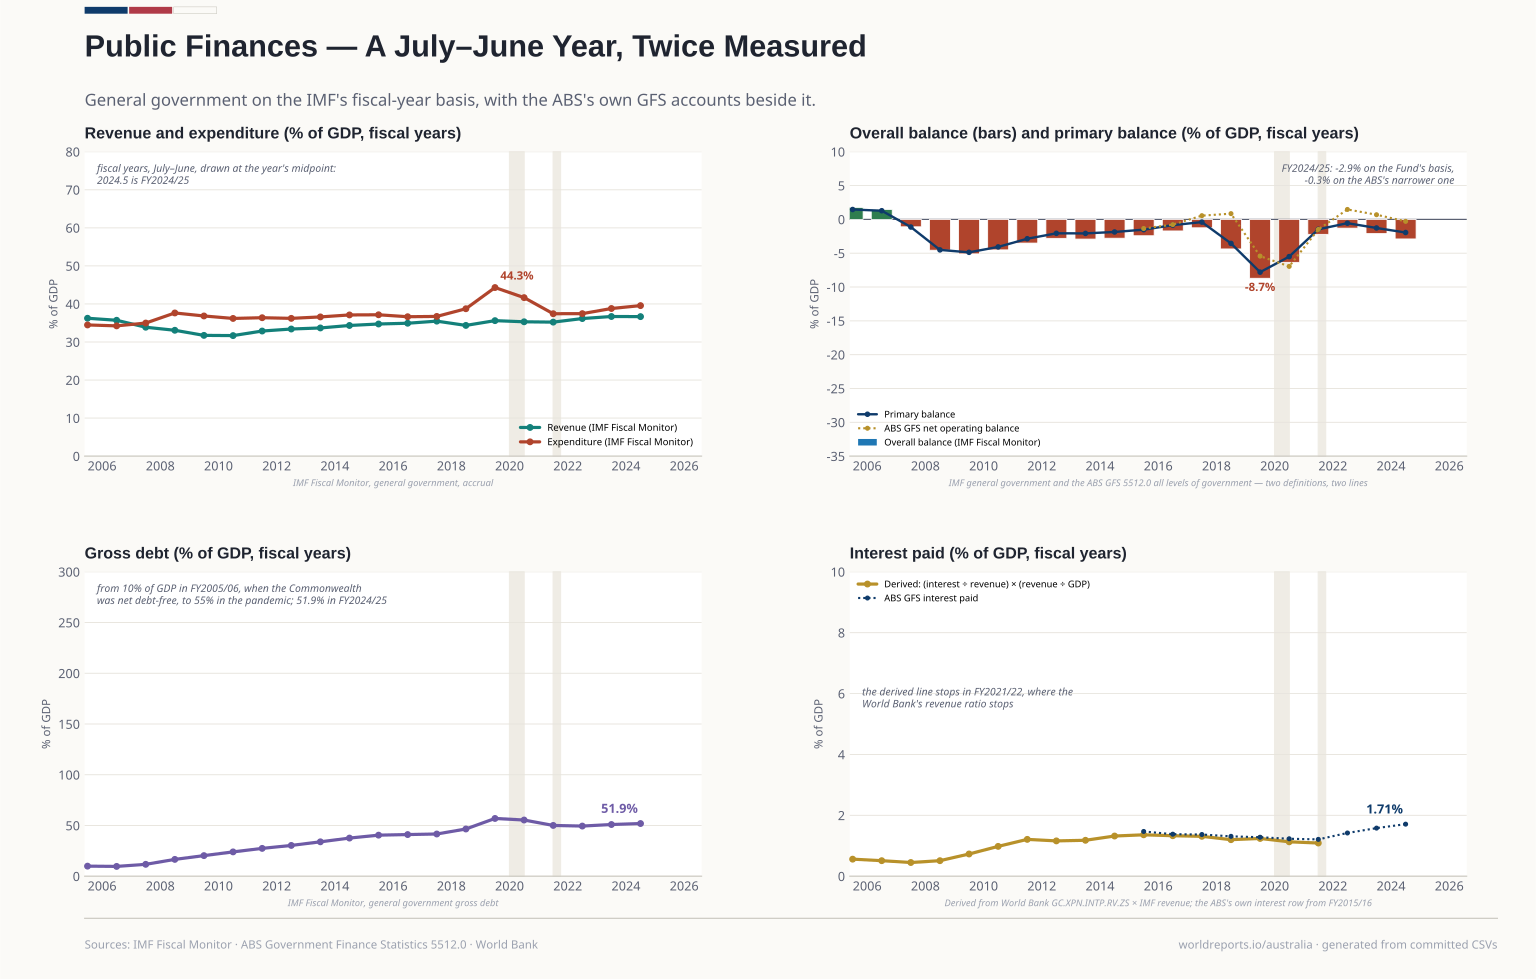
fiscal/fiscal.csv | VERIFIED 2026-10-25. FISCAL YEARS ending in the `year` column: the Fund labels Australia's July-June year by the year it ENDS, so "2025" is… | IMF Fiscal Monitor (SDMX IMF.FAD, dataflow FM 5.0.0) general government; interest derived from World Bank GC.XPN.INTP.RV.ZS; national line from ABS GFS 5512.0 | 2006-2025 | Official |
|---|
macro/economy.csv | VERIFIED 2026-10-25, one vintage (ABS SDMX, prepared that day). CALENDAR years built from the quarterly series: GDP and its components are the sum of… | Australian Bureau of Statistics — Australian National Accounts (ANA_EXP via ABS SDMX): C/VCH.GPM.SSS, CPI, Labour Force | 2006-2025 | Official |
|---|
macro/gdp_growth_imf.csv | VERIFIED 2026-10-25. The independent agreement line for the ABS national accounts, in calendar years. 2020 -2.05, 2022 +4.20 against the ABS -2.10… | IMF World Economic Outlook (SDMX IMF.RES, dataflow WEO 9.0.0) — NGDP_RPCH | 2006-2025 | Official |
|---|
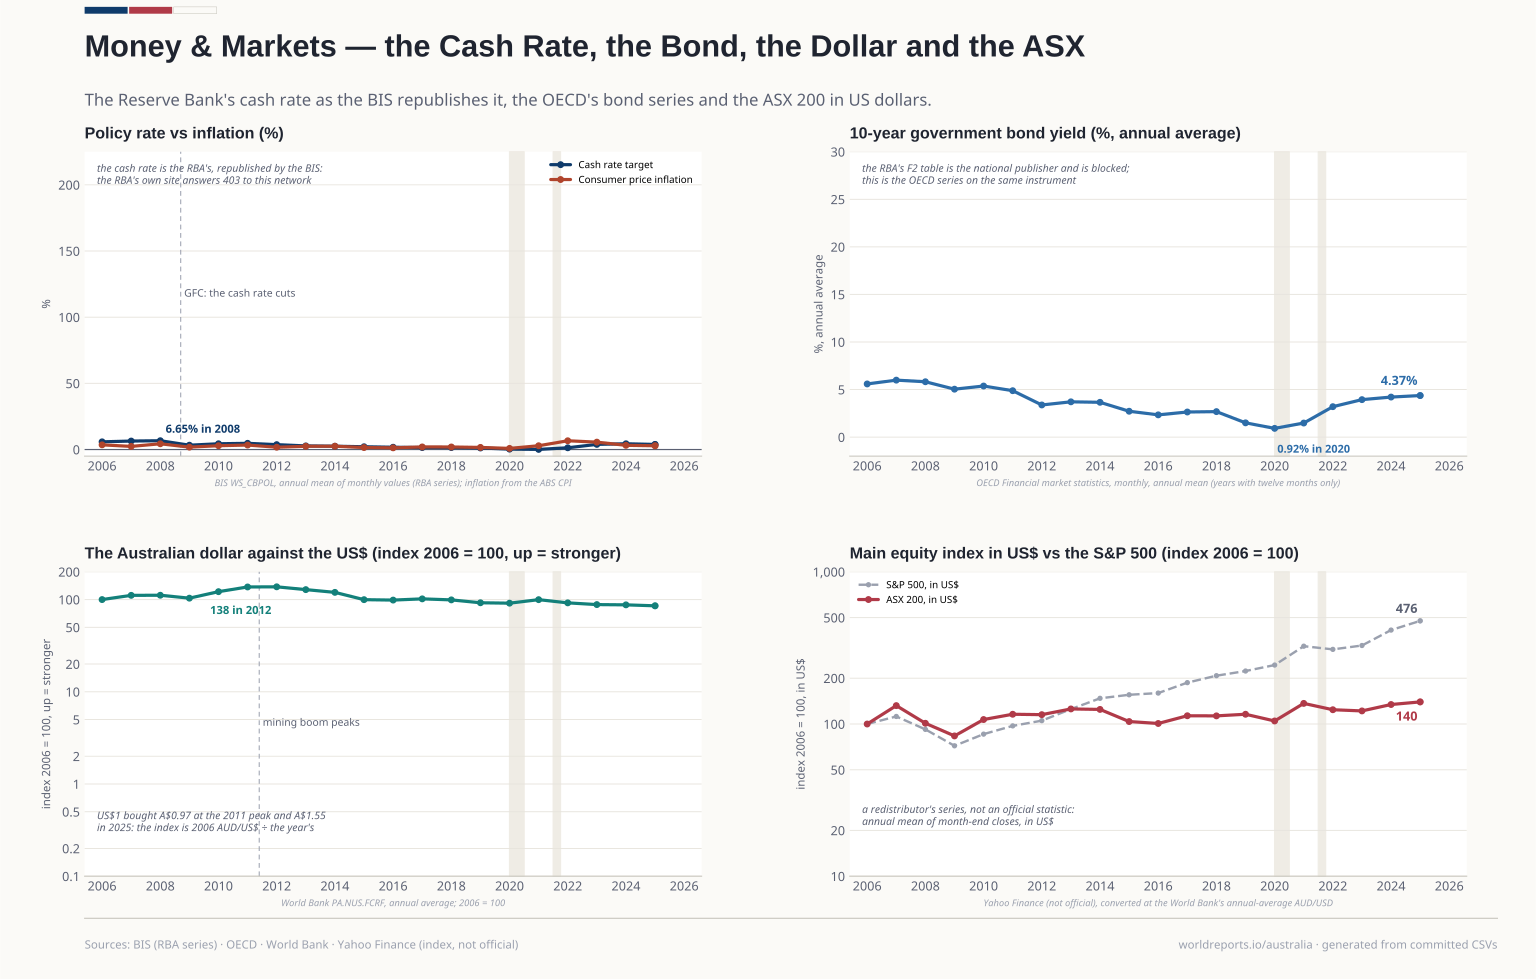
markets/bond_10y.csv | VERIFIED 2026-10-25. Ten-year government benchmark bond yield, monthly, annual mean of the twelve months (a year with fewer than twelve is dropped… | OECD Financial market statistics (DSD_STES@DF_FINMARK) — long-term interest rate, Australia, monthly | 2006-2025 | Official |
|---|
markets/currency.csv | VERIFIED 2026-10-25. AUD per US$, annual average, and the index 2006 = 100 built as 2006 rate ÷ year rate, so a RISING index means a stronger… | World Bank WDI — PA.NUS.FCRF (official exchange rate, annual average, AUD per US$) | 2006-2025 | Official |
|---|
markets/equities.csv | VERIFIED 2026-10-25. A market series from a redistributor, so `official: false` and the plate labels it. Annual mean of the monthly closes; the ASX… | Yahoo Finance chart API — ASX 200 (^AXJO), S&P 500 (^GSPC), monthly closes | 2006-2025 | Other |
|---|
markets/policy_rate.csv | VERIFIED 2026-10-25. The RBA cash rate target, annual mean of the twelve monthly end-of-period values (the rule for every rate here). 2025: 3.85%… | BIS central bank policy rates (WS_CBPOL) — Australia, monthly end of period, sourced by the BIS from the Reserve Bank of Australia | 2006-2025 | Official |
|---|
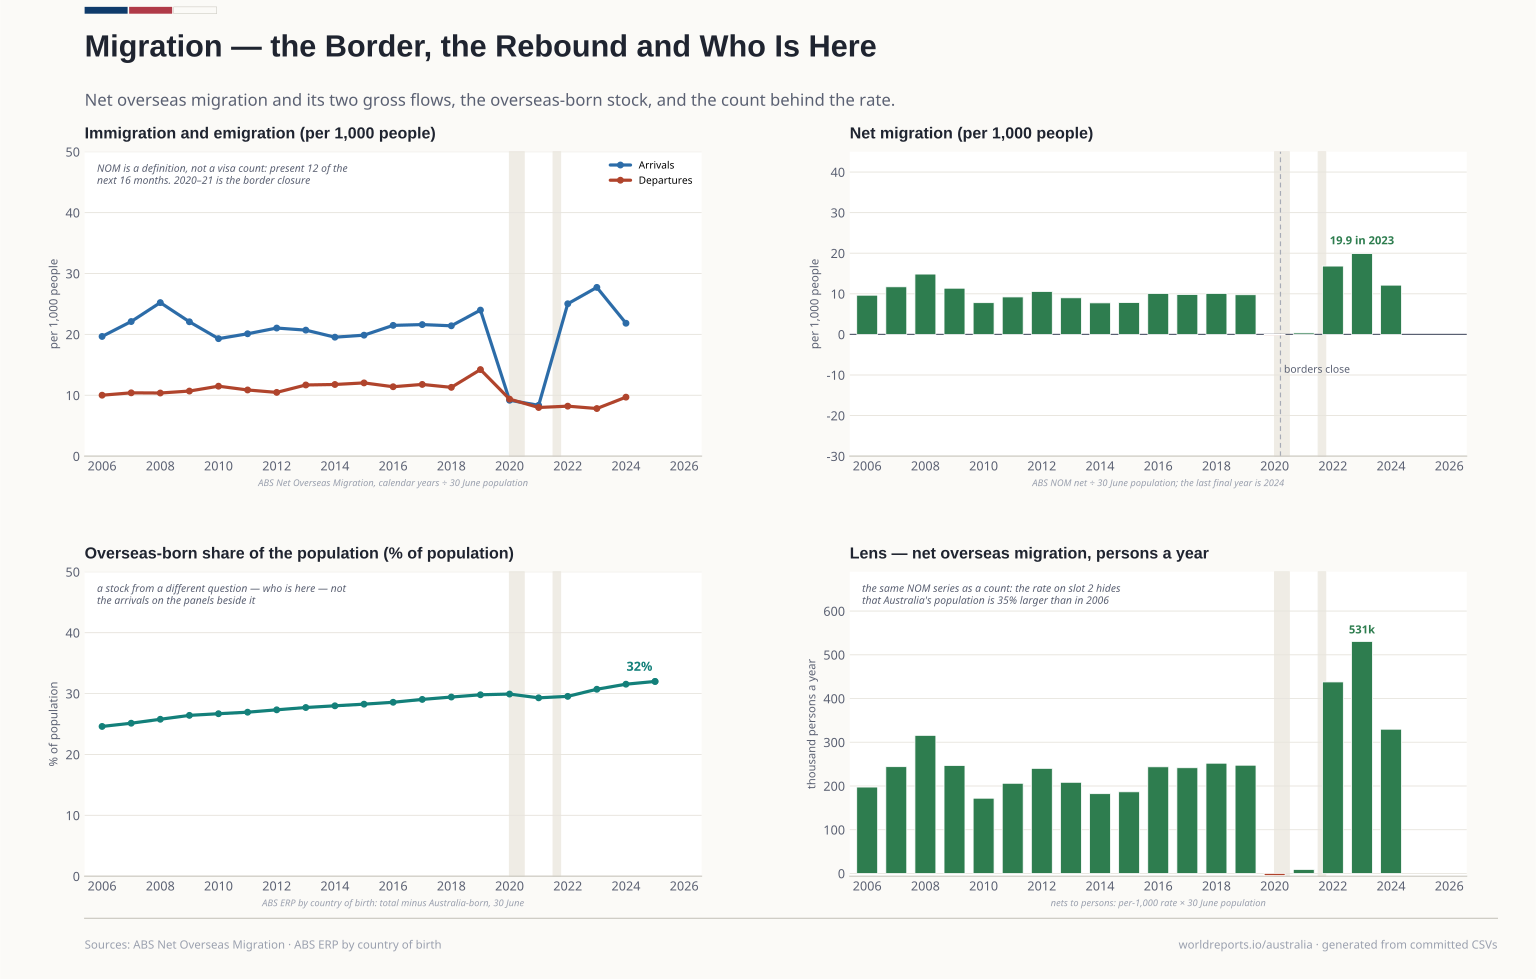
migration/migration.csv | VERIFIED 2026-10-25. Immigration (NOM arrivals) and emigration (NOM departures) per 1,000 ERP, net per 1,000 ERP, and the overseas-born share of the… | ABS Net Overseas Migration (NOM_CY, calendar years) and Estimated Resident Population by country of birth (ERP_COB) | 2006-2025 | Official |
|---|
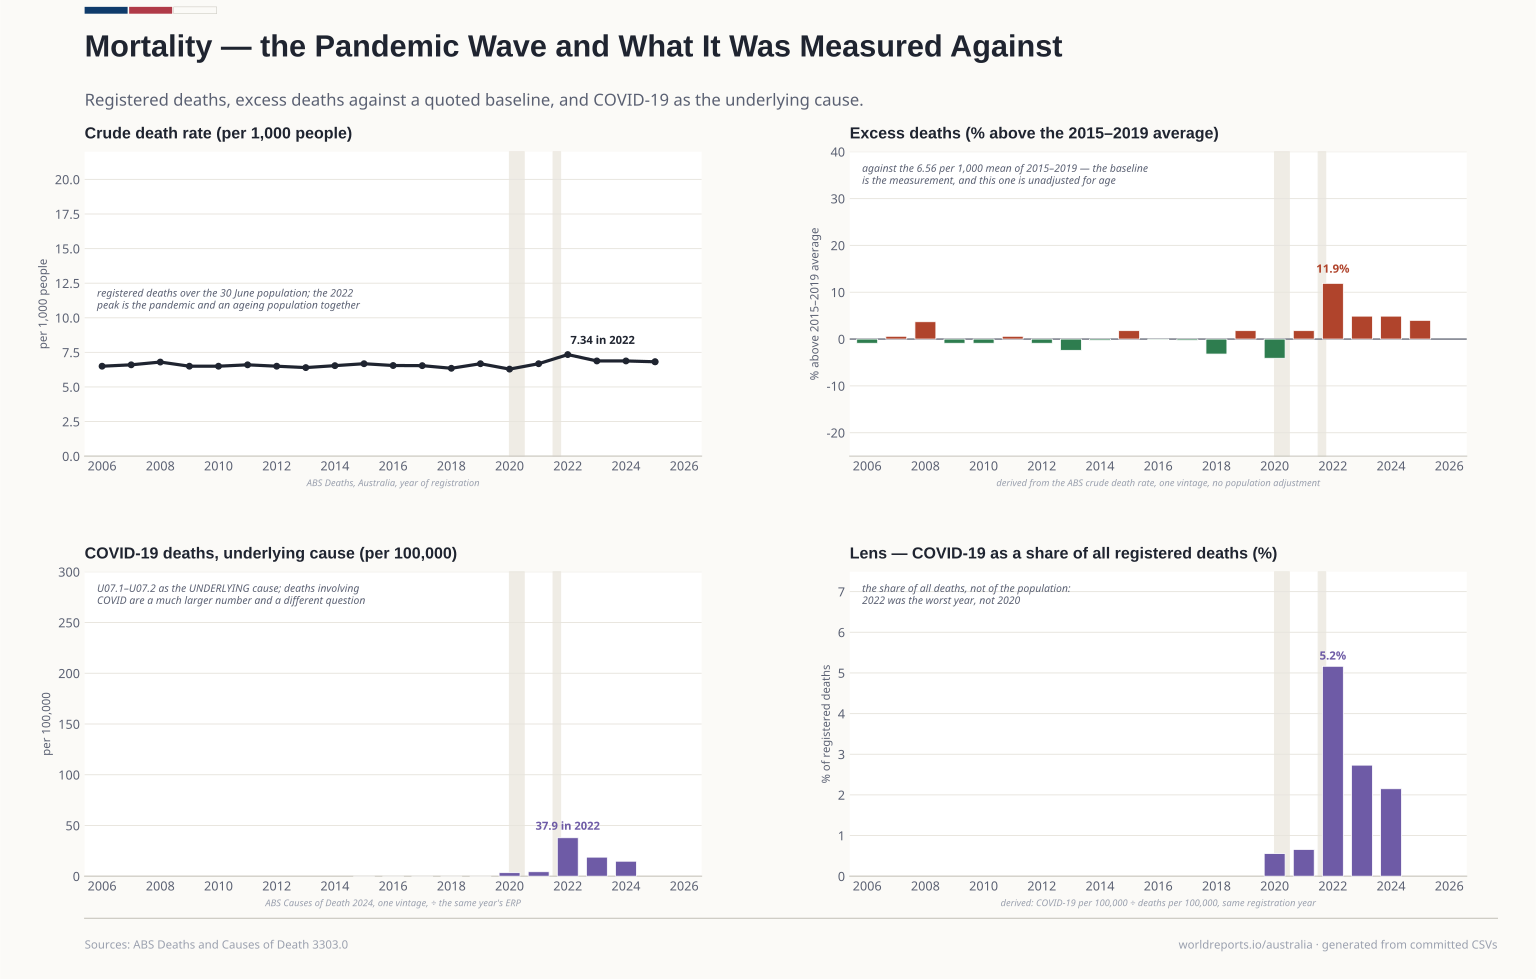
mortality/mortality.csv | VERIFIED 2026-10-25. crude_death_rate is the ABS's own rate per 1,000 (year of registration). excess_deaths_pct is DERIVED: the crude death rate… | Derived from ABS Deaths, Australia (DEATHS_SUMMARY) and Causes of Death, Australia 2024 (cat. 3303.0, Table 1.2) | 2006-2025 | Official |
|---|
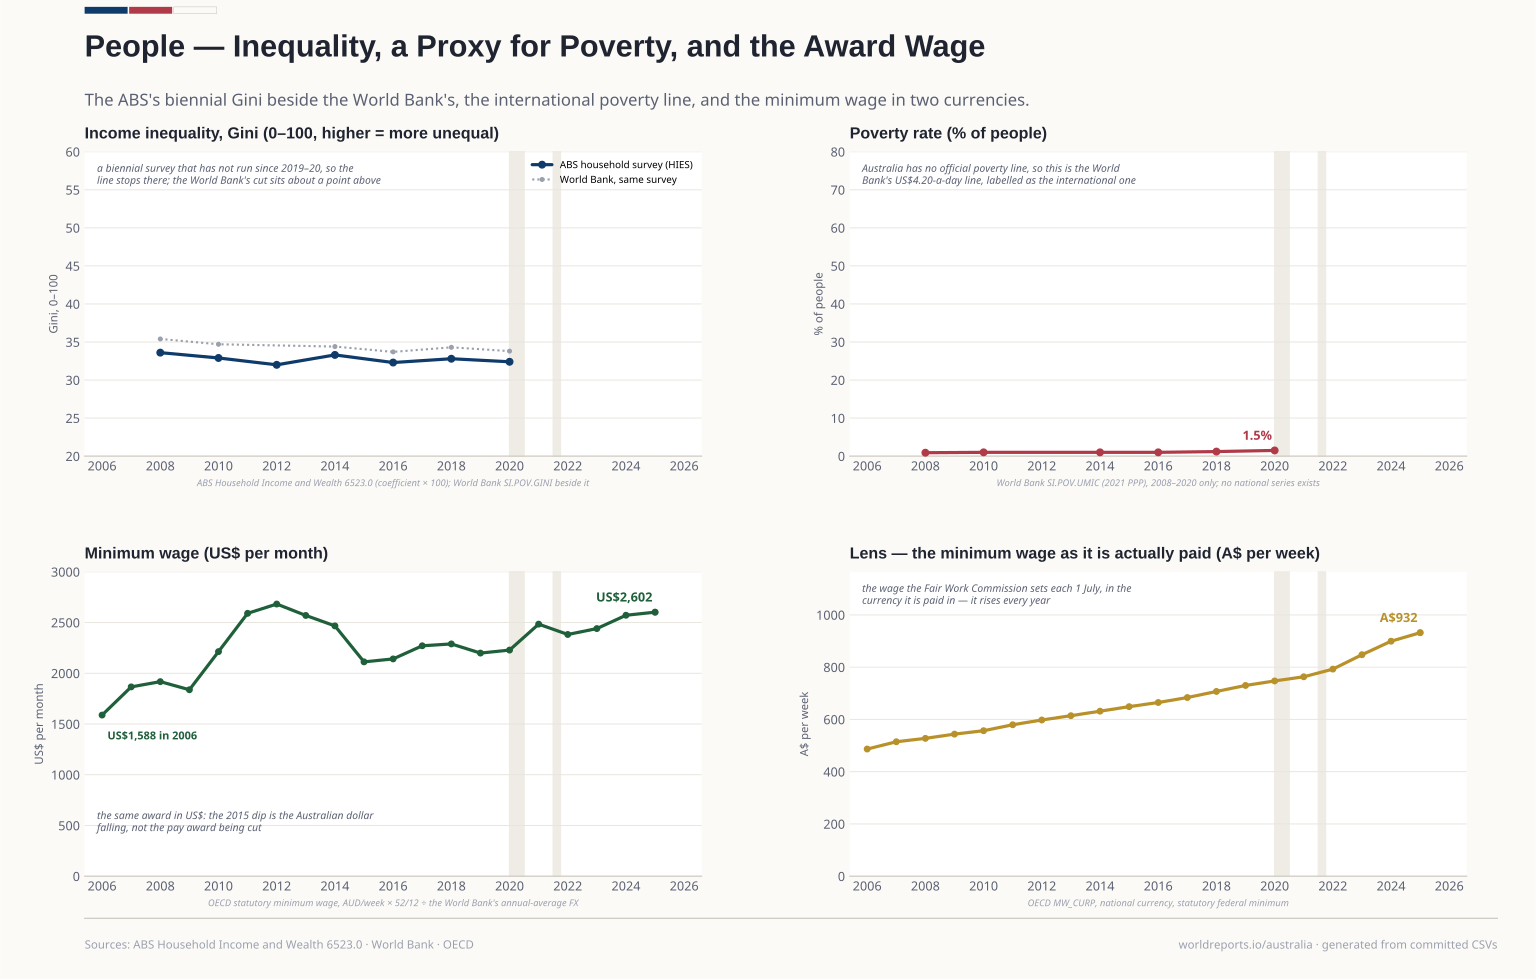
people/gini.csv | VERIFIED 2026-10-25. The national Gini is a biennial SURVEY (HIES), 2007-08 to 2019-20, and the file carries both the financial-year label and the… | ABS Household Income and Wealth, Australia (cat. 6523.0), 2019-20 — Table 1.1 Gini of equivalised disposable household income; World Bank SI.POV.GINI beside it | 2006-2025 | Official |
|---|
people/minimum_wage.csv | VERIFIED 2026-10-25. The federal minimum wage the Fair Work Commission sets each 1 July, AUD per week as the OECD records it (2025: A$931.95)… | OECD — Minimum wages at current prices in national currency (DSD_EARNINGS@MW_CURP), statutory national minimum wage, AUD per week | 2006-2025 | Official |
|---|
people/poverty.csv | VERIFIED 2026-10-25. A PROXY, and labelled as one. Australia has no official poverty line and the ABS publishes no poverty rate: the public debate… | World Bank WDI — SI.POV.UMIC (poverty headcount at $4.20 a day, 2021 PPP) | 2008-2020 | Official |
|---|
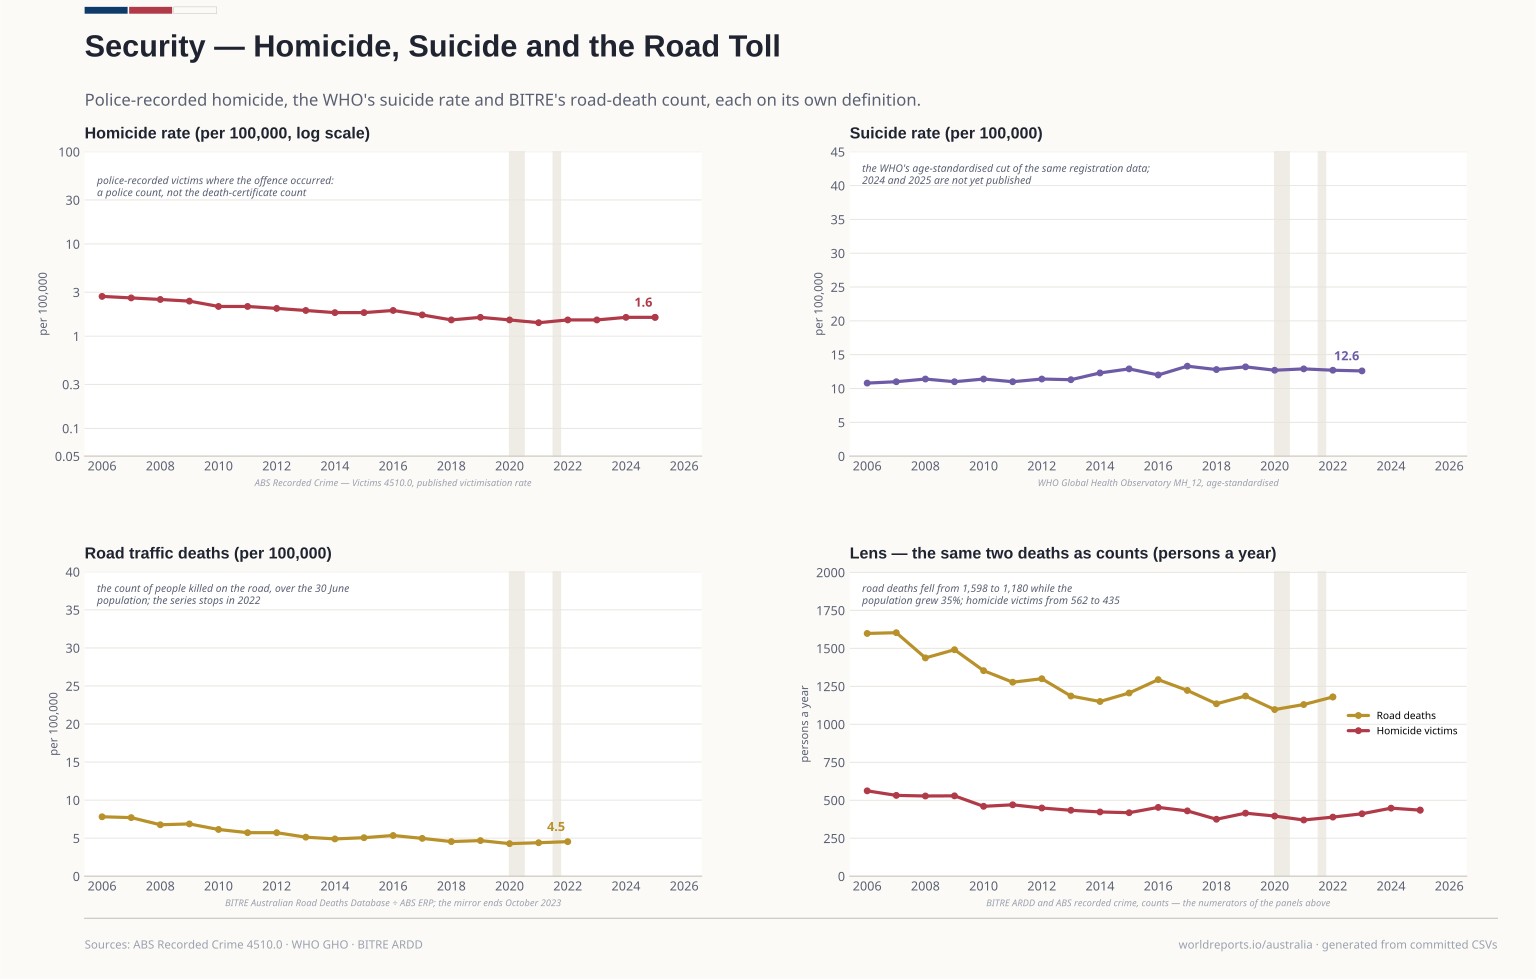
security/security.csv | VERIFIED 2026-10-25. Three publishers, three columns, each on its own definition. homicide_per_100k is the ABS's published victimisation rate… | ABS Recorded Crime — Victims (cat. 4510.0); WHO Global Health Observatory MH_12; BITRE Australian Road Deaths Database | 2006-2025 | Official |
|---|
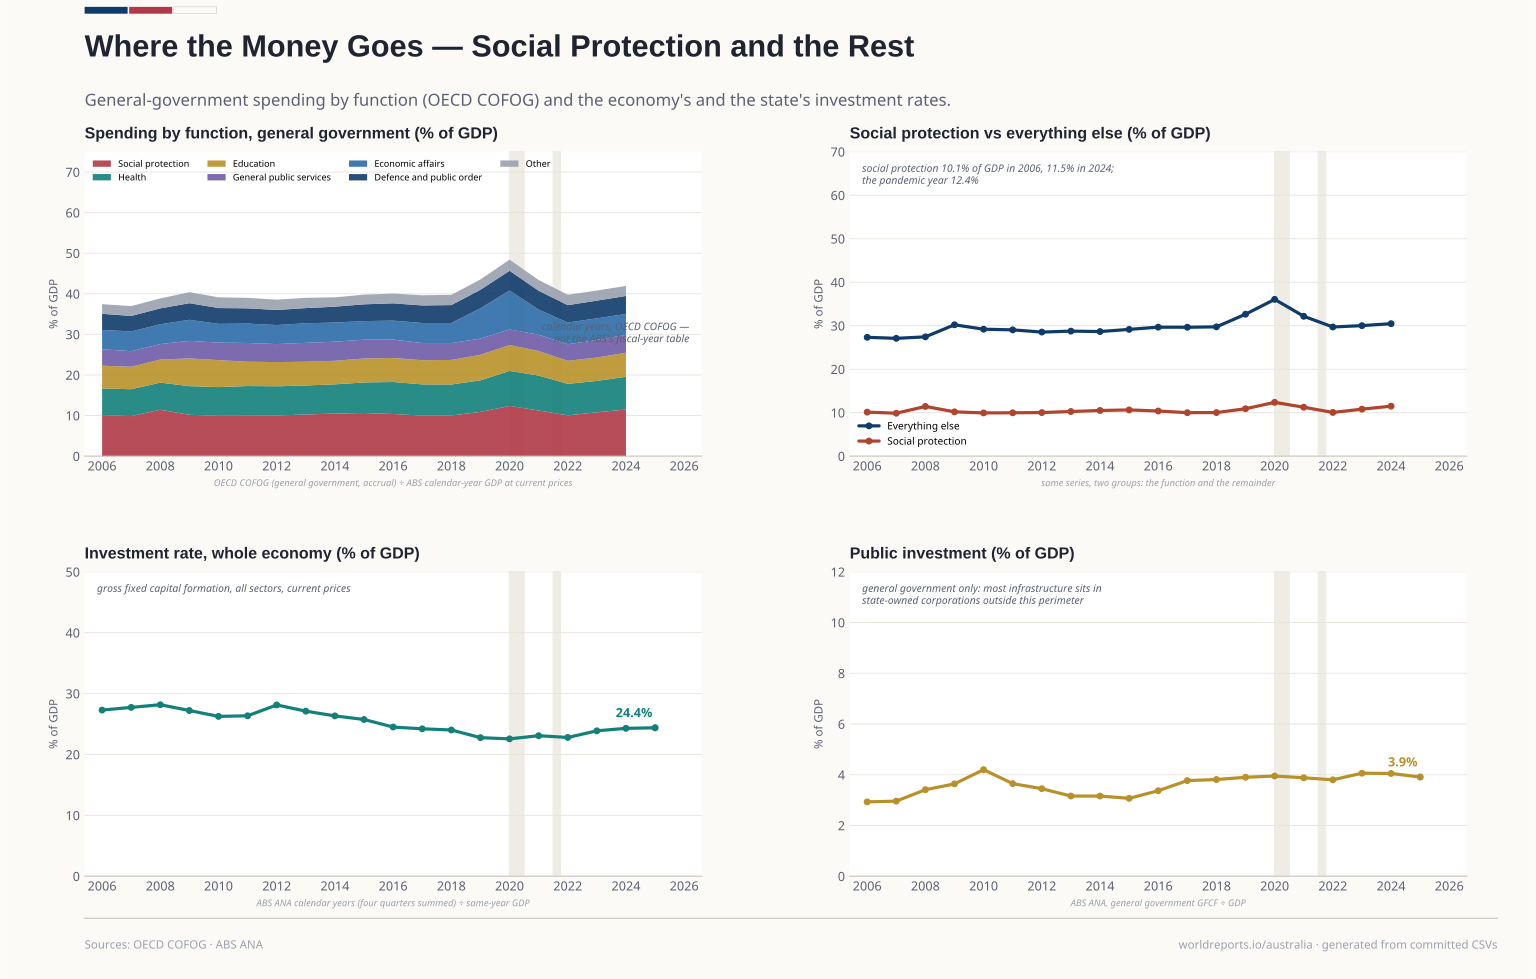
spending/cofog.csv | VERIFIED 2026-10-25, calendar years 2006-2024, general government, accrual, total expenditure per function (TRANSACTION OTE). The seven spine groups… | OECD Annual National Accounts — government expenditure by function (COFOG), SDMX DSD_NASEC10@DF_TABLE11, Australia S13 | 2006-2025 | Official |
|---|
spending/investment.csv | VERIFIED 2026-10-25. Gross fixed capital formation, current prices, as % of the same year's GDP: whole economy (all sectors) and general government… | Australian Bureau of Statistics — ANA_EXP C.GFC.SSS and C.GFC.GGS (calendar years from the quarters) | 2006-2025 | Official |
|---|
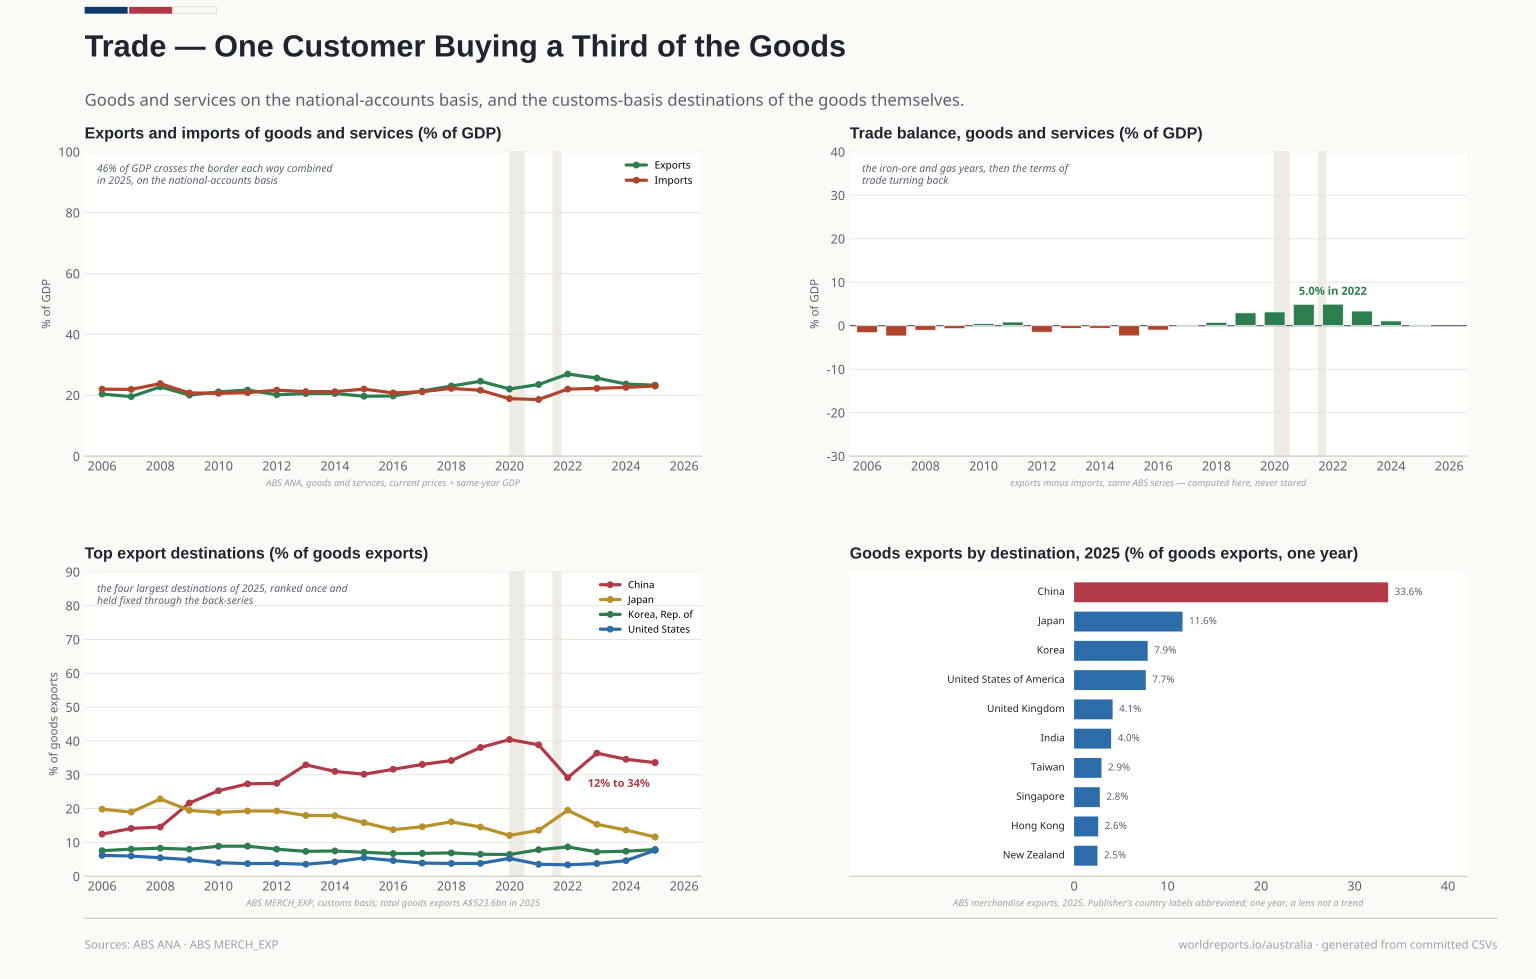
trade/destinations.csv | VERIFIED 2026-10-25. The canonical destinations panel: the four largest destinations of 2025 (China, Japan, Korea, the United States) as a share of… | Australian Bureau of Statistics — MERCH_EXP (merchandise exports by SITC and country of destination), TOT commodity, state TOT, monthly summed to calendar years | 2006-2025 | Official |
|---|
trade/destinations_2025.csv | VERIFIED 2026-10-25. One-year snapshot for the trade lens: top ten destination countries, AUD billion and % of total goods exports (total A$523.6bn… | Australian Bureau of Statistics — MERCH_EXP (merchandise exports by SITC and country of destination), TOT commodity, state TOT, monthly summed to calendar 2025 | — | Official |
|---|
trade/trade.csv | VERIFIED 2026-10-25. Exports and imports of goods AND services, national-accounts basis, current prices, as % of the same year's GDP; balance =… | Australian Bureau of Statistics — ANA_EXP C.XGS.SSS and C.MGS.SSS (calendar years from the quarters) | 2006-2025 | Official |
|---|
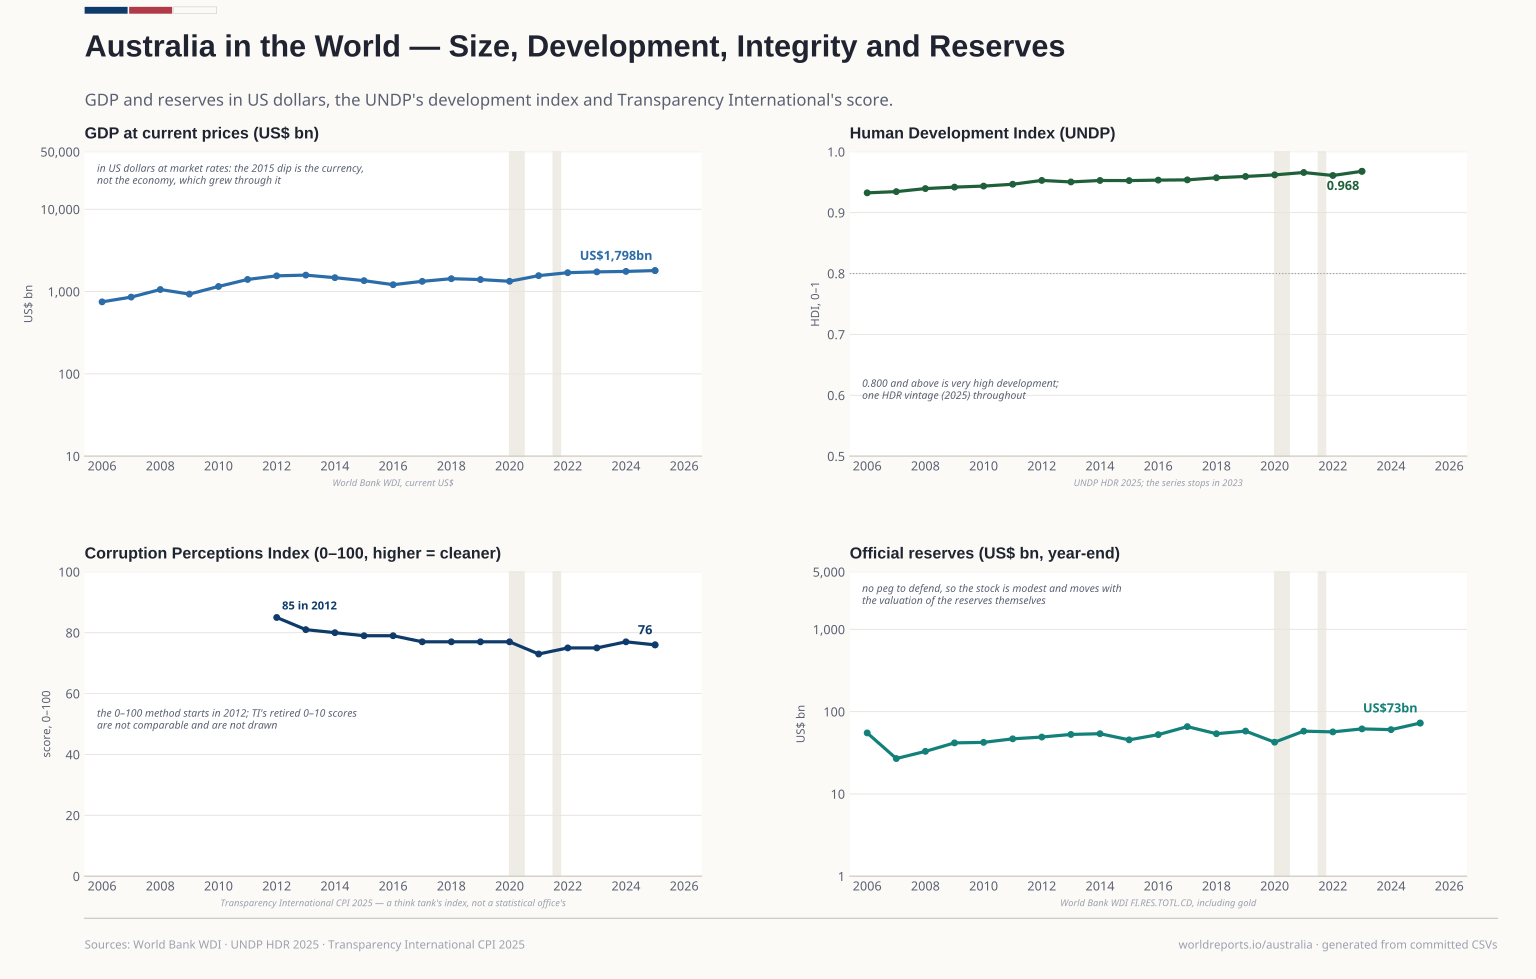
world/cpi.csv | VERIFIED 2026-10-25. The CPI is a think-tank index of expert and business perceptions, not a statistic compiled by a statistical office, so… | Transparency International — Corruption Perceptions Index 2025 workbook (CPI Historical sheet) | 2012-2025 | Other |
|---|
world/gdp_and_reserves.csv | VERIFIED 2026-10-25, current US$. GDP in US$ billion (nominal), GDP per person (US$, current) and total reserves including gold (year-end, US$… | World Bank WDI — NY.GDP.MKTP.CD, NY.GDP.PCAP.CD, FI.RES.TOTL.CD | 2006-2025 | Official |
|---|
world/hdi.csv | VERIFIED 2026-10-25, ONE vintage (HDR 2025) for the whole back-series: UNDP recomputes history at each methodology change, so a trend stitched from… | UNDP Human Development Report 2025 — composite indices, complete time series | 2006-2023 | Official |
|---|
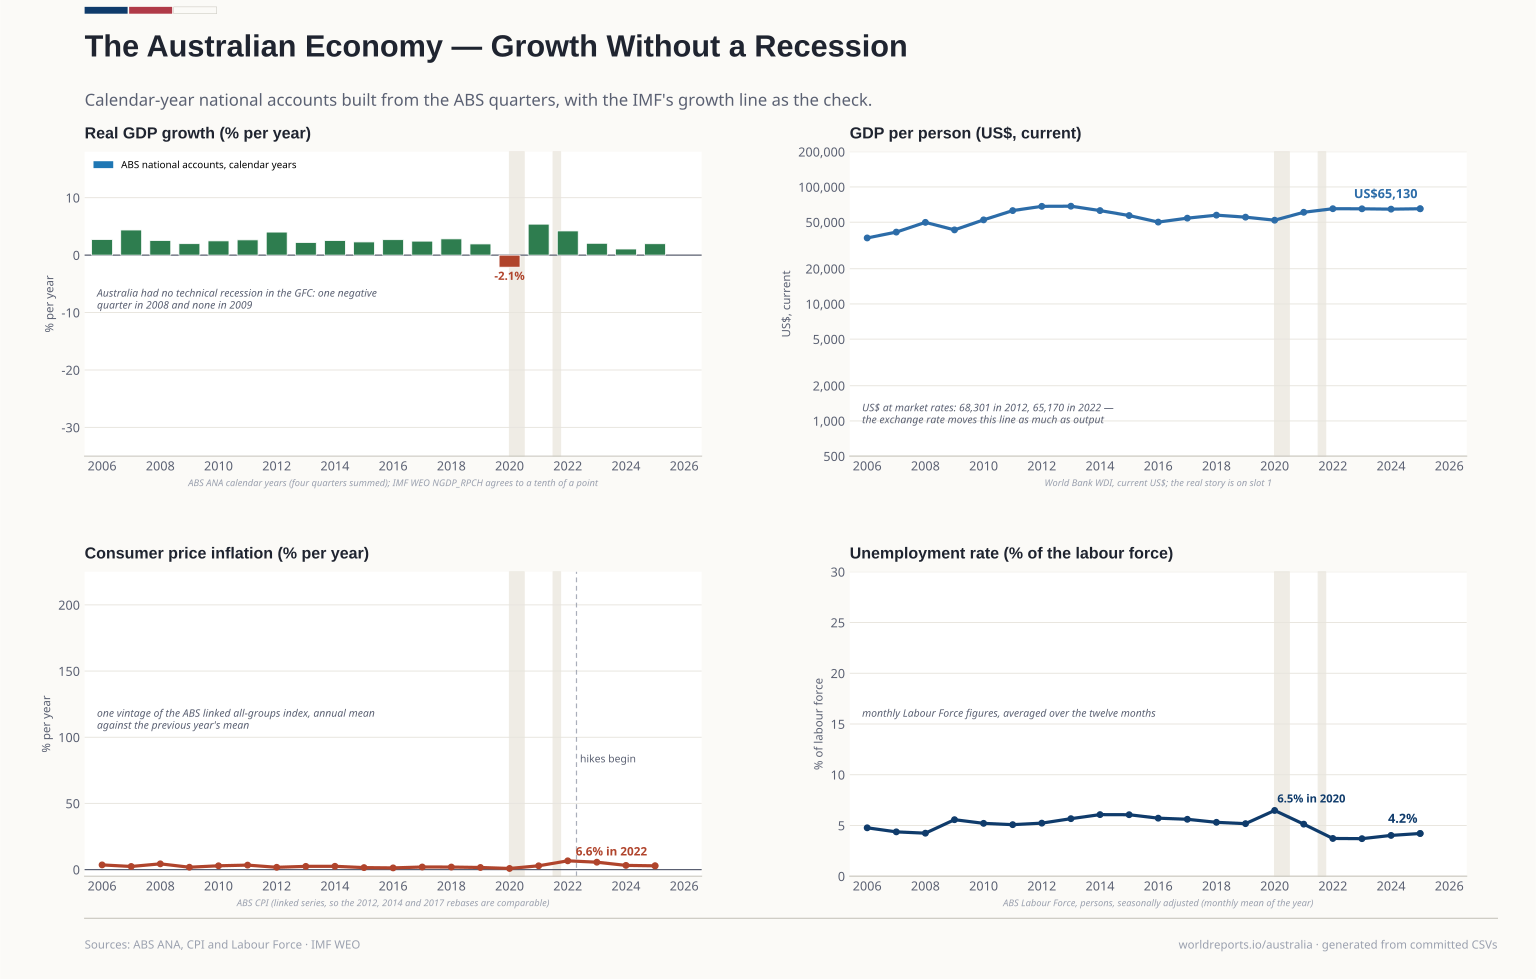 Plate 01