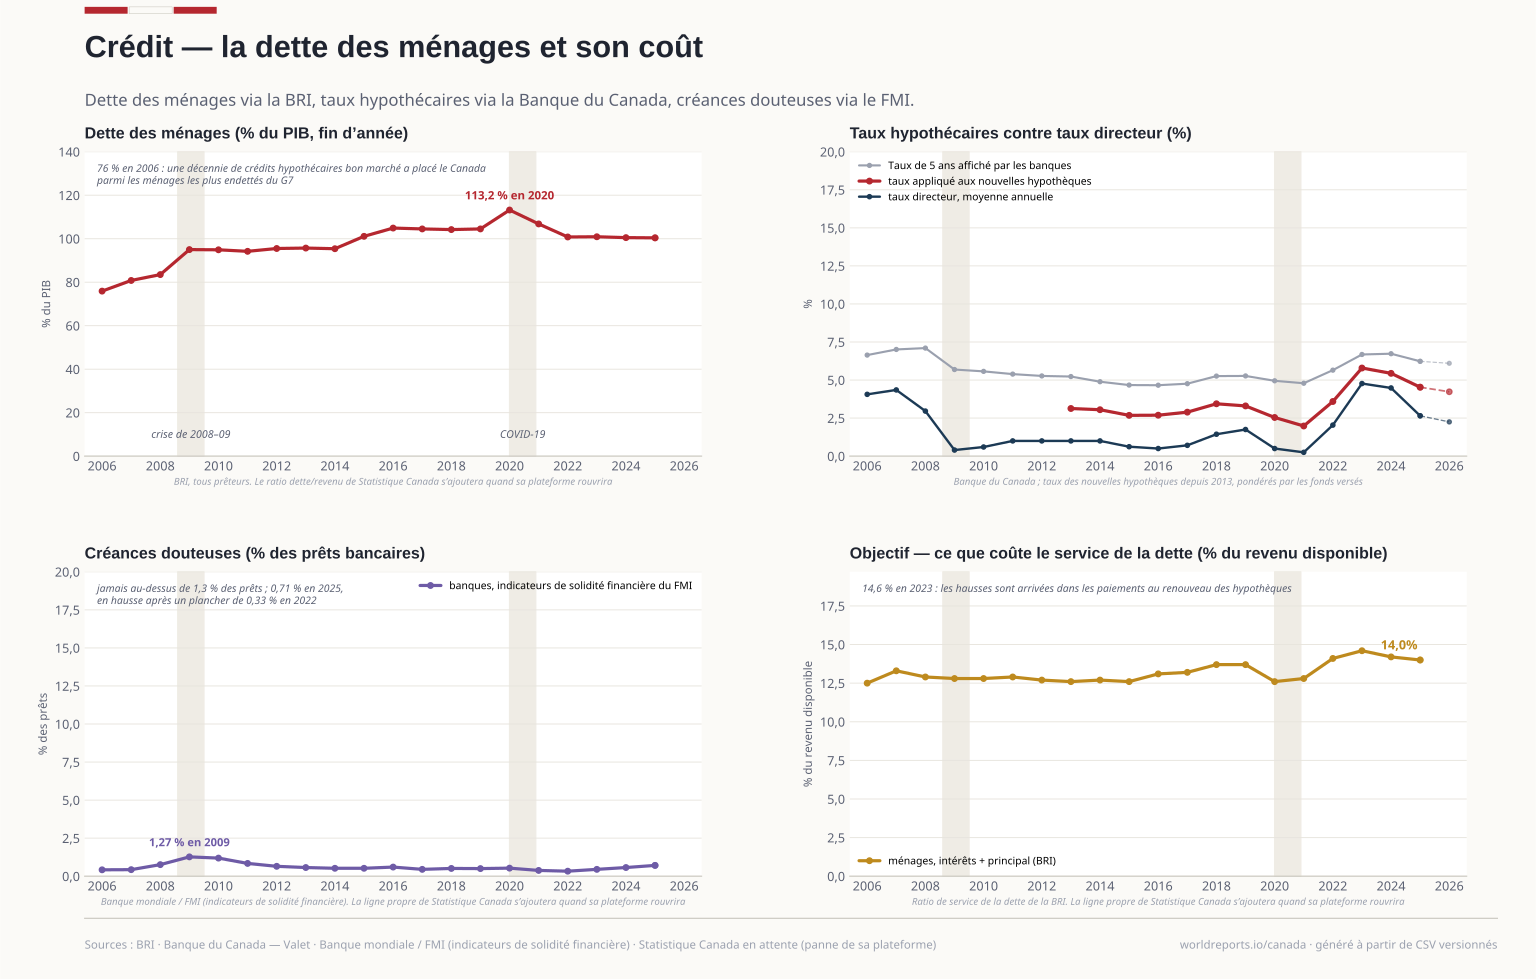
credit/debt_service.csv | Curated from the sidecar below, unchanged. Households' interest plus amortisation as % of household disposable income (the credit lens slot). A BIS… | BIS — debt service ratios, WS_DSR Q.CA.H | 2005-2026 | Autre |
|---|
credit/debt_service_from_bis.csv | Interest plus amortisation on household debt as % of household disposable income. A BIS estimate built on an assumed average maturity and the… | BIS — debt service ratios, WS_DSR Q.CA.H | 2005-2026 | Autre |
|---|
credit/debt_service_from_statcan.csv | Seasonally adjusted at annual rates only; the unadjusted column of the cube is deliberately not pulled, so the sidecar cannot be mis-spliced across… | Statistics Canada — Debt service indicators of households, national balance sheet accounts (11-10-0065) | 1990-2026 | Officiel |
|---|
credit/debt_service_statcan.csv | What households actually paid: debt service ratio (interest plus obligated principal) as % of disposable income, seasonally adjusted at annual rates… | Statistics Canada — Debt service indicators of households, national balance sheet accounts (11-10-0065) | 2005-2026 | Officiel |
|---|
credit/household_credit.csv | Curated from the sidecar below, unchanged. Credit to households and NPISHs from all lenders, % of GDP; hh_credit_pct_gdp_q4 is the year-end quarter… | BIS — total credit statistics, WS_TC Q.CA.H.A.M.770.A | 2005-2026 | Autre |
|---|
credit/household_credit_from_bis.csv | Credit to households and NPISHs from all sectors, market value, % of GDP, adjusted for breaks. hh_credit_pct_gdp_q4 is the Q4 (year- end) value the… | BIS — total credit statistics, WS_TC Q.CA.H.A.M.770.A | 2005-2026 | Autre |
|---|
credit/household_credit_from_statcan.csv | Households and NPISHs series as pulled, 1990 on, annualised by the house convention (Q4, quarter mean, quarter count). The candidate 36-10-0639 was… | Statistics Canada — Financial indicators of households and NPISHs, national balance sheet accounts (38-10-0235, CANSIM 378-0123) | 1990-2026 | Officiel |
|---|
credit/household_credit_statcan.csv | Credit market debt to DISPOSABLE INCOME (a ratio near 170, not a per cent of GDP near 100 — different denominators, both correct). Seasonally… | Statistics Canada — Financial indicators of households and NPISHs, national balance sheet accounts (38-10-0235, CANSIM 378-0123) | 2005-2026 | Officiel |
|---|
credit/mortgage_rates.csv | Curated from the sidecar below, unchanged. The 5-year rate the major banks post (annual mean of the weekly series — few borrowers pay it) beside the… | Bank of Canada — Valet (V80691335; V122667775/V12266781 and V122667724/V122667730, funds advanced) | 2005-2026 | Officiel |
|---|
credit/mortgage_rates_from_boc.csv | The posted rate is what the banks advertise; the new-mortgage rate is what borrowers sign, computed from the insured (V82) and uninsured (V81) rates… | Bank of Canada — Valet (V80691335; V122667775/V12266781 and V122667724/V122667730, funds advanced) | 2005-2026 | Officiel |
|---|
credit/npl.csv | Curated from the sidecar below, unchanged. Bank non-performing loans as % of gross loans, IMF FSI via the World Bank. The definition is the IMF's… | World Bank — WDI FB.AST.NPER.ZS (IMF Financial Soundness Indicators) | 2005-2025 | Autre |
|---|
credit/npl_from_wb.csv | | World Bank — WDI FB.AST.NPER.ZS (IMF Financial Soundness Indicators) | 2005-2025 | Autre |
|---|
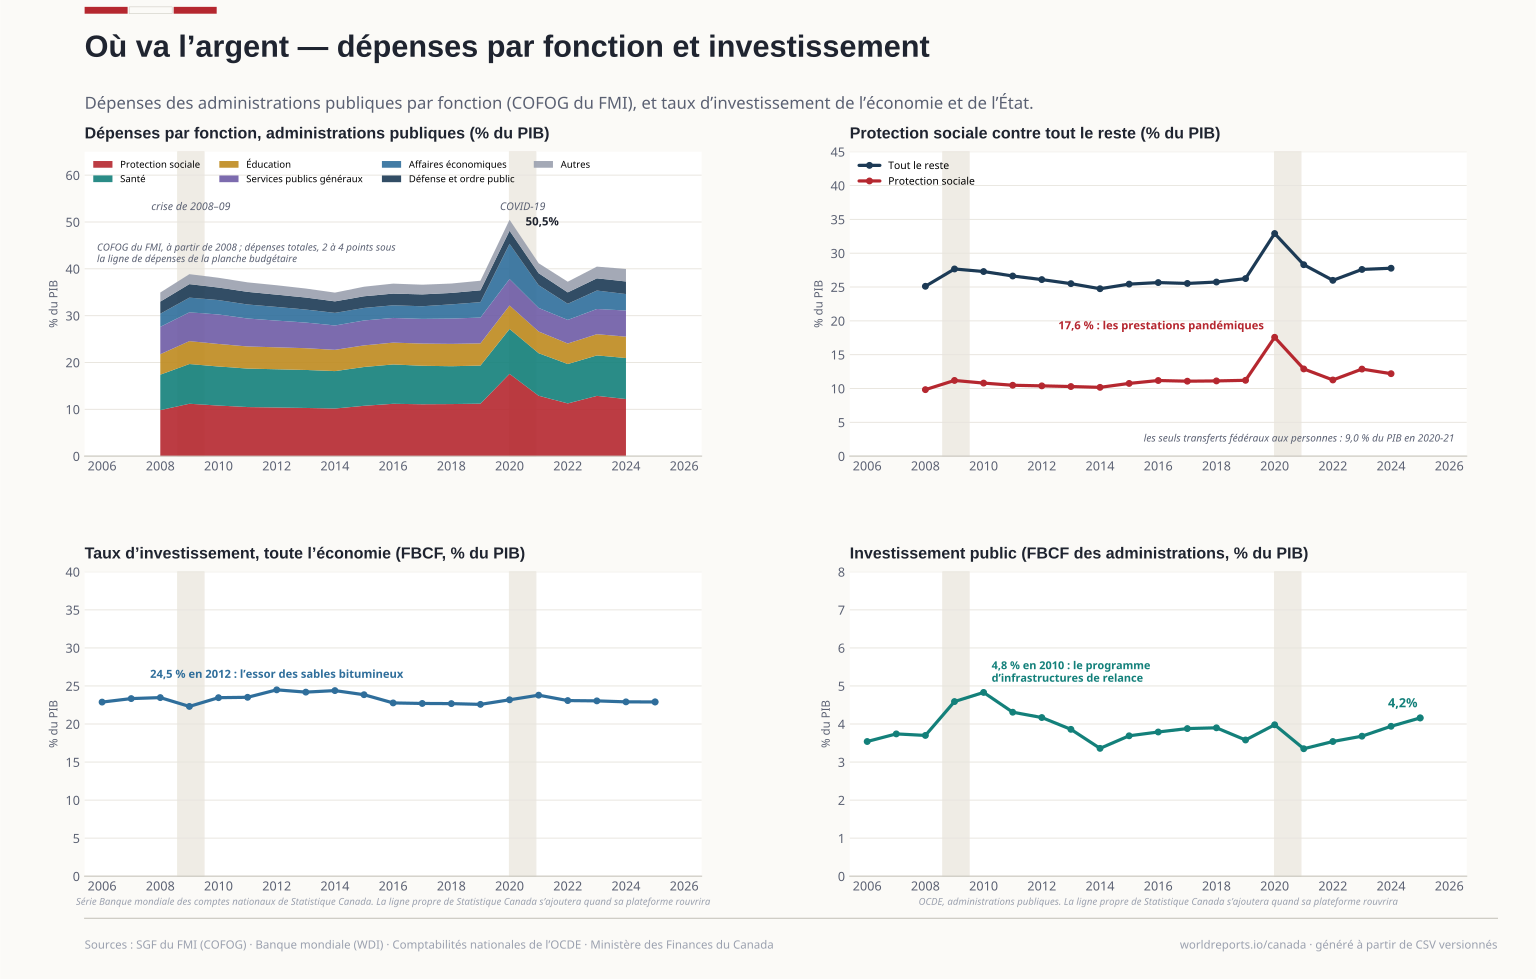
fiscal/cofog.csv | Curated from the sidecar below, unchanged. General-government (S13) outlays by the ten COFOG divisions, % of GDP, calendar years. 2008 onward only… | IMF — Government Finance Statistics, expenditure by function (COFOG), flow GFS_COFOG, series CAN.S13....A | 2008-2024 | Autre |
|---|
fiscal/cofog_from_imf.csv | The fetcher requires the ten divisions to add up to the published total within 0.1 point before writing, per year. Statistics Canada's own functional… | IMF — Government Finance Statistics, expenditure by function (COFOG), flow GFS_COFOG, series CAN.S13....A | 2008-2024 | Autre |
|---|
fiscal/expenses_pct_gdp.csv | Curated from the sidecar below, unchanged. Federal expense by category, % of GDP, fiscal years; the 2020-21 pandemic spike is real (see the sidecar… | Department of Finance Canada — Fiscal Reference Tables, November 2025, table 8 | — | Officiel |
|---|
fiscal/expenses_pct_gdp_from_frt.csv | Federal expense by category, per cent of GDP, fiscal years. The 2020-21 figure of 27.4% for program expenses is real: it is the pandemic benefits… | Department of Finance Canada — Fiscal Reference Tables, November 2025, table 8 | — | Officiel |
|---|
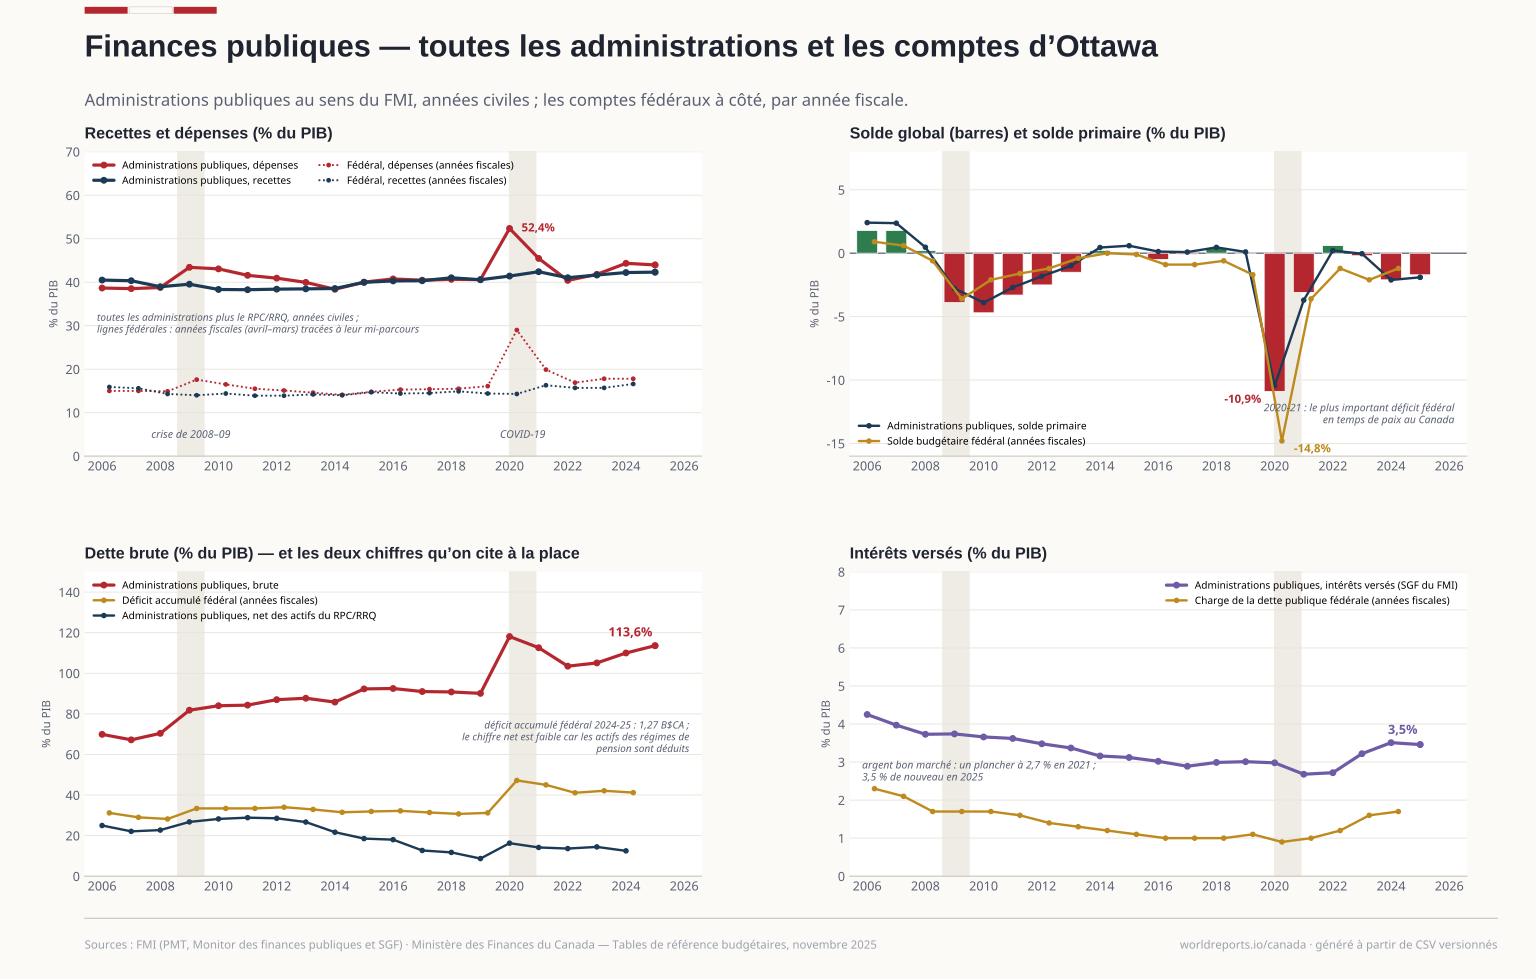
fiscal/general_government.csv | Curated from the sidecar below, unchanged. The canonical fiscal slot: GENERAL government (federal, provincial, territorial, local and the CPP/QPP)… | IMF — World Economic Outlook and Fiscal Monitor, via DataMapper | 2005-2025 | Autre |
|---|
fiscal/general_government_from_imf.csv | General government, % of GDP, calendar years. Balance and gross debt are WEO indicators; revenue, expenditure and the primary balance are not WEO… | IMF — World Economic Outlook and Fiscal Monitor, via DataMapper (GGR_G01_GDP_PT (Fiscal Monitor), G_X_G01_GDP_PT (Fiscal Monitor), GGXCNL_NGDP (WEO), GGXONLB_G01_GDP_PT (Fiscal Monitor), GGXWDG_NGDP (WEO)) | 2005-2025 | Autre |
|---|
fiscal/gfs_operations.csv | Curated from the sidecar below, unchanged. interest_payable is GFS item 24, general government, % of GDP — the canonical fiscal slot 4 series… | IMF — Government Finance Statistics, statement of operations, flow GFS_SOO, series CAN.S13....A | 2005-2025 | Autre |
|---|
fiscal/gfs_operations_from_imf.csv | | IMF — Government Finance Statistics, statement of operations, flow GFS_SOO, series CAN.S13....A | 2005-2025 | Autre |
|---|
fiscal/liabilities.csv | Curated from the sidecar below; only the float formatting was cleaned (the sidecar wrote e-notation), the numbers are unchanged. Millions of current… | Department of Finance Canada — Fiscal Reference Tables, November 2025, table 15 | — | Officiel |
|---|
fiscal/liabilities_from_frt.csv | Millions of current dollars, fiscal years, FEDERAL only. The accumulated deficit is what Canadian budget documents call "the federal debt"; net_debt… | Department of Finance Canada — Fiscal Reference Tables, November 2025, table 15 | — | Officiel |
|---|
fiscal/public_investment.csv | Curated from the sidecar below, unchanged. General-government gross fixed capital formation, % of GDP (spending slot 4). | OECD — National Accounts at a Glance, chapter 6, measure P51GS13 | 2005-2025 | Autre |
|---|
fiscal/public_investment_from_oecd.csv | gov_gfcf_pct_gdp: general-government gross fixed capital formation, % of GDP (spending slot 4). | OECD — National Accounts at a Glance, chapter 6, OECD.SDD.NAD,DSD_NAAG_VI@DF_NAAG_VI, measure P51GS13 | 2005-2025 | Autre |
|---|
fiscal/revenues_pct_gdp.csv | Curated from the sidecar below, unchanged. Federal revenue by source, % of GDP, fiscal years; pollution-pricing proceeds omitted (see the sidecar… | Department of Finance Canada — Fiscal Reference Tables, November 2025, table 4 | — | Officiel |
|---|
fiscal/revenues_pct_gdp_from_frt.csv | Federal revenue by source, per cent of GDP, fiscal years. The pollution-pricing column is omitted: the proceeds are returned to Canadians and appear… | Department of Finance Canada — Fiscal Reference Tables, November 2025, table 4 | — | Officiel |
|---|
fiscal/transactions_pct_gdp.csv | Curated from the sidecar below, unchanged. Federal government, fiscal years (fiscal_year is the starting year). The actuarial split columns are empty… | Department of Finance Canada — Fiscal Reference Tables, November 2025, table 2 | — | Officiel |
|---|
fiscal/transactions_pct_gdp_from_frt.csv | FEDERAL government, FISCAL years. `fiscal_year` holds the starting year: 2024 is 1 April 2024 to 31 March 2025. Never plotted against a calendar… | Department of Finance Canada — Fiscal Reference Tables, November 2025, table 2 | — | Officiel |
|---|
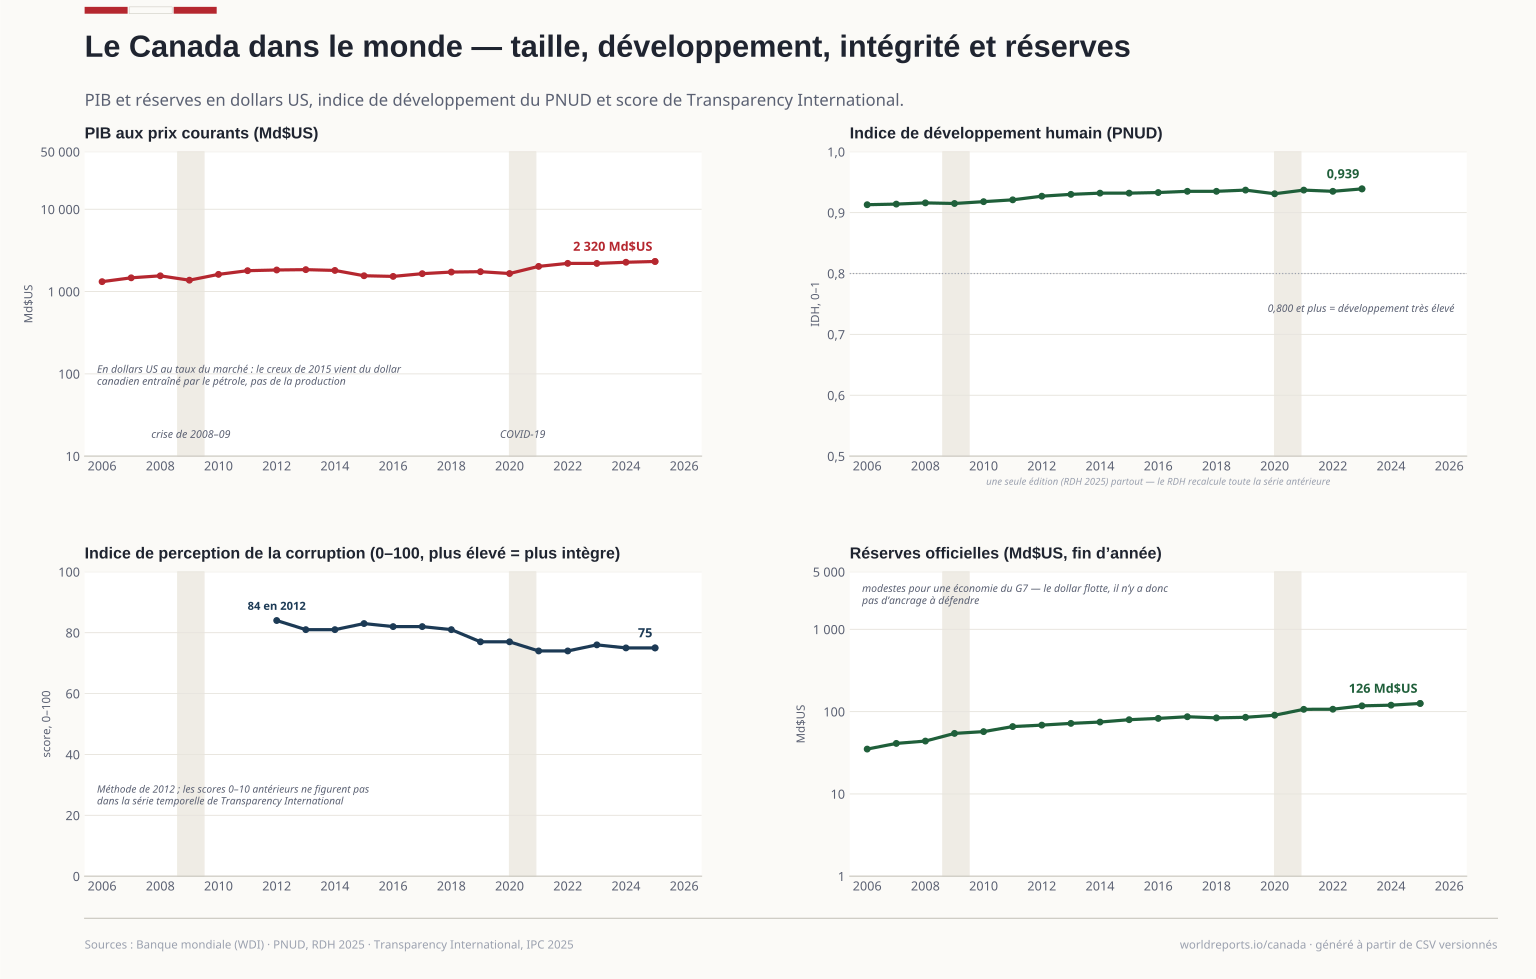
international/cpi.csv | Curated from the sidecar below, unchanged. The world slot 3 score: 0–100 on the method introduced in 2012. Earlier scores are 0–10 and are not in… | Transparency International — Corruption Perceptions Index, 2025 edition results and trends | 2012-2025 | Officiel |
|---|
international/cpi_from_ti.csv | Read from the results-and-trends workbook, the whole time series of one edition so the vintage never changes under the plate. The workbook carries… | Transparency International — Corruption Perceptions Index, 2025 edition results and trends | 2012-2025 | Officiel |
|---|
international/g7_balance.csv | Curated from the sidecar below, unchanged. GENERAL government on the national-accounts basis, CALENDAR years — comparable across the G7, incomparable… | IMF, redistributed by the Department of Finance Canada — Fiscal Reference Tables, table 53 | 1980-2024 | Officiel |
|---|
international/g7_balance_from_frt.csv | GENERAL government — federal, provincial, territorial, local and the CPP/QPP — on the national-accounts basis, CALENDAR years, which is what makes it… | IMF, redistributed by the Department of Finance Canada — Fiscal Reference Tables, table 53 | 1980-2024 | Officiel |
|---|
international/g7_gross_debt.csv | Curated from the sidecar below, unchanged. The same countries on the gross measure; the pair with the net file is the point. | IMF, via Fiscal Reference Tables 2025, table 55 | 1980-2024 | Officiel |
|---|
international/g7_gross_debt_from_frt.csv | The same countries on the gross measure, where Canada reads about 111% of GDP. Both are correct; the pair is the point. | IMF, via Fiscal Reference Tables 2025, table 55 | 1980-2024 | Officiel |
|---|
international/g7_net_debt.csv | Curated from the sidecar below, unchanged. Net of CPP/QPP assets; drawn beside the gross series, never alone. | IMF, via Fiscal Reference Tables 2025, table 54 | 1980-2024 | Officiel |
|---|
international/g7_net_debt_from_frt.csv | Canada's net debt reads about 12% of GDP against a G7 average near 93%, and the gap is not an achievement: the net measure nets off the assets of the… | IMF, via Fiscal Reference Tables 2025, table 54 | 1980-2024 | Officiel |
|---|
international/gdp_pc.csv | Curated from the sidecar below, unchanged. Current US$ per person, harmonised across countries. | World Bank — NY.GDP.PCAP.CD | 2005-2025 | Autre |
|---|
international/gdp_pc_from_wb.csv | | World Bank — NY.GDP.PCAP.CD | 2005-2025 | Autre |
|---|
international/gdp_usd.csv | Curated from the sidecar below, unchanged. A harmonised cross-country series, not Canada's own national accounts. | World Bank — World Development Indicators, NY.GDP.MKTP.CD | 2005-2025 | Autre |
|---|
international/gdp_usd_from_wb.csv | A harmonised cross-country series, not Canada's own national accounts. Kept as the comparables layer and as a magnitude check on the Statistics… | World Bank — World Development Indicators, NY.GDP.MKTP.CD | 2005-2025 | Autre |
|---|
international/hdi.csv | Curated from the sidecar below, unchanged. One vintage throughout; the HDR recomputes the whole back-series at each methodology change, so a trend… | UNDP — Human Development Report 2025, composite indices complete time series | 2005-2023 | Autre |
|---|
international/hdi_from_undp.csv | One file, one vintage, every year. The HDI is recomputed for the whole back-series at each methodology change, so a trend assembled from successive… | UNDP — Human Development Report 2025, composite indices complete time series | 2005-2023 | Autre |
|---|
international/openness.csv | Curated from the sidecar below, unchanged. Exports plus imports of goods and services as a share of GDP. | World Bank — NE.TRD.GNFS.ZS | 2005-2025 | Autre |
|---|
international/openness_from_wb.csv | | World Bank — NE.TRD.GNFS.ZS | 2005-2025 | Autre |
|---|
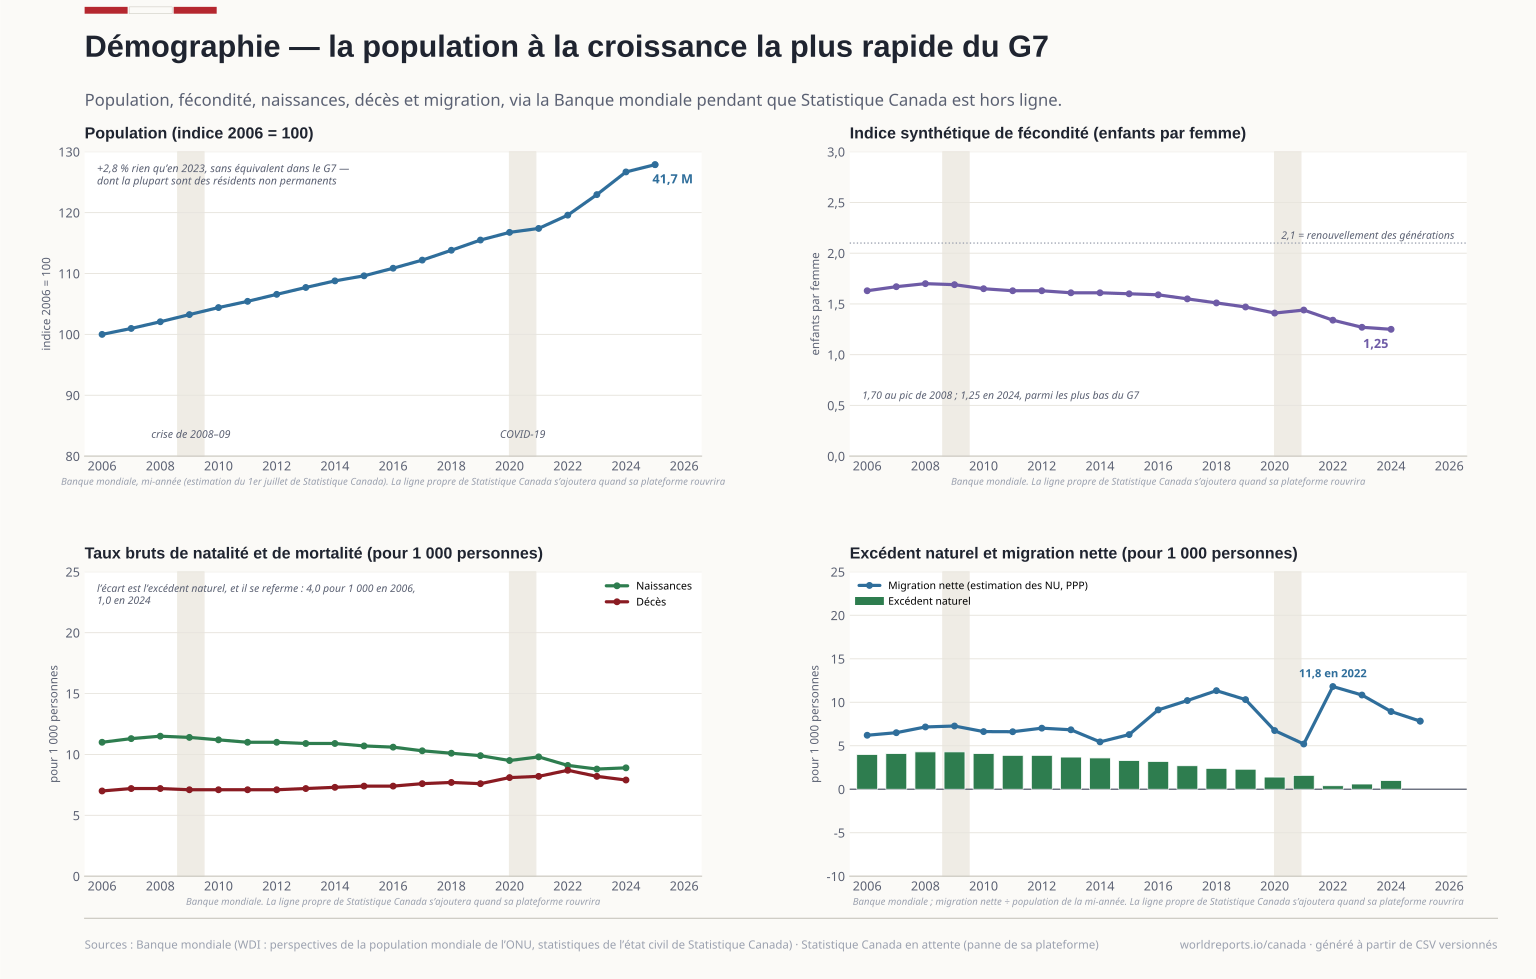
international/population.csv | Curated from the sidecar below, unchanged. Cross-check only: the population series of record is Statistics Canada's quarterly demographic estimate… | World Bank — SP.POP.TOTL | 2005-2025 | Autre |
|---|
international/population_from_wb.csv | The curated population series is Statistics Canada's quarterly demographic estimate, which is the only one that separates non-permanent residents… | World Bank — SP.POP.TOTL | 2005-2025 | Autre |
|---|
international/reserves.csv | Curated from the sidecar below, unchanged. Total reserves including gold, current US$, year-end. | World Bank — FI.RES.TOTL.CD (IMF IFS) | 2005-2025 | Autre |
|---|
international/reserves_from_wb.csv | | World Bank — FI.RES.TOTL.CD (IMF IFS) | 2005-2025 | Autre |
|---|
macro/economy.csv | Curated from the sidecar below, unchanged. Whole-economy GFCF (spending slot 3) and the ILO modelled unemployment estimate (economy slot 4)… | World Bank — World Development Indicators (NE.GDI.FTOT.ZS, SL.UEM.TOTL.ZS) | 2005-2025 | Autre |
|---|
macro/economy_from_statcan.csv | As pulled, full history from each table's start: real growth, current-dollar GDP (the denominator the trade ratios divide by), the all-items CPI… | Statistics Canada — GDP expenditure-based (36-10-0699), CPI annual average (18-10-0005), Labour Force Survey (14-10-0327) | 1961-2025 | Officiel |
|---|
macro/economy_from_wb.csv | gfcf_pct_gdp is whole-economy gross fixed capital formation, % of GDP (spending slot 3). unemployment_pct is the ILO modelled estimate, % of the… | World Bank — World Development Indicators (NE.GDI.FTOT.ZS, SL.UEM.TOTL.ZS) | 2005-2025 | Autre |
|---|
macro/economy_statcan.csv | The national line beside the World Bank series in economy.csv and growth_prices.csv: real GDP growth at chained-FCE2017 percentage change, CPI… | Statistics Canada — GDP expenditure-based (36-10-0699), CPI annual average (18-10-0005), Labour Force Survey (14-10-0327) | 2005-2025 | Officiel |
|---|
macro/growth_prices.csv | Curated from the sidecar below, unchanged. Real GDP growth and CPI inflation, annual average. Both are Statistics Canada's own figures as… | World Bank — World Development Indicators (NY.GDP.MKTP.KD.ZG, FP.CPI.TOTL.ZG) | 2005-2025 | Autre |
|---|
macro/growth_prices_from_wb.csv | | World Bank — World Development Indicators (NY.GDP.MKTP.KD.ZG, FP.CPI.TOTL.ZG) | 2005-2025 | Autre |
|---|
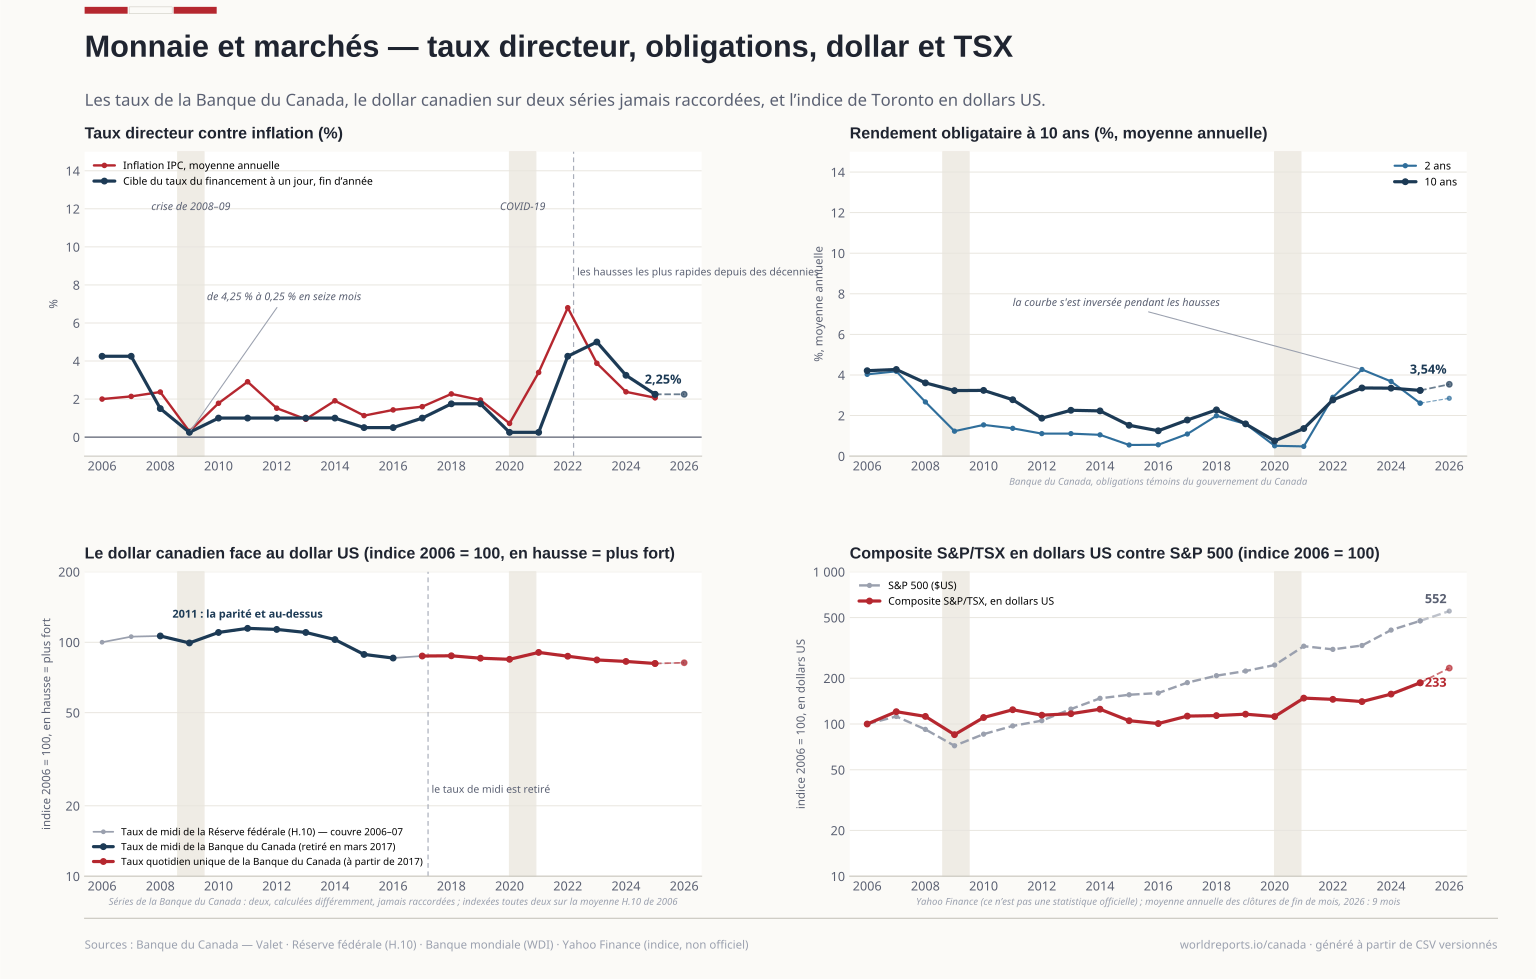
markets/equities.csv | Curated from the sidecar below, unchanged. NOT AN OFFICIAL STATISTIC: no official body publishes an equity index, so this is a redistributor feed… | Yahoo Finance — S&P/TSX composite (^GSPTSE) and S&P 500 (^GSPC), monthly closes | 2005-2026 | Autre |
|---|
markets/equities_from_yahoo.csv | Monthly closes as pulled, with the month count per year. A redistributor: a revision at Yahoo would move a plate, which is why the curated file is… | Yahoo Finance — S&P/TSX composite (^GSPTSE) and S&P 500 (^GSPC), monthly closes | 2005-2026 | Autre |
|---|
markets/rates.csv | Curated from the sidecar below, unchanged. Target for the overnight rate (year-end and annual average) from the monthly static table, the realised… | Bank of Canada — Valet (STATIC_ATABLE_V39079, V122514, BD.CDN.*.DQ.YLD) | 2006-2026 | Officiel |
|---|
markets/rates_from_boc.csv | target_rate_eoy / target_rate_avg: the target for the overnight rate, taken from the monthly static table rather than from V39079, the business-daily… | Bank of Canada — Valet (STATIC_ATABLE_V39079, V122514, BD.CDN.*.DQ.YLD) | 2006-2026 | Officiel |
|---|
markets/usdcad.csv | Curated from the sidecar below, unchanged: two columns kept as two columns, partial-coverage years blank with their coverage in the *_months columns… | Bank of Canada — USD noon rate (IEXE0101) and USD daily rate (FXUSDCAD) | 2006-2026 | Officiel |
|---|
markets/usdcad_from_boc.csv | TWO COLUMNS, NEVER ONE. The Bank retired the noon rate on 2017-03-01 and replaced it with a single indicative rate published at 16:30, computed… | Bank of Canada — USD noon rate (IEXE0101) and USD daily rate (FXUSDCAD) | 2006-2026 | Officiel |
|---|
markets/usdcad_from_fed.csv | Averaged from the daily rows by year and by month; the coverage columns say what each annual figure is built from. A U.S. Federal Reserve… | Federal Reserve — H.10 daily foreign exchange rates, Canada (noon buying rate in New York) | 2005-2026 | Officiel |
|---|
markets/usdcad_h10.csv | Curated from the sidecar below, unchanged. The annual mean of the daily noon buying rate, C$ per US$, with days and months saying how much of each… | Federal Reserve — H.10 daily foreign exchange rates, Canada (noon buying rate in New York) | 2005-2026 | Officiel |
|---|
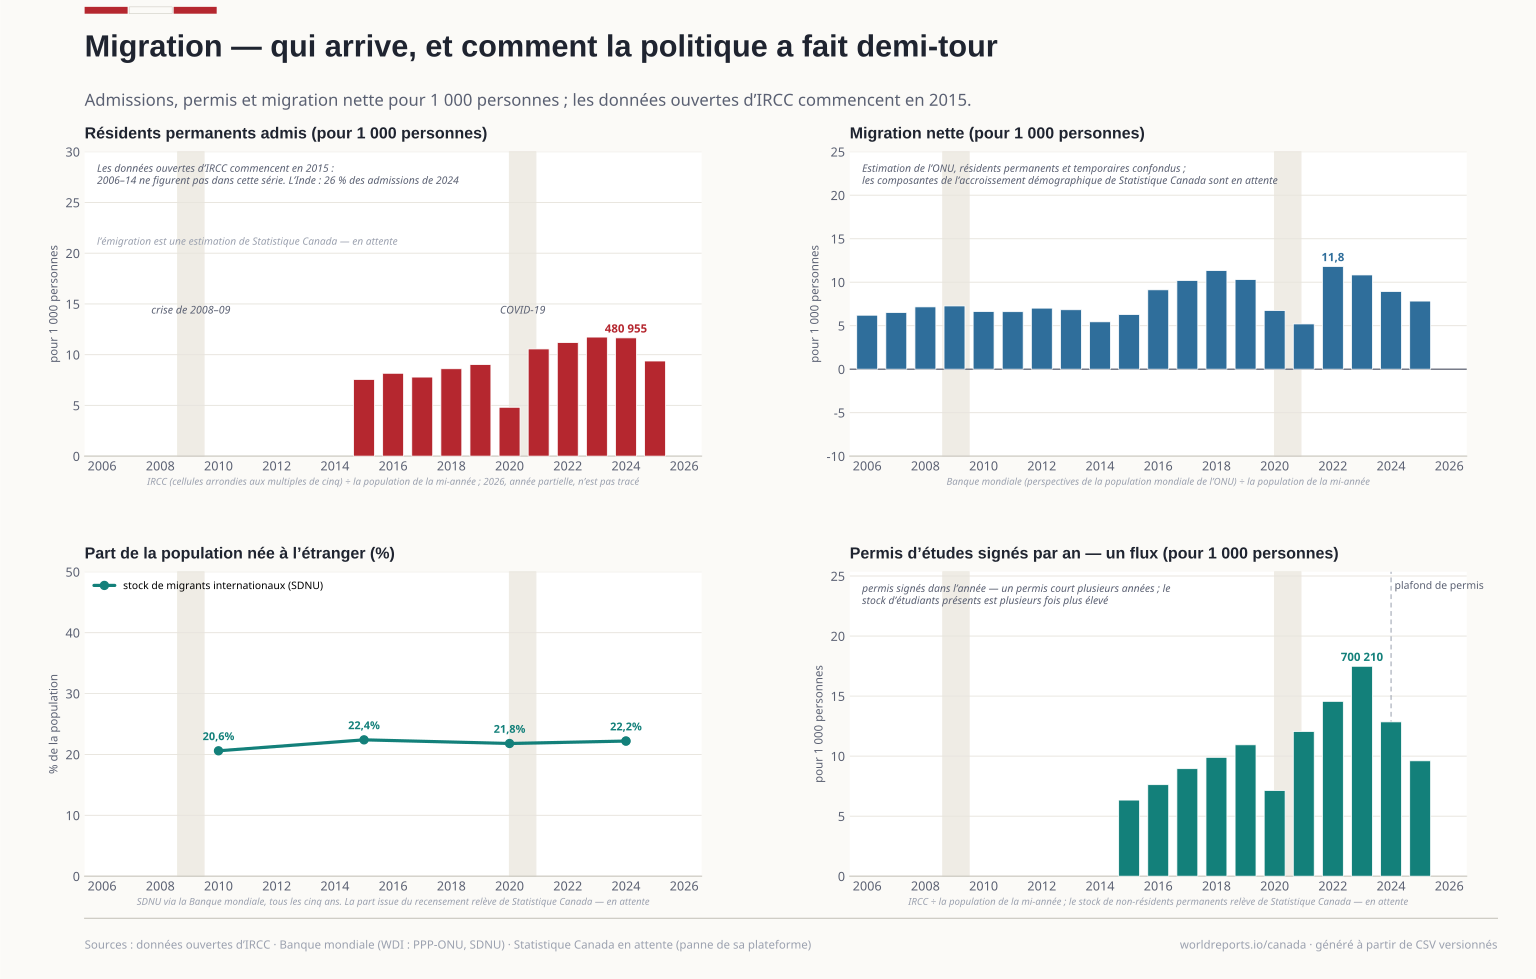
migration/pr_admissions.csv | Curated from the sidecar below, unchanged. Permanent-resident admissions per calendar year; rounded to fives by IRCC and the series begins in 2015… | IRCC — Permanent Residents, monthly open-data release | 2015-2026 | Officiel |
|---|
migration/pr_admissions_from_ircc.csv | ROUNDED. Every cell in the source is a multiple of five — all 19,503 of them, with no exceptions — and IRCC labels the files "not for calculations"… | IRCC — Permanent Residents, monthly open-data release | 2015-2026 | Officiel |
|---|
migration/pr_by_origin.csv | Curated from the sidecar below, unchanged. The ten largest countries of citizenship over the whole file, ranked once. | IRCC — Permanent Residents by country of citizenship | 2015-2026 | Officiel |
|---|
migration/pr_by_origin_from_ircc.csv | The ten largest sources over the whole file, ranked once rather than per year, so the composition does not reshuffle under the reader. Every column… | IRCC — Permanent Residents by country of citizenship | 2015-2026 | Officiel |
|---|
migration/study_permits.csv | Curated from the sidecar below, unchanged. A FLOW — permits signed in the period — not the stock of students present, which is Statistics Canada's… | IRCC — Temporary Residents, study permit holders | 2015-2026 | Officiel |
|---|
migration/study_permits_from_ircc.csv | Permit holders with a permit signed in the period, which is a FLOW. It is not the stock of students present in Canada, and the two differ by more… | IRCC — Temporary Residents, study permit holders | 2015-2026 | Officiel |
|---|
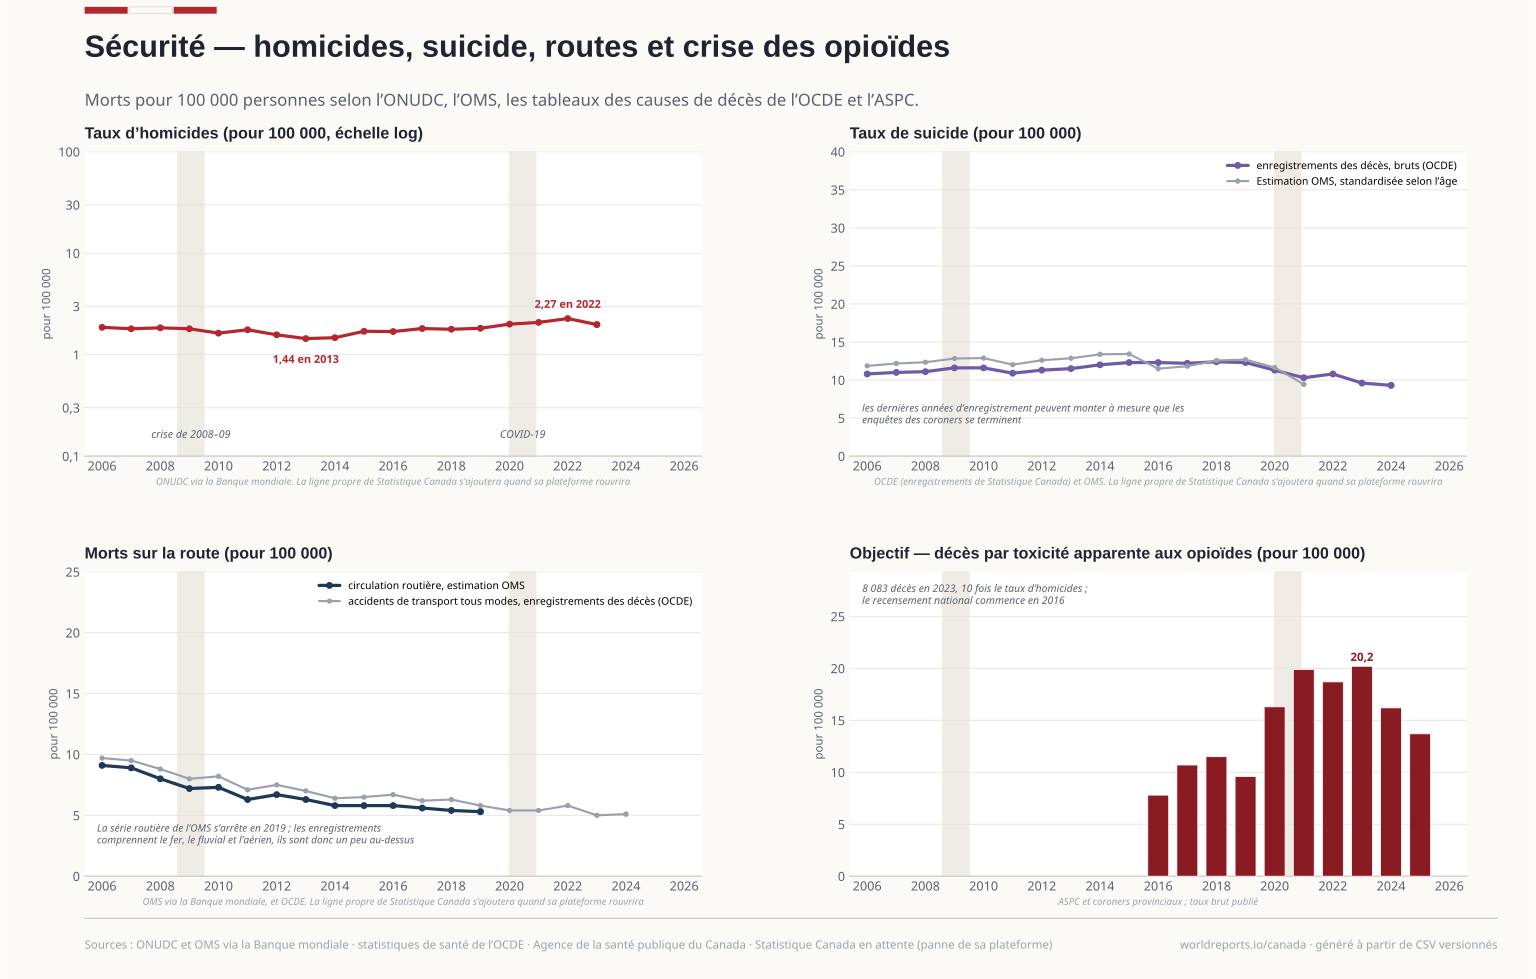
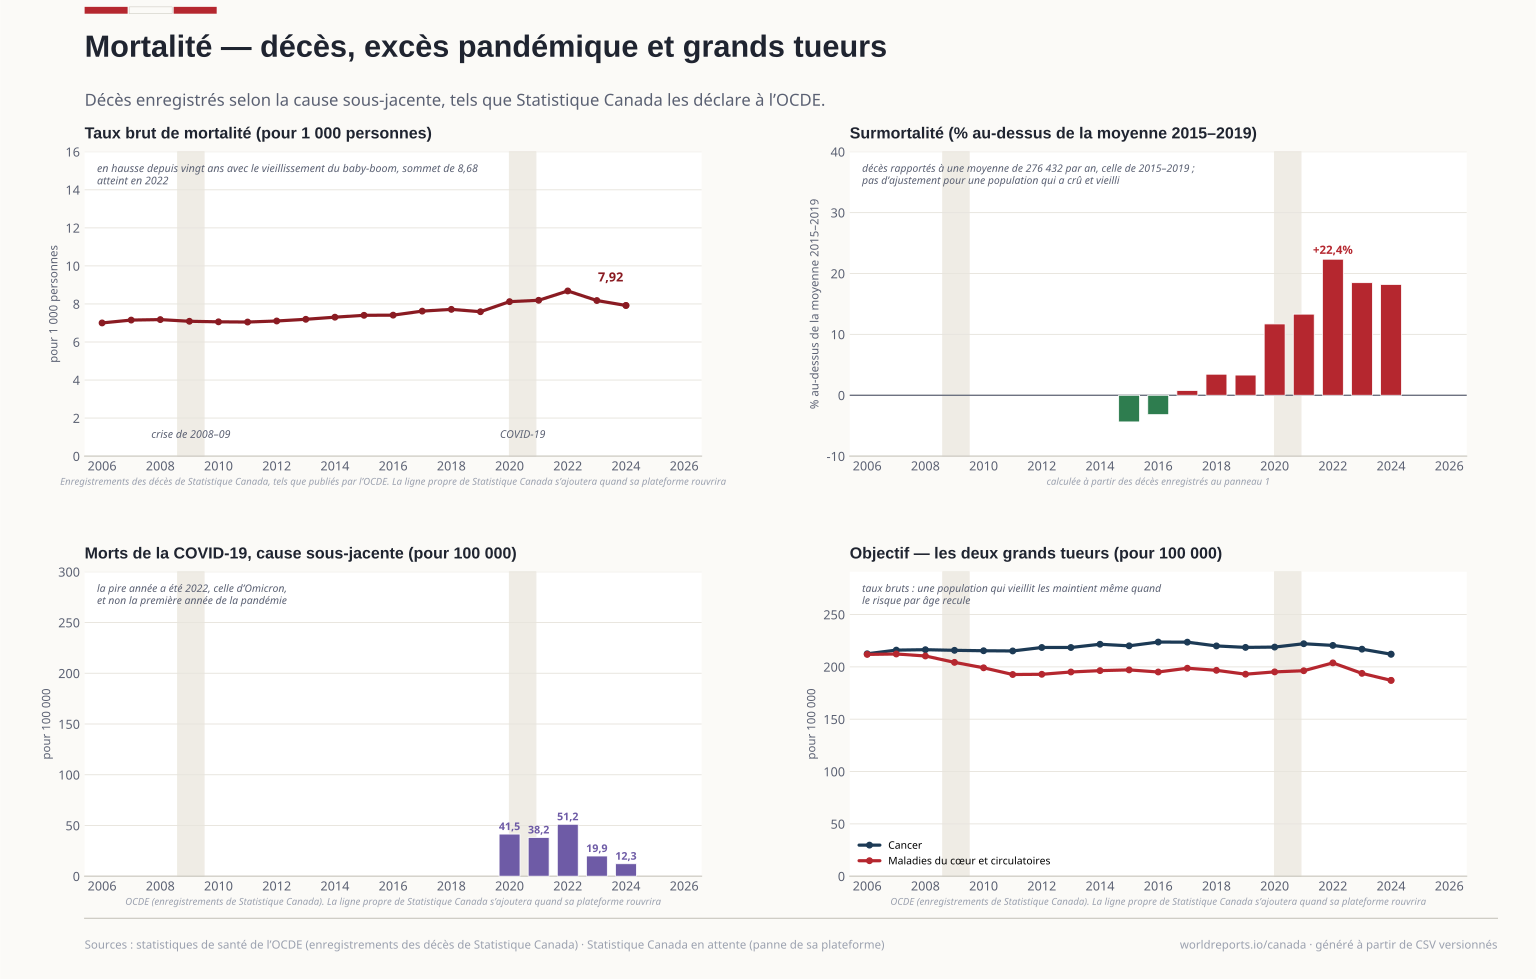
social/causes_of_death.csv | Curated from the sidecar below, unchanged. deaths is a count; every other column is a CRUDE rate per 100,000 (both sexes) as the OECD publishes it… | OECD — Health Statistics, causes of mortality (DSD_HEALTH_STAT@DF_COM): Statistics Canada's death registrations by underlying cause | 2005-2024 | Autre |
|---|
social/causes_of_death_from_oecd.csv | | OECD — Health Statistics, causes of mortality (DSD_HEALTH_STAT@DF_COM): Statistics Canada's death registrations by underlying cause | 2005-2024 | Autre |
|---|
social/components_from_statcan.csv | As pulled, 1971 on, Canada only. The quarterly sibling (17-10-0040) was verified live and left to the migration chapter: it answers as components of… | Statistics Canada — Estimates of the components of demographic growth, annual (17-10-0008, CANSIM 051-0004) | 1971-2025 | Officiel |
|---|
social/components_statcan.csv | July 1 to June 30 periods keyed by the STARTING year, like the fiscal files: 2024 is 2024-07-01 to 2025-06-30. Components are published separately… | Statistics Canada — Estimates of the components of demographic growth, annual (17-10-0008, CANSIM 051-0004) | 2005-2025 | Officiel |
|---|
social/demography.csv | Curated from the sidecar below, unchanged. Total fertility rate, crude birth and death rates (per 1,000), and net migration as a COUNT — per-1,000… | World Bank — World Development Indicators (SP.DYN.TFRT.IN, SP.DYN.CBRT.IN, SP.DYN.CDRT.IN, SM.POP.NETM), from the UN World Population Prospects and national vital statistics | 2005-2025 | Autre |
|---|
social/demography_from_statcan.csv | As pulled, 1991 on. Registration-based counts and rates; late years move as registrations complete. | Statistics Canada — Crude birth rate, age-specific fertility rates and total fertility rate (13-10-0418, CANSIM 102-4505) | 1991-2025 | Officiel |
|---|
social/demography_from_wb.csv | Mid-year population (total and female), so a rate per 100,000 women can be computed on a mid-year denominator. Crude birth and death rates are per… | World Bank — World Development Indicators (SP.POP.TOTL.FE.IN, SP.DYN.TFRT.IN, SP.DYN.CBRT.IN, SP.DYN.CDRT.IN, SM.POP.NETM), from the UN World Population Prospects and national vital statistics | 2005-2025 | Autre |
|---|
social/demography_statcan.csv | Calendar registration years, place of residence of mother. The crude death rate has no published national series in this cube: integration divides… | Statistics Canada — Crude birth rate, age-specific fertility rates and total fertility rate (13-10-0418, CANSIM 102-4505) | 2005-2025 | Officiel |
|---|
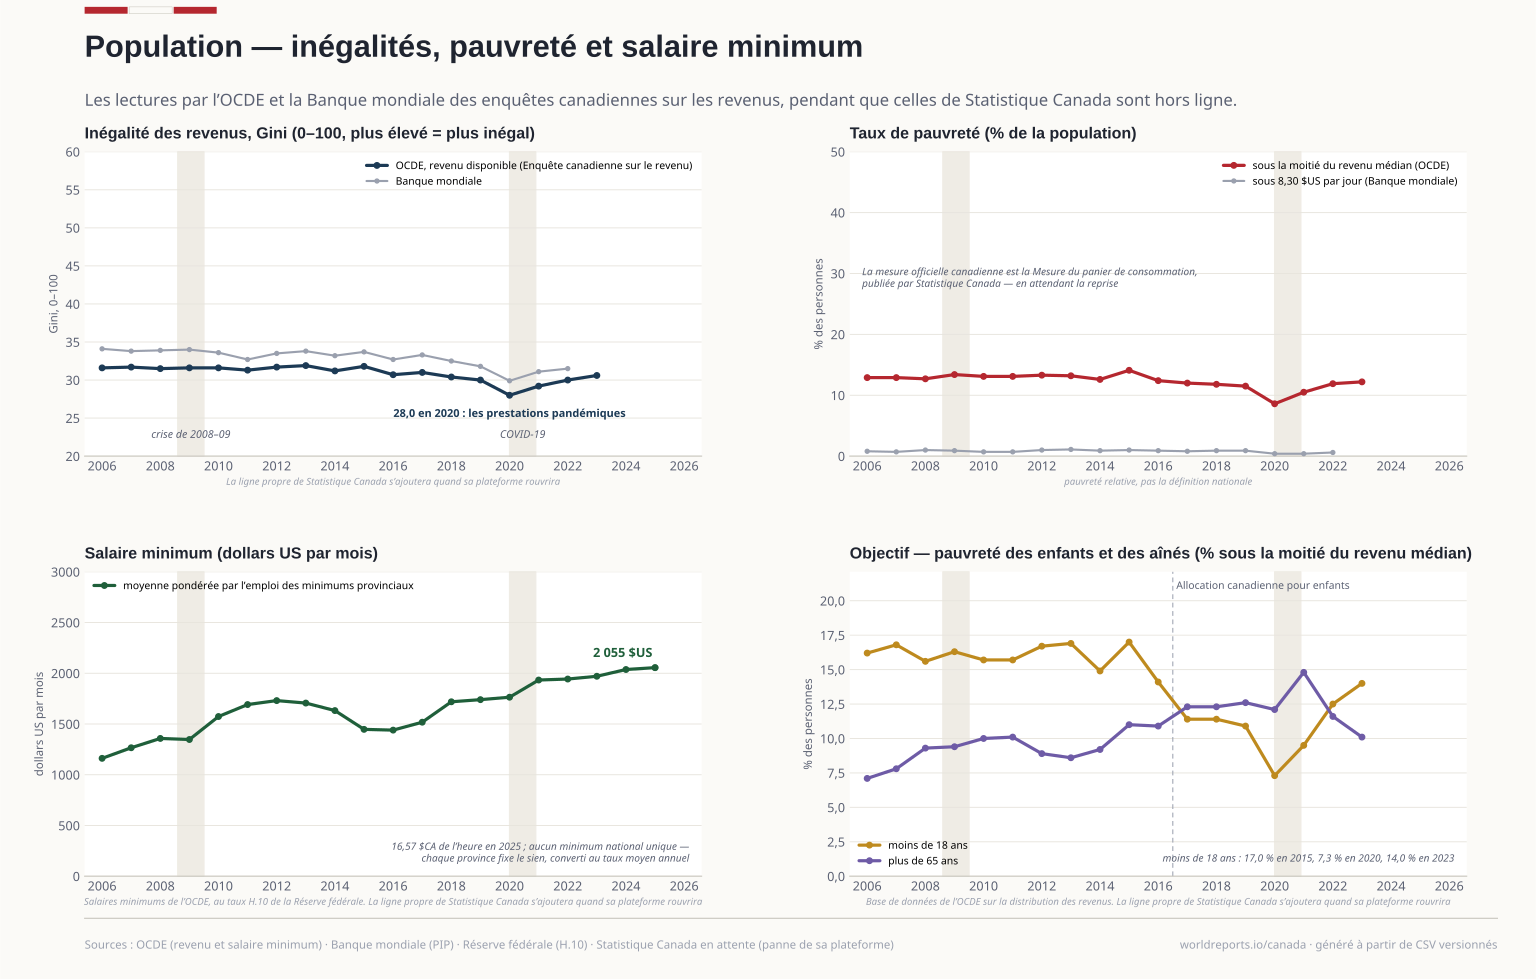
social/gini.csv | Curated from the sidecar below, unchanged. Derived from the Canadian Income Survey under the World Bank's own income definition; it lands in a… | World Bank — SI.POV.GINI | 2005-2022 | Autre |
|---|
social/gini_from_statcan.csv | As pulled, 1976 on: the adjusted-income Gini on the three concepts, Canada only. Survey-based; early years ride on a different survey instrument than… | Statistics Canada — Gini coefficients of adjusted market, total and after-tax income (11-10-0134, CANSIM 206-0033) | 1976-2024 | Officiel |
|---|
social/gini_from_wb.csv | The World Bank's harmonised Gini for Canada is derived from the Canadian Income Survey through its own income definition and lands in a different… | World Bank — SI.POV.GINI | 2005-2022 | Autre |
|---|
social/gini_statcan.csv | Statistics Canada's own survey Gini, 0-1 as published (the plate draws 0-100), three income concepts. It is NOT a second reading of the World Bank… | Statistics Canada — Gini coefficients of adjusted market, total and after-tax income (11-10-0134, CANSIM 206-0033) | 2005-2024 | Officiel |
|---|
social/income.csv | Curated from the sidecar below, unchanged. Gini of disposable income on the OECD's 0–1 scale (the plate draws 0–100), and poverty as % below HALF the… | OECD — Income Distribution Database (DSD_WISE_IDD@DF_IDD), measure INC_DISP_GINI and PR_INC_DISP | 2005-2023 | Autre |
|---|
social/income_from_oecd.csv | | OECD — Income Distribution Database (DSD_WISE_IDD@DF_IDD), measure INC_DISP_GINI and PR_INC_DISP | 2005-2023 | Autre |
|---|
social/migrant_stock.csv | Curated from the sidecar below, unchanged. International migrants (UN definition: foreign-born) as % of the population, five-yearly estimates with… | World Bank — SM.POP.TOTL.ZS (UN DESA International Migrant Stock) | 2005-2024 | Autre |
|---|
social/migrant_stock_from_wb.csv | | World Bank — SM.POP.TOTL.ZS (UN DESA International Migrant Stock) | 2005-2024 | Autre |
|---|
social/minimum_wage.csv | Curated from the sidecar below, unchanged. Canada has no single statutory national minimum — each province and territory sets its own, and the OECD… | OECD — minimum wages at current prices (DSD_EARNINGS@MW_CURP), employment-weighted across provinces and territories | 2005-2025 | Autre |
|---|
social/minimum_wage_from_oecd.csv | | OECD — minimum wages at current prices (DSD_EARNINGS@MW_CURP), employment-weighted across provinces and territories | 2005-2025 | Autre |
|---|
social/mortality_from_statcan.csv | Counts of deaths as pulled, 2000 on (the cube's window), all-ages both-sexes rows only. The full table download is ~110 MB; the sidecar keeps the… | Statistics Canada — Leading causes of death, total population, by age group (13-10-0394, CANSIM 102-0561) | 2000-2024 | Officiel |
|---|
social/mortality_statcan.csv | Death registrations, all ages, both sexes, underlying cause: all causes, COVID-19 (U07.1/U07.2/U10.9, from 2020), neoplasms, heart diseases… | Statistics Canada — Leading causes of death, total population, by age group (13-10-0394, CANSIM 102-0561) | 2005-2024 | Officiel |
|---|
social/opioids.csv | Curated from the sidecar below, unchanged. Deaths and the crude rate per 100,000 PHAC publishes with them; the national series begins in 2016… | Public Health Agency of Canada — Health Infobase, apparent opioid toxicity deaths | 2016-2025 | Officiel |
|---|
social/opioids_from_phac.csv | Pulled from the SubstanceHarmsData extract: Substance=Opioids, Source=Deaths, Region=Canada, by year, overall numbers. | Public Health Agency of Canada — Health Infobase, apparent opioid toxicity deaths | 2016-2025 | Officiel |
|---|
social/population_from_statcan.csv | The July reference rows of the quarterly series, 1961 on (the quarterly table carries 1946 on; the atlas window starts later). 2026 is the latest… | Statistics Canada — Population estimates, quarterly (17-10-0009, CANSIM 051-0005) | 1961-2026 | Officiel |
|---|
social/population_statcan.csv | The July 1 demographic estimate — the national population vintage and the only Canadian one that separates non-permanent residents. Census revisions… | Statistics Canada — Population estimates, quarterly (17-10-0009, CANSIM 051-0005) | 2005-2026 | Officiel |
|---|
social/poverty.csv | Curated from the sidecar below, unchanged. Share of people below US$8.30 a day (2021 PPP), survey years only — the gaps are years without a survey… | World Bank — Poverty and Inequality Platform, SI.POV.UMIC | 2005-2022 | Autre |
|---|
social/poverty_from_statcan.csv | The percentage-of-persons statistics for All persons on three lines (MBM 2018 base, MBM 2023 base, LIM-AT). Threshold tables (11-10-0103/0066/0230)… | Statistics Canada — Low income statistics by age, gender and economic family type (11-10-0135, CANSIM 206-0041) | 1976-2024 | Officiel |
|---|
social/poverty_from_wb.csv | poverty_830_pct: share of people below US$8.30 a day, 2021 PPP. Survey years only; the gaps are years without a survey, not zeros. The cross-country… | World Bank — Poverty and Inequality Platform, SI.POV.UMIC | 2005-2022 | Autre |
|---|
social/poverty_statcan.csv | All persons. TWO MBM BASES AS TWO COLUMNS: the 2018-base series (2015-2023) and the 2023-base series (2020-) use different thresholds; joining them… | Statistics Canada — Low income statistics by age, gender and economic family type (11-10-0135, CANSIM 206-0041) | 2005-2024 | Officiel |
|---|
social/security.csv | Curated from the sidecar below, unchanged. All per 100,000. The spine's canonical security series; the national police-reported homicide is staged in… | World Bank — World Development Indicators: VC.IHR.PSRC.P5 (UNODC), SH.STA.SUIC.P5 and SH.STA.TRAF.P5 (WHO Global Health Estimates) | 2005-2023 | Autre |
|---|
social/security_from_statcan.csv | As pulled, Canada only. The broad UCR cube (35-10-0177) was verified live and dropped for this slot: it is every detailed violation, and the homicide… | Statistics Canada — Number, rate and percentage changes in rates of homicide victims (35-10-0068, CANSIM 253-0001) | 1961-2025 | Officiel |
|---|
social/security_from_wb.csv | All per 100,000 people. Intentional homicide is UNODC's harmonised count, which usually differs from the national police or death- certificate series… | World Bank — World Development Indicators: VC.IHR.PSRC.P5 (UNODC), SH.STA.SUIC.P5 and SH.STA.TRAF.P5 (WHO Global Health Estimates) | 2005-2023 | Autre |
|---|
social/security_statcan.csv | Police-reported homicide victims and the published rate per 100,000, 1961 on. Counted at the place of occurrence by police services; the… | Statistics Canada — Number, rate and percentage changes in rates of homicide victims (35-10-0068, CANSIM 253-0001) | 2005-2025 | Officiel |
|---|
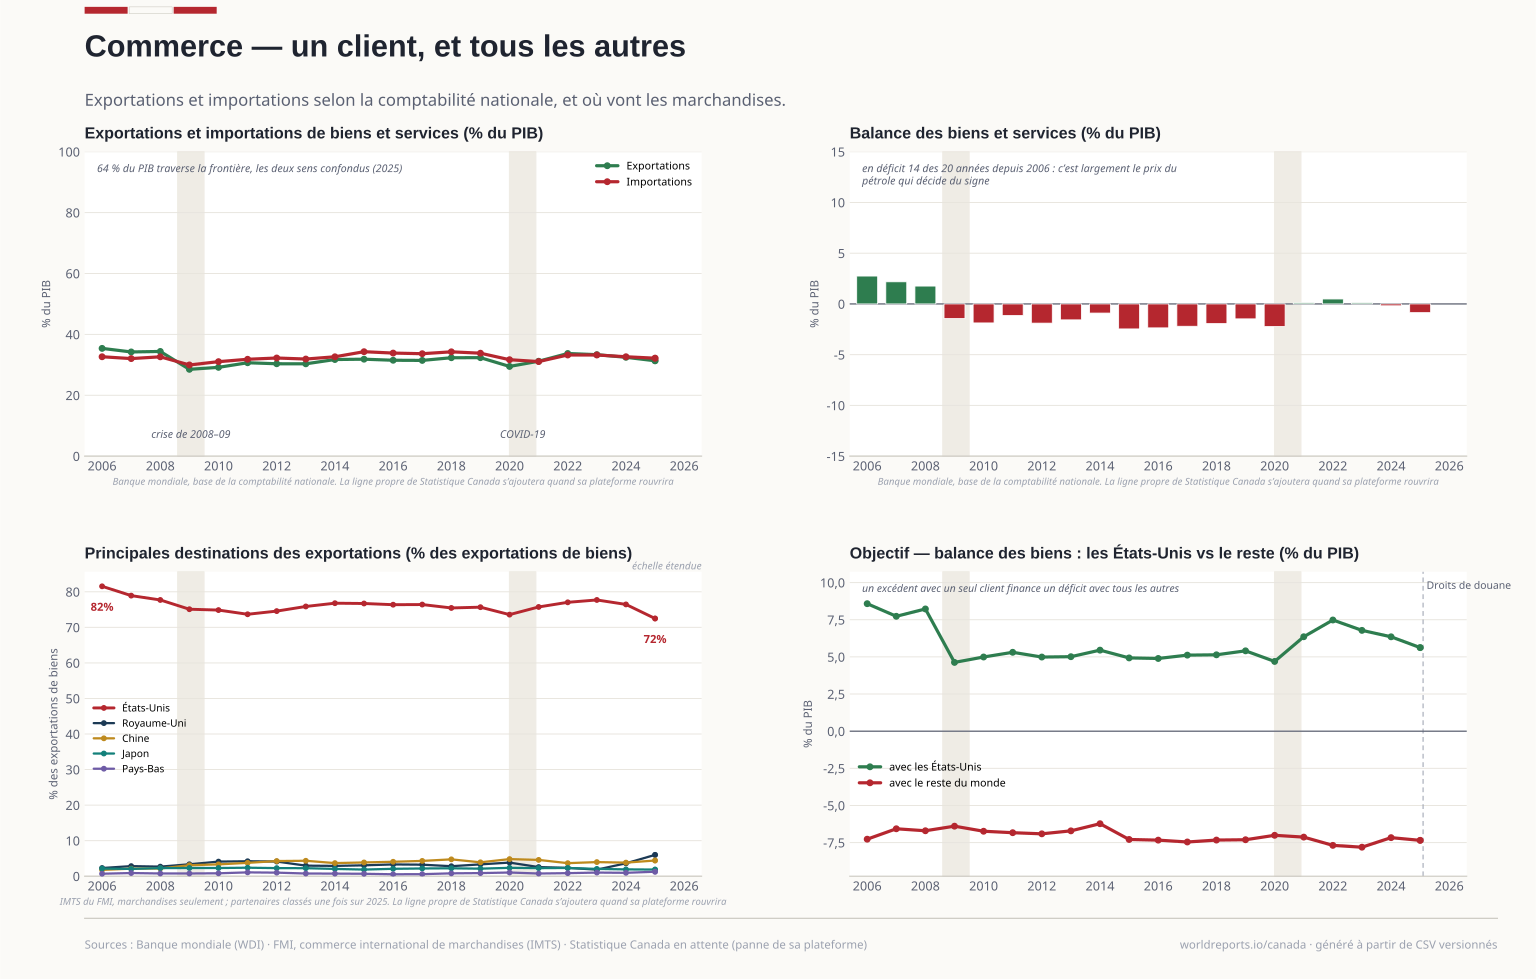
trade/partners.csv | Curated from the sidecar below, unchanged. Goods exports (FOB) by partner and goods balances, current US$ as units, not millions. Partners ranked… | IMF — International Trade in Goods (IMTS), flow IMTS, series CAN.XG_FOB_USD+TBG_USD | 2005-2025 | Autre |
|---|
trade/partners_from_imf.csv | The fetcher takes the six largest partners on the last full year and requires the world aggregate to be in the payload before writing; regional… | IMF — International Trade in Goods (IMTS), flow IMTS, series CAN.XG_FOB_USD+TBG_USD | 2005-2025 | Autre |
|---|
trade/trade.csv | Curated from the sidecar below, unchanged. Exports and imports of goods AND services, national-accounts basis, % of GDP — the spine's trade slot 1… | World Bank — World Development Indicators (NE.EXP.GNFS.ZS, NE.IMP.GNFS.ZS) | 2005-2025 | Autre |
|---|
trade/trade_from_statcan.csv | Published current-dollar millions (millions of CAD, "Less: imports" stored positive as the imports line) plus the % of GDP ratios the fetcher… | Statistics Canada — GDP expenditure-based, Canada, annual (36-10-0699) | 1981-2025 | Officiel |
|---|
trade/trade_from_wb.csv | Exports and imports of goods AND services, national-accounts basis, % of GDP — not a customs goods series. The trade balance is their difference and… | World Bank — World Development Indicators (NE.EXP.GNFS.ZS, NE.IMP.GNFS.ZS) | 2005-2025 | Autre |
|---|
trade/trade_statcan.csv | The national line for trade slots 1-2, same definition as the World Bank file beside it (goods and services, national accounts) and the same numbers… | Statistics Canada — GDP expenditure-based, Canada, annual (36-10-0699): current-dollar exports/imports of goods and services over current-dollar GDP | 2005-2025 | Officiel |
|---|
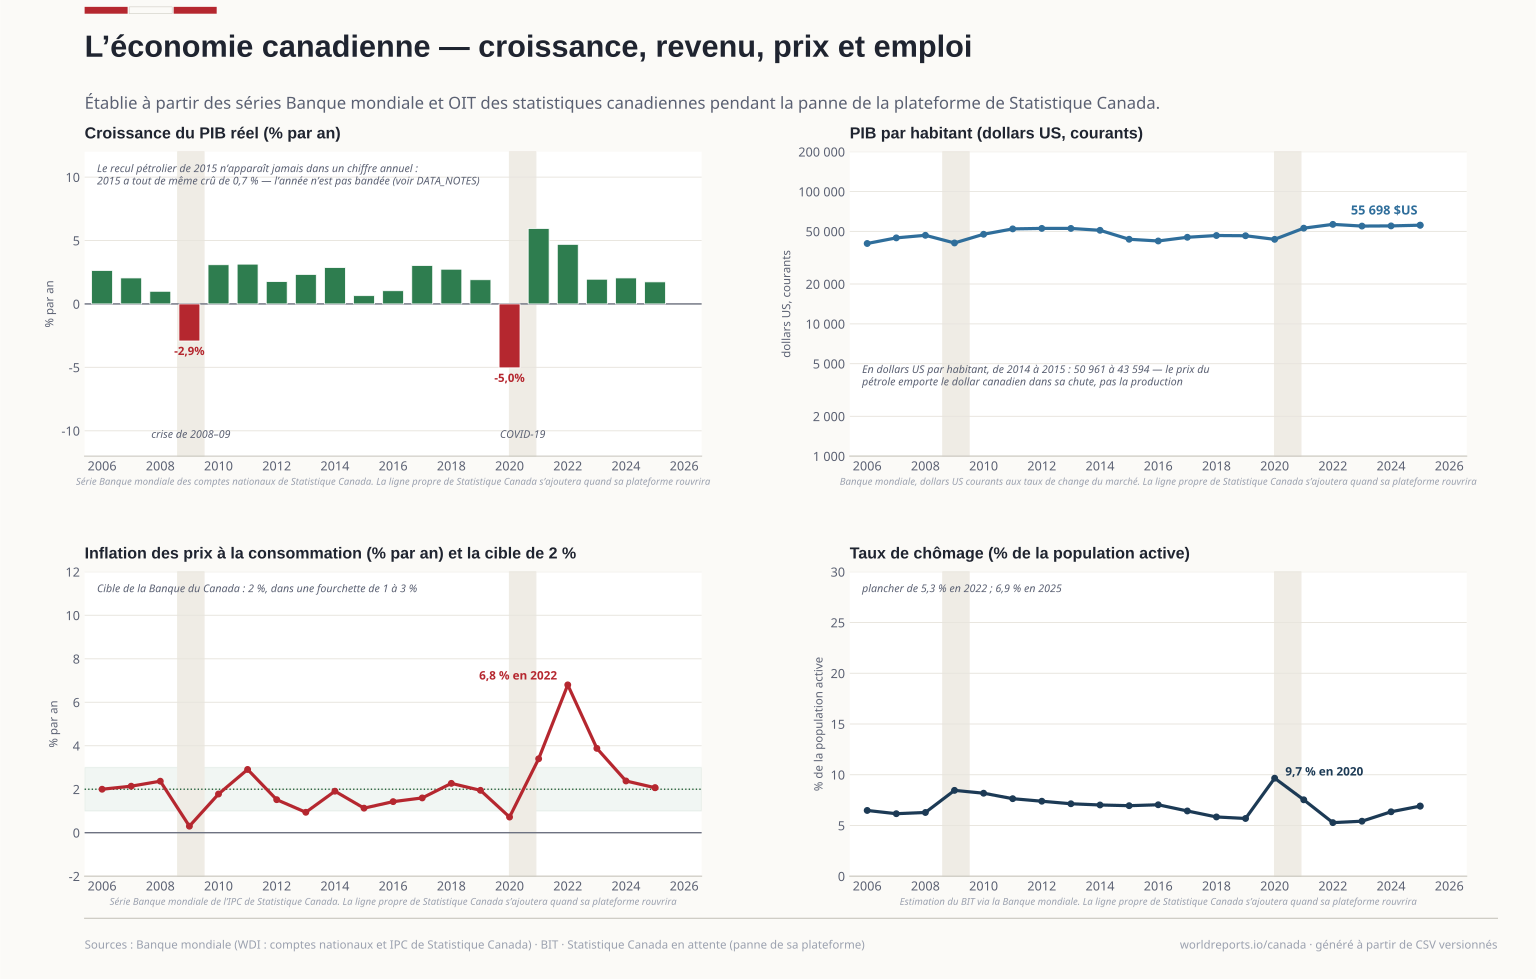 Planche 01