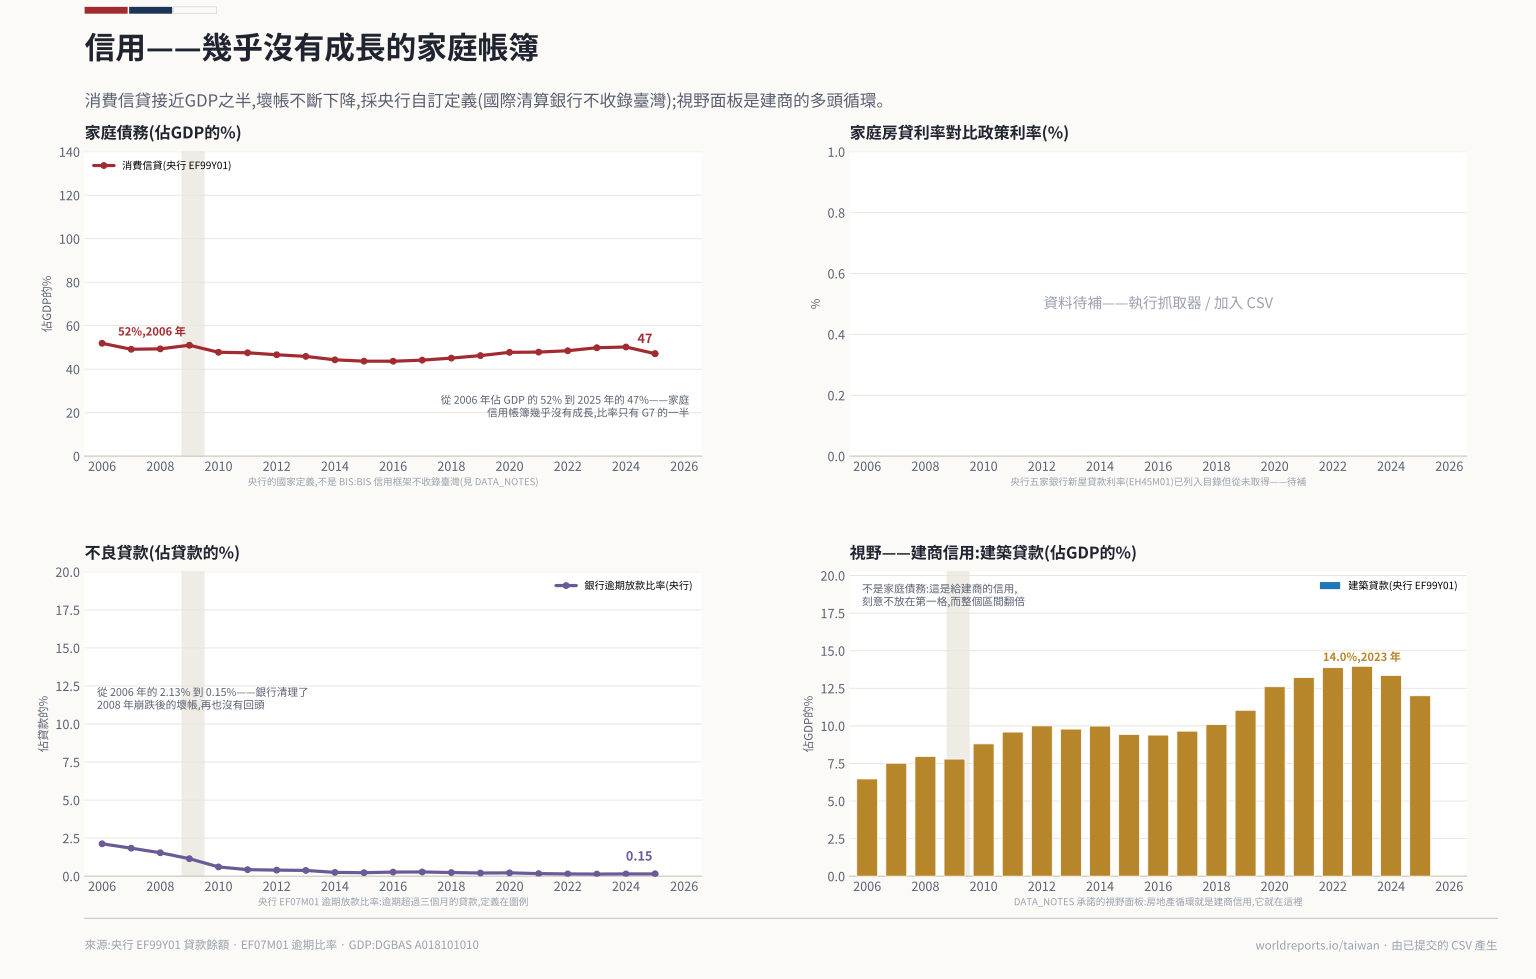
credit/household_credit.csv | VERIFIED, annual since 1988, NTD millions. 消費者貸款 (消費者貸款-小計: includes credit cards/overdraft) 2006 6.53tn to 2025 13.53tn, and 建築貸款 (building loans… | Central Bank (CBC) cpx.cbc.gov.tw PCAxis EF99Y01 — consumer and building loans outstanding | 2006-2025 | Official |
|---|
credit/npl.csv | VERIFIED, monthly since 1987. Dec period-end, % of loans (0.15 across 2024-2025). Same table as reserves and CPI y/y — three chapters, one source… | Central Bank (CBC) cpx.cbc.gov.tw PCAxis EF07M01 — domestic-bank non-performing-loan ratio (逾放比率), Dec | 2006-2025 | Official |
|---|
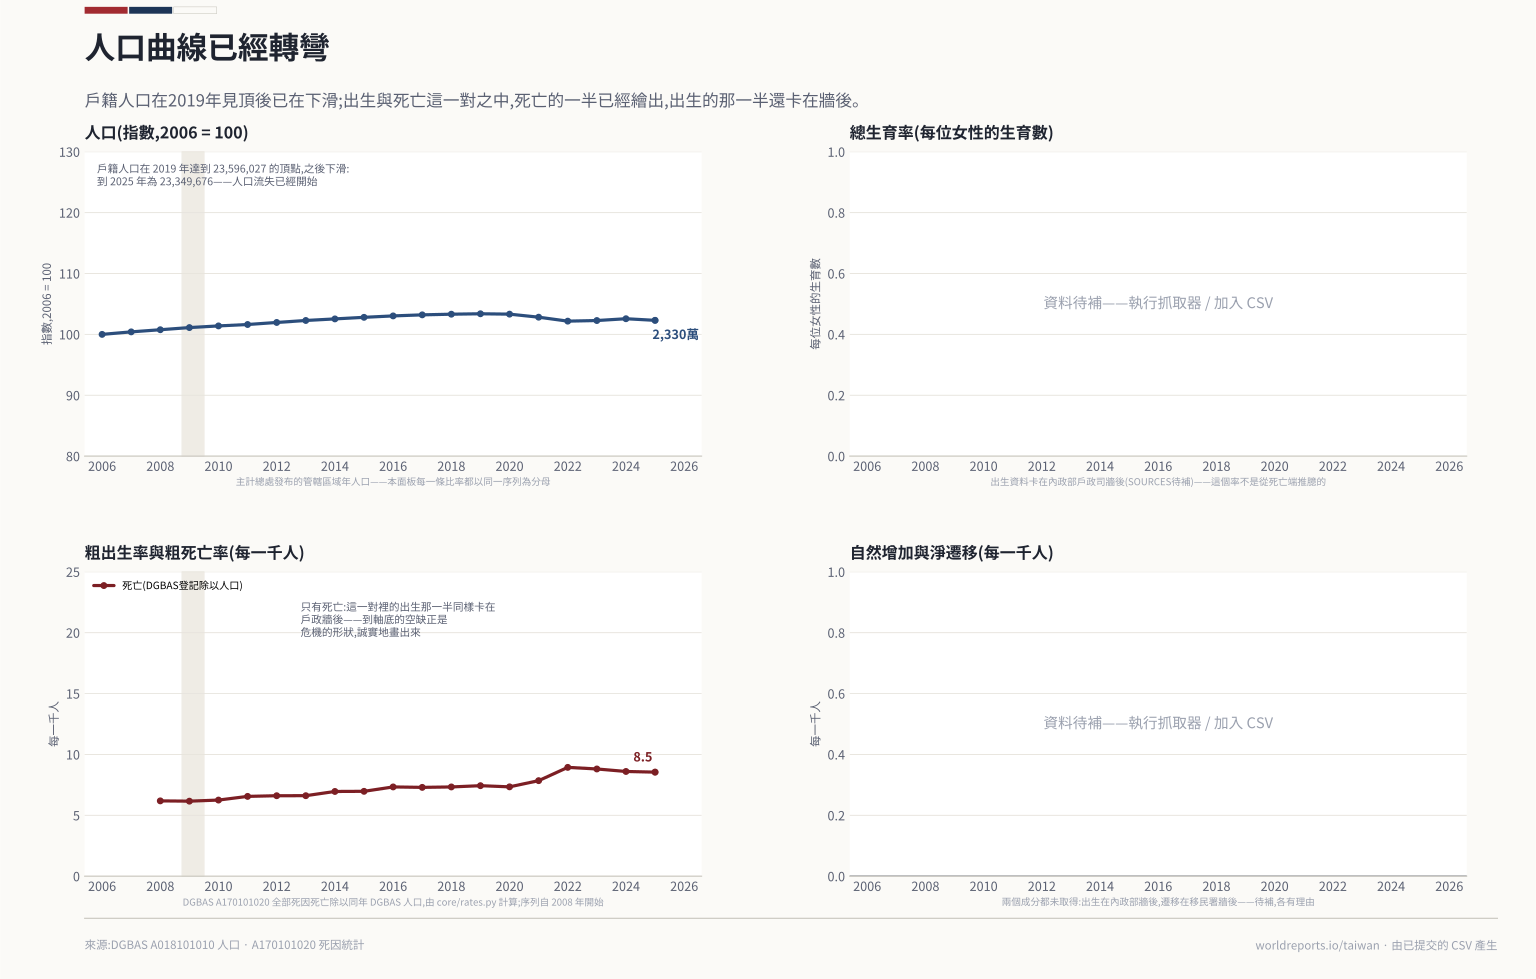
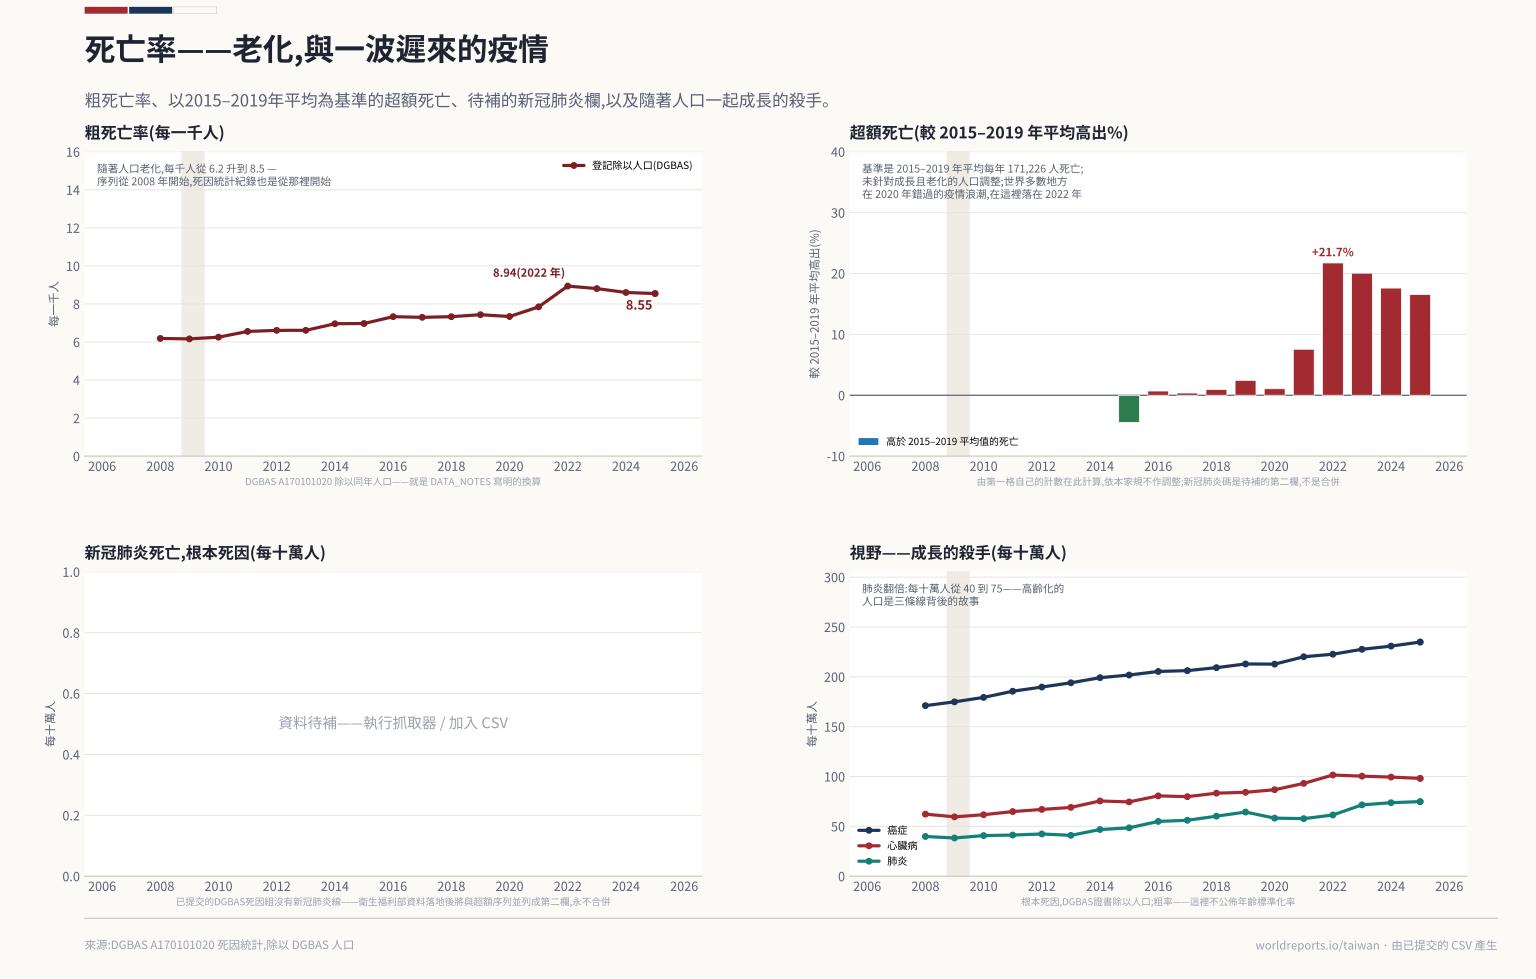
demography/population.csv | VERIFIED: 22,823,455 (2006) -> peak 23,596,027 (2019) -> 23,349,676 (2025), falling since 2020 (peak-then-decline asserted). This is the… | DGBAS nstatdb DPAS A018101010 — mid-year population (期中人口) | 2006-2025 | Official |
|---|
economy/cpi.csv | VERIFIED. Annual average index on the publisher's 2021=100 base (2021=100 asserted), inflation computed as the y/y change of that annual average… | DGBAS nstatdb DPAS table A030101015 — headline CPI (總指數, cycle=41) | 2006-2025 | Official |
|---|
economy/cpi_yoy_cbc.csv | VERIFIED. The CBC's own 消費者物價指數年增率 (monthly CPI y/y) read at December — a second independent CPI inflation path beside the DGBAS annual figure (2024… | Central Bank (CBC) cpx.cbc.gov.tw PCAxis EF07M01 — CPI year-on-year (Dec) | 2006-2025 | Official |
|---|
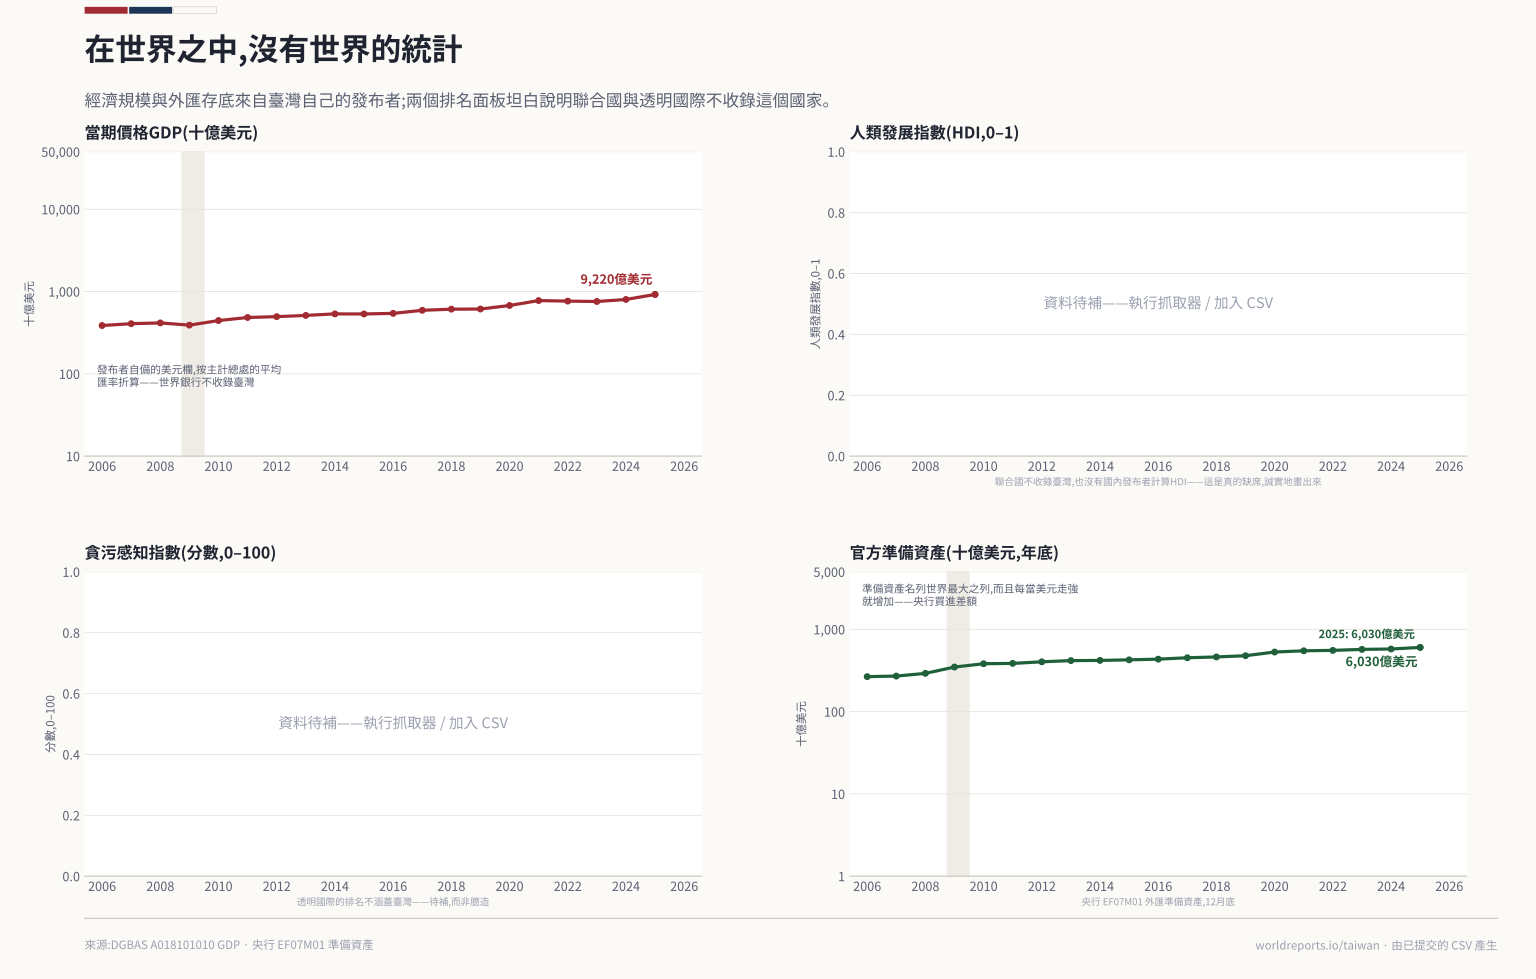
economy/gdp.csv | VERIFIED end to end 2026-10-23, JSON payload {colh,col,row,orgdata}; orgdata is field-major, row labels are ROC years (95年=2006, asserted against a… | DGBAS nstatdb DPAS table A018101010 — national income key table (annual rows) | 2006-2025 | Official |
|---|
economy/gdp_growth_quarterly.csv | VERIFIED. The seasonally-adjusted quarterly y/y series that dates the 2008-09 export collapse (2008Q3 -1.39, 2008Q4 -7.36, trough 2009Q1 -7.87)… | DGBAS nstatdb DPAS table A018101010 — the same table's quarterly rows | 2006-2025 | Official |
|---|
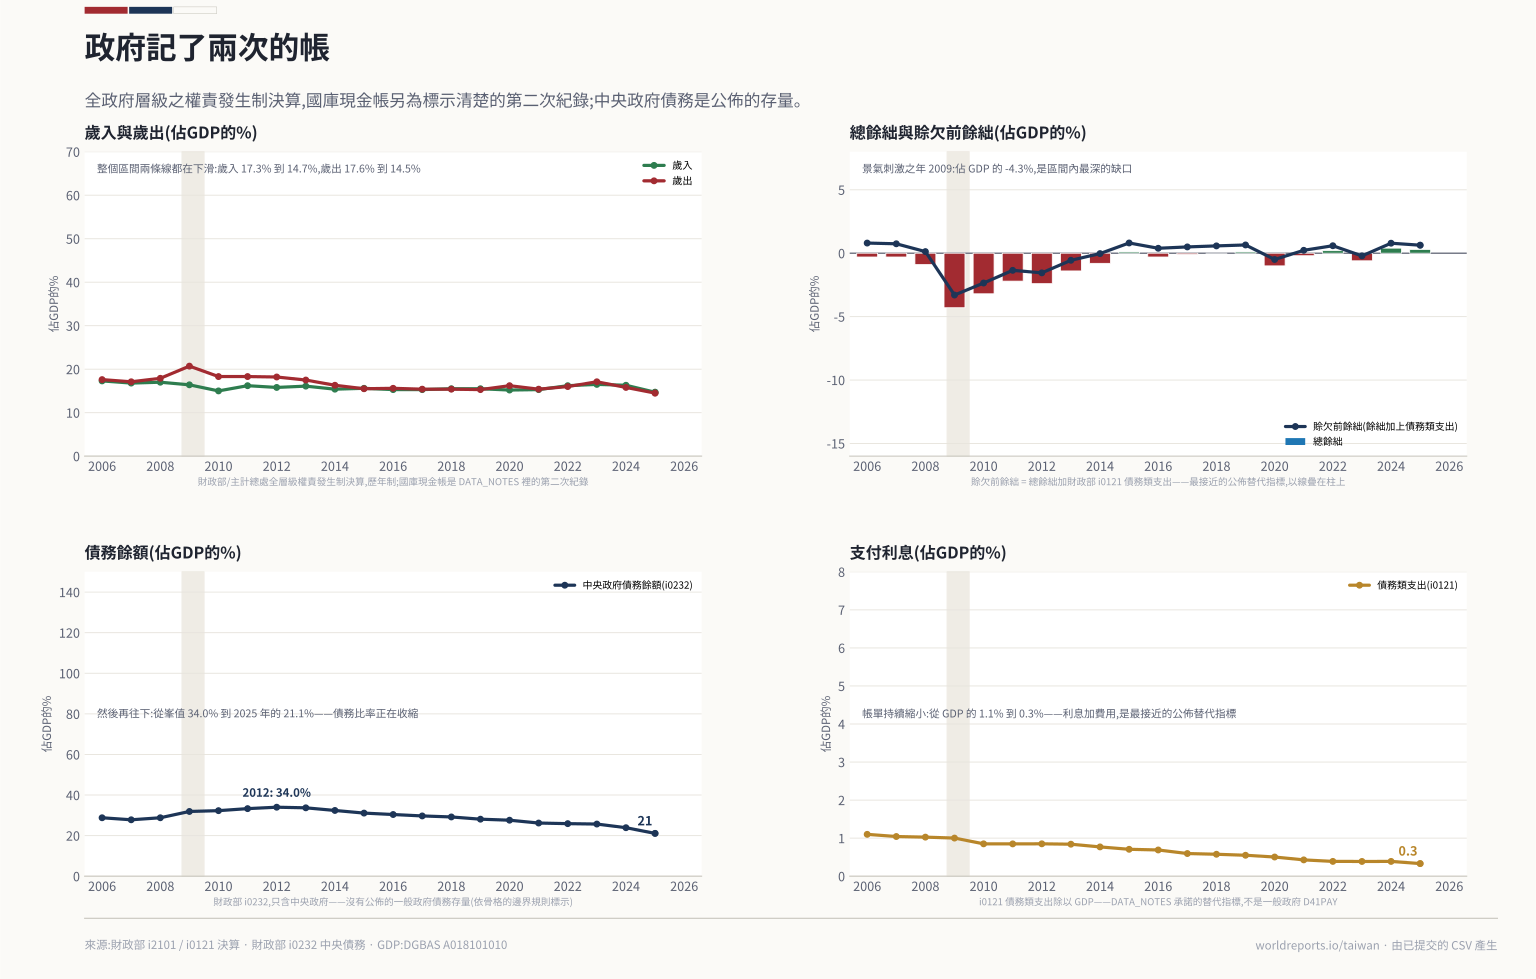
fiscal/accrual_vs_cash.csv | VERIFIED. Two publishers of one idea inside one database (SOURCING §4): the accrual final accounts (歲入/歲出淨額) and the public treasury CASH in/out… | MOF web02 DPAS — accrual final accounts (i2101 revenue, i0121 expenditure) vs public treasury cash (i2201 in / i2206 out) | 2006-2025 | Official |
|---|
fiscal/budget.csv | VERIFIED end to end 2026-10-23. ROC 年度 rows (112年度=2023 asserted), NTD thousands; the % of GDP columns are the publisher's own, not a re- derivation… | MOF 財政統計查詢 DPAS i2101 — all-levels final accounts (accrual), net revenue/expenditure/balance | 2006-2025 | Official |
|---|
fiscal/debt_central.csv | VERIFIED. Central-government debt NTD MILLIONS plus the published % of GDP (2025 6,071,063 mn = 21.1% GDP). This table emits invalid JSON (a <font… | MOF web02 DPAS i0232 — central-government gross debt outstanding (>=1y non-self-amortising, domestic) | 2006-2025 | Official |
|---|
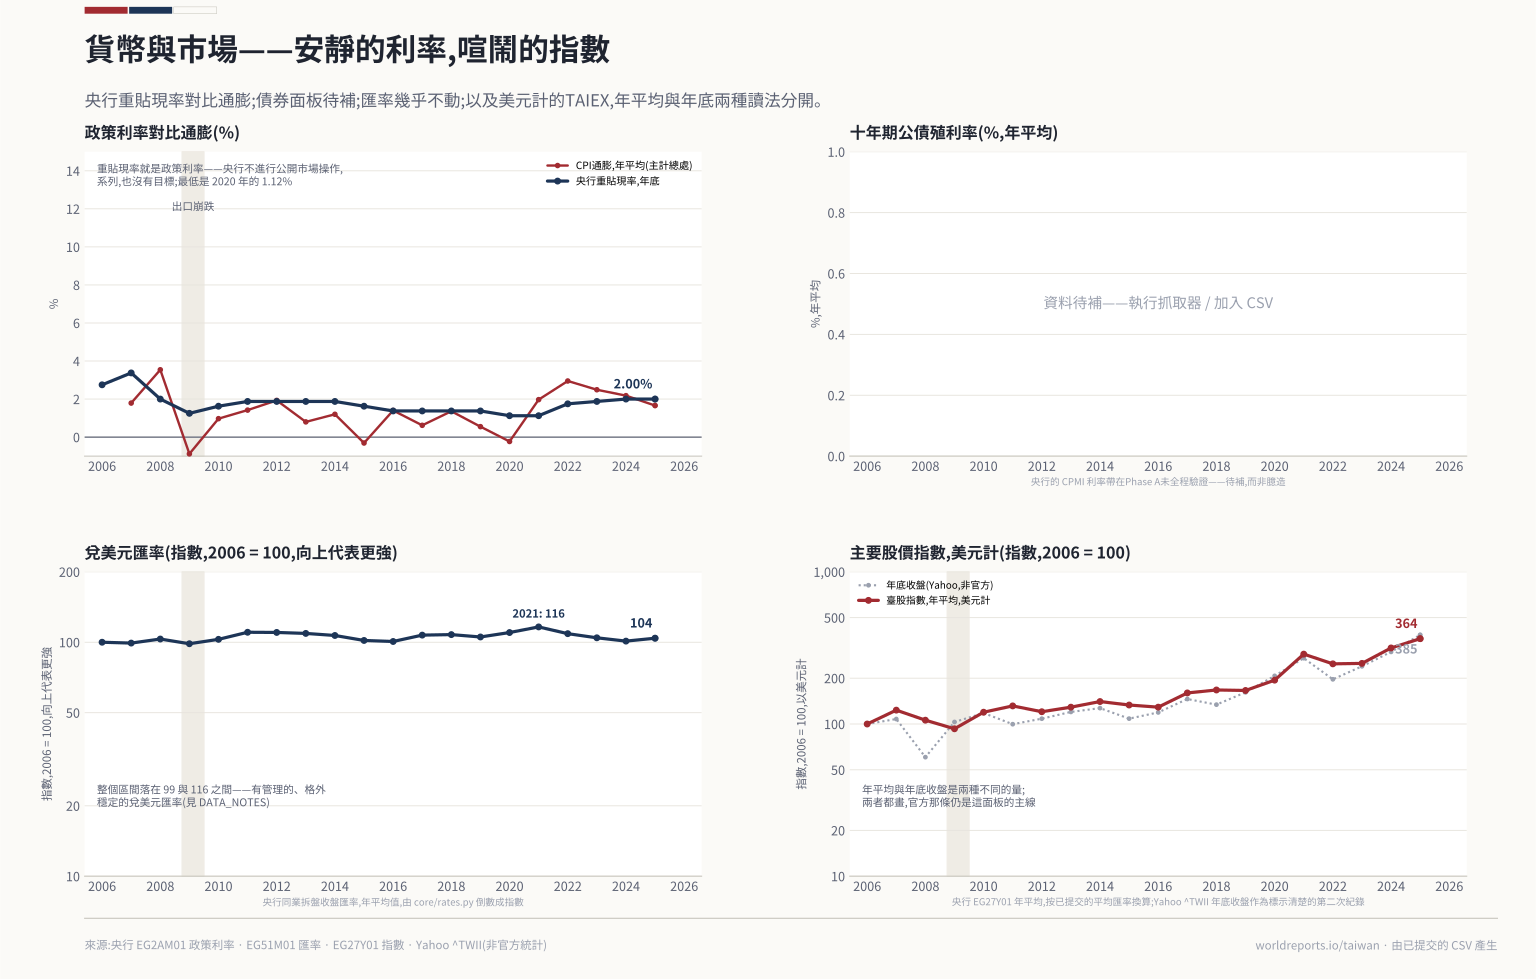
markets/policy_rate.csv | VERIFIED, monthly since 1988M01. The CBC's policy rate IS the rediscount rate — it has no OMO target-rate series — steered with the rediscount rate… | Central Bank (CBC) cpx.cbc.gov.tw PCAxis EG2AM01 — rediscount rate (重貼現率), Dec period-end | 2006-2025 | Official |
|---|
markets/stock_index_avg.csv | VERIFIED, annual since 1987. This column is the index's ANNUAL AVERAGE (加權平均股價指數): 2023 16,386.23, 2024 21,382.78, 2025 23,918.89 — it is NOT the… | Central Bank (CBC) cpx.cbc.gov.tw PCAxis EG27Y01 — TWSE weighted index, ANNUAL AVERAGE | 2006-2025 | Official |
|---|
markets/stock_index_yearend.csv | Market reading, marked official:false (SOURCING §5) — a CROSS-CHECK, not the line of record. December bar close with the Taipei gmtoffset applied… | TWSE weighted index close, redistributed by Yahoo Finance (^TWII) | 2006-2025 | Other |
|---|
markets/usdtwd.csv | VERIFIED, monthly since 1992M01. The annual MEAN of the interbank closing (銀行間收盤匯率), TWD per USD, is the currency panel's annual average (2024… | Central Bank (CBC) cpx.cbc.gov.tw PCAxis EG51M01 — USD/TWD interbank closing, annual mean | 2006-2025 | Official |
|---|
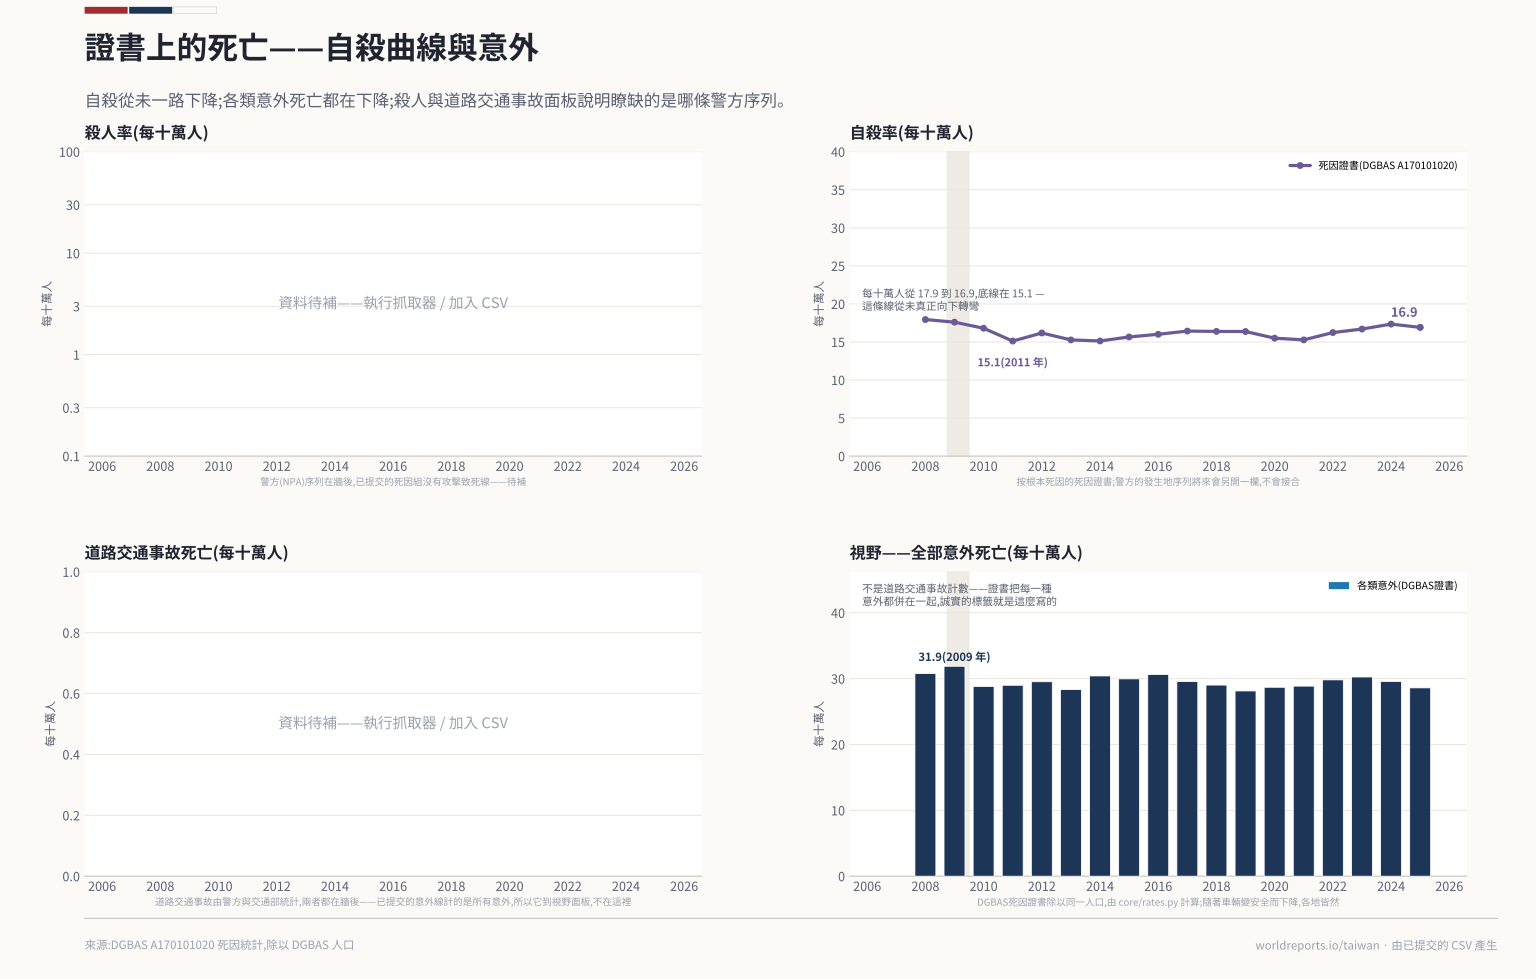
mortality/causes_of_death.csv | VERIFIED, 2008 on. Deaths (合計) for the 11 leading causes — all-cause (2008 142,283 -> 2025 199,576), cancer, heart, pneumonia, cerebrovascular… | DGBAS nstatdb DPAS A170101020 — deaths by cause of death (合計), monthly aggregated annually | 2008-2025 | Official |
|---|
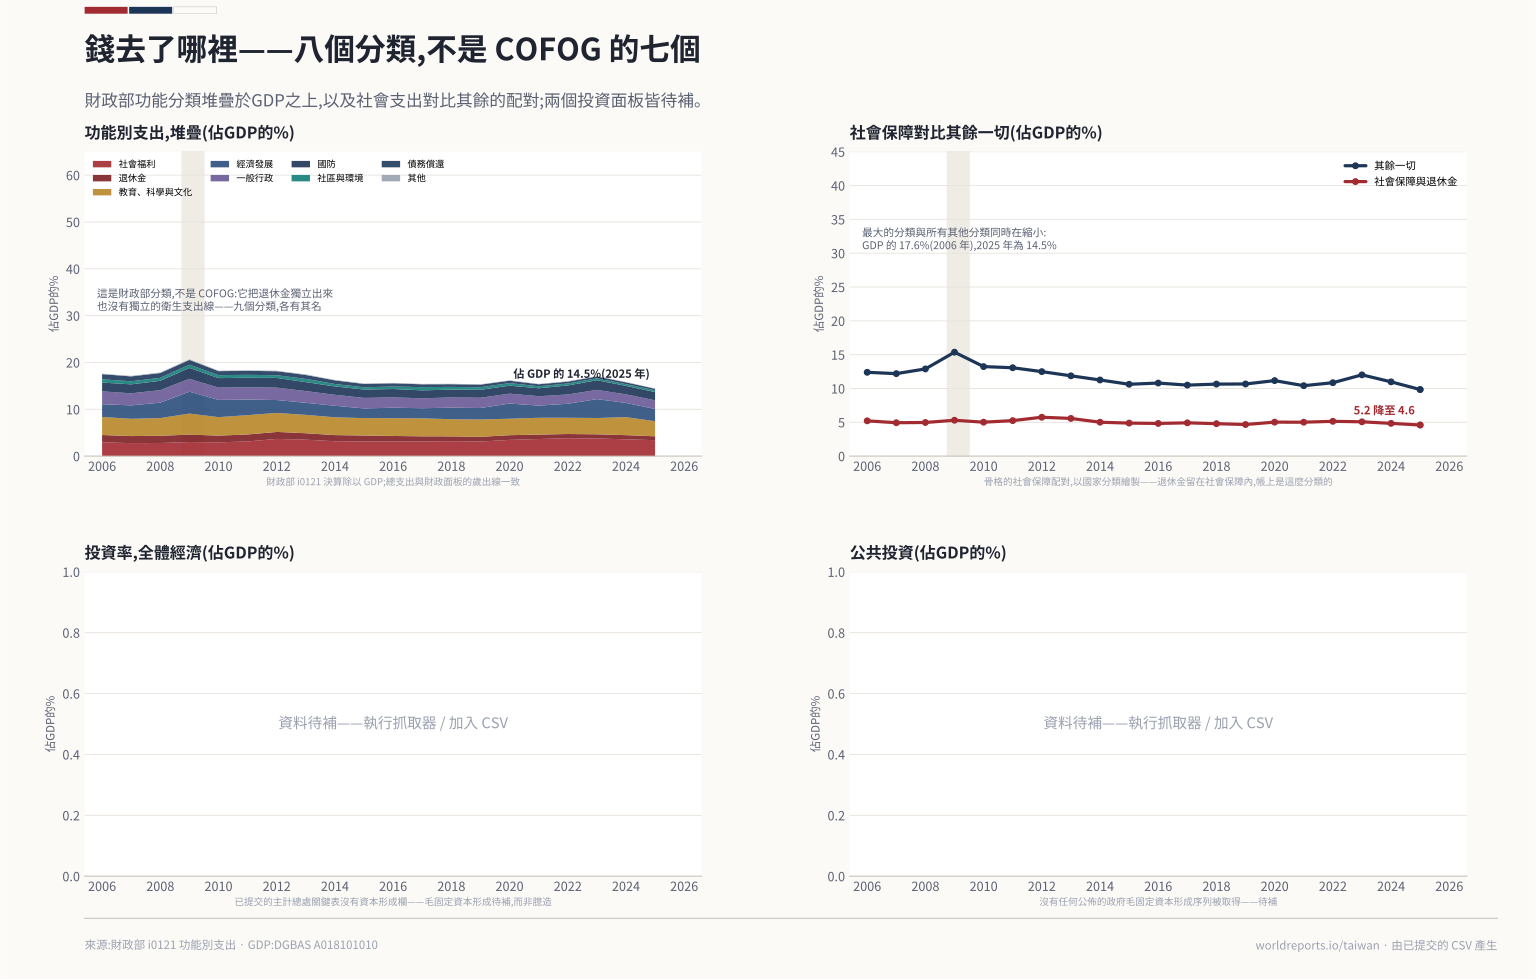
spending/function.csv | VERIFIED. The national functional classification (一般政務/國防/教育科學 文化/經濟發展/社會安全及退撫/社會福利/社區發展環境保護/退休撫卹/債務/其他); the plate maps it onto the seven COFOG… | MOF web02 DPAS i0121 — all-levels final-account expenditure by policy category | 2006-2025 | Official |
|---|
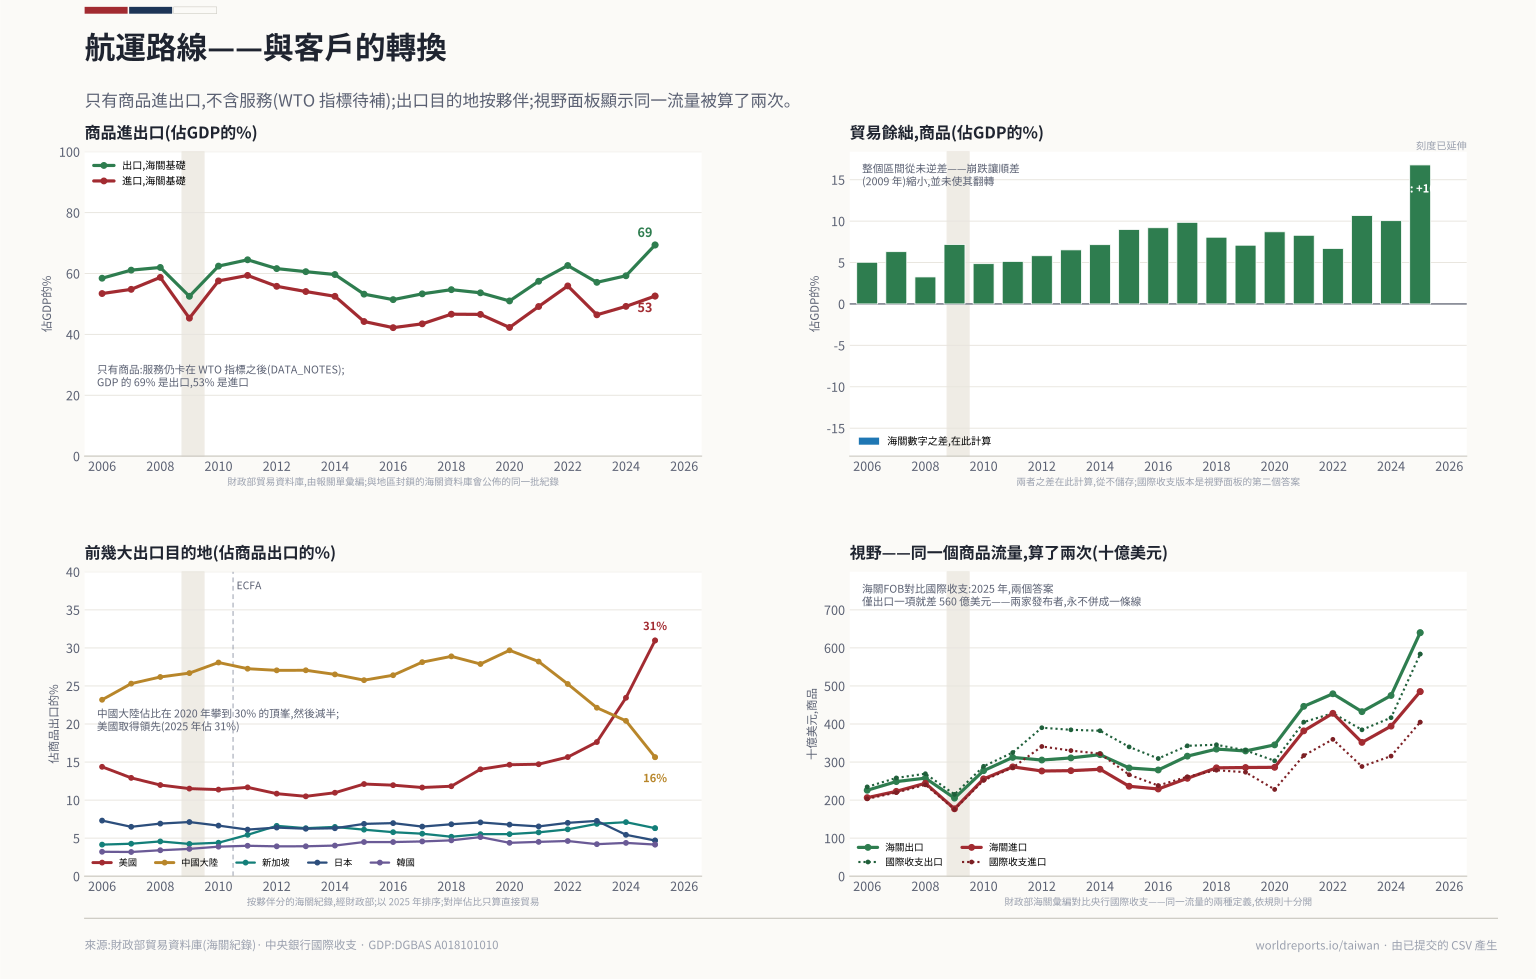
trade/goods.csv | VERIFIED. Goods exports/imports, USD thousands: 2025 exports US$639.96bn, imports US$485.11bn. This is the goods substitute for UN Comtrade/WTO… | MOF 國際貿易統計資料庫 DPAS i9111 — customs-compiled goods totals (USD) | 2006-2025 | Official |
|---|
trade/partners.csv | VERIFIED. Each top destination is a single-country codelist query (codlst0 selects one country, codlst1=出口/進口) so export and import series per… | MOF 國際貿易統計資料庫 DPAS i9111 — trade value by country (USD), top destinations | 2006-2025 | Official |
|---|
world/bop_goods.csv | VERIFIED, annual, USD millions. Goods on the BALANCE-OF-PAYMENTS basis (商品-收入/支出) plus the current account — a SECOND trade definition to the MOF… | Central Bank (CBC) cpx.cbc.gov.tw PCAxis BPP2Y01 — balance of payments, current account and goods | 2006-2025 | Official |
|---|
world/reserves.csv | VERIFIED, monthly since 1992M01. Dec period-end, US$ millions: series runs ~US$266bn (2006) up to ~US$603bn (2025) — among the world's largest. IMF… | Central Bank (CBC) cpx.cbc.gov.tw PCAxis EF07M01 — foreign-exchange reserves (外匯存底, mn USD), Dec | 2006-2025 | Official |
|---|
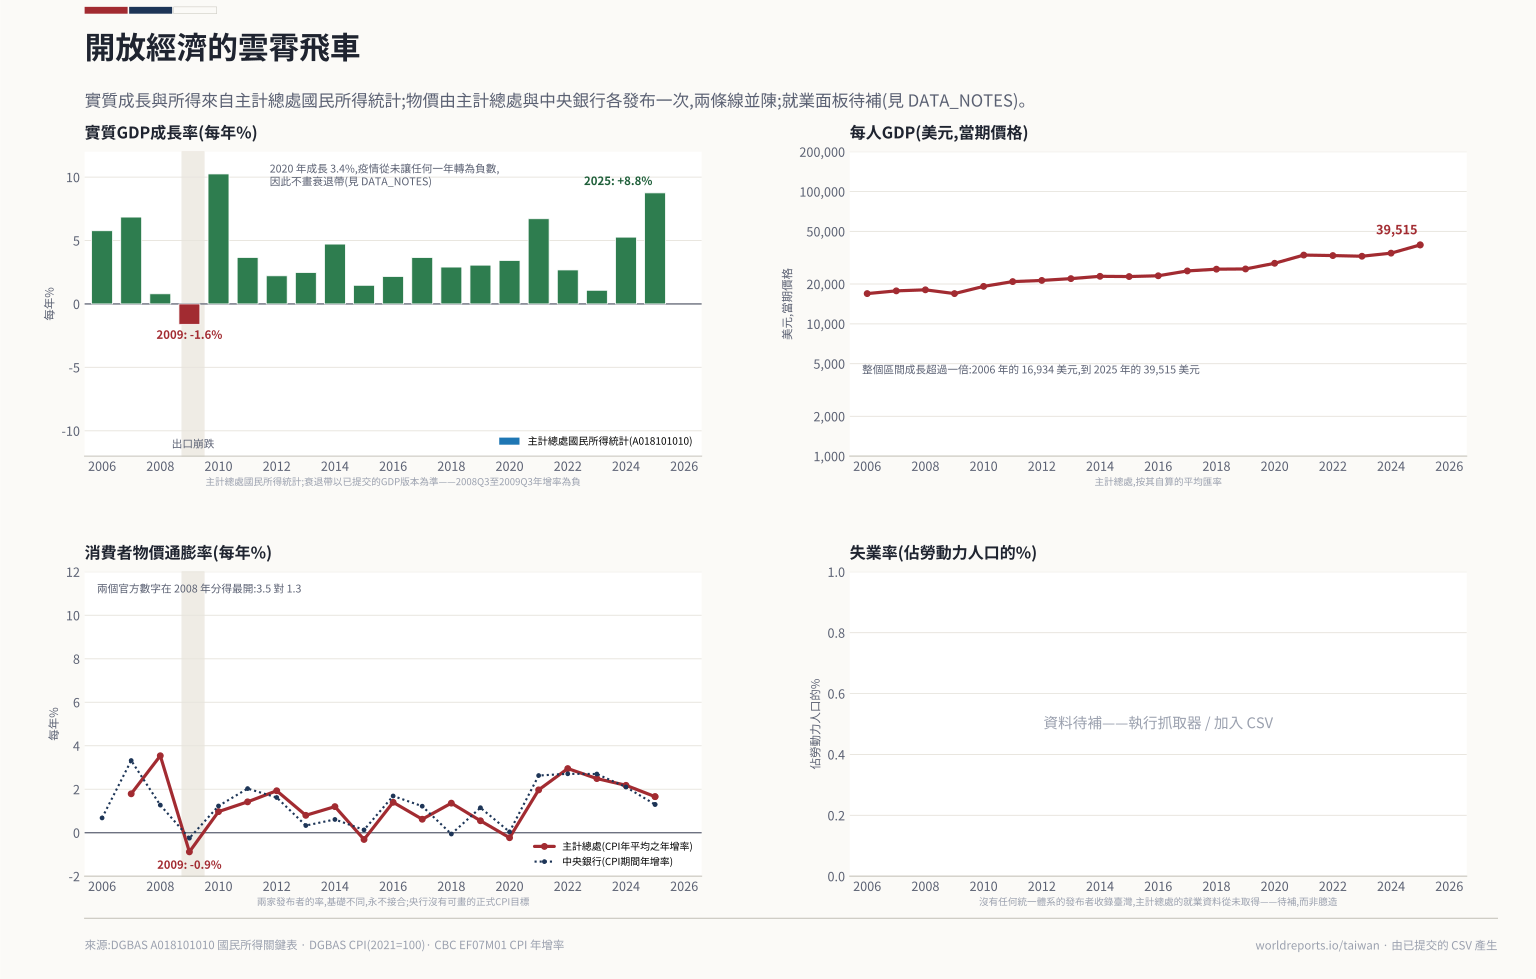 Plate 01