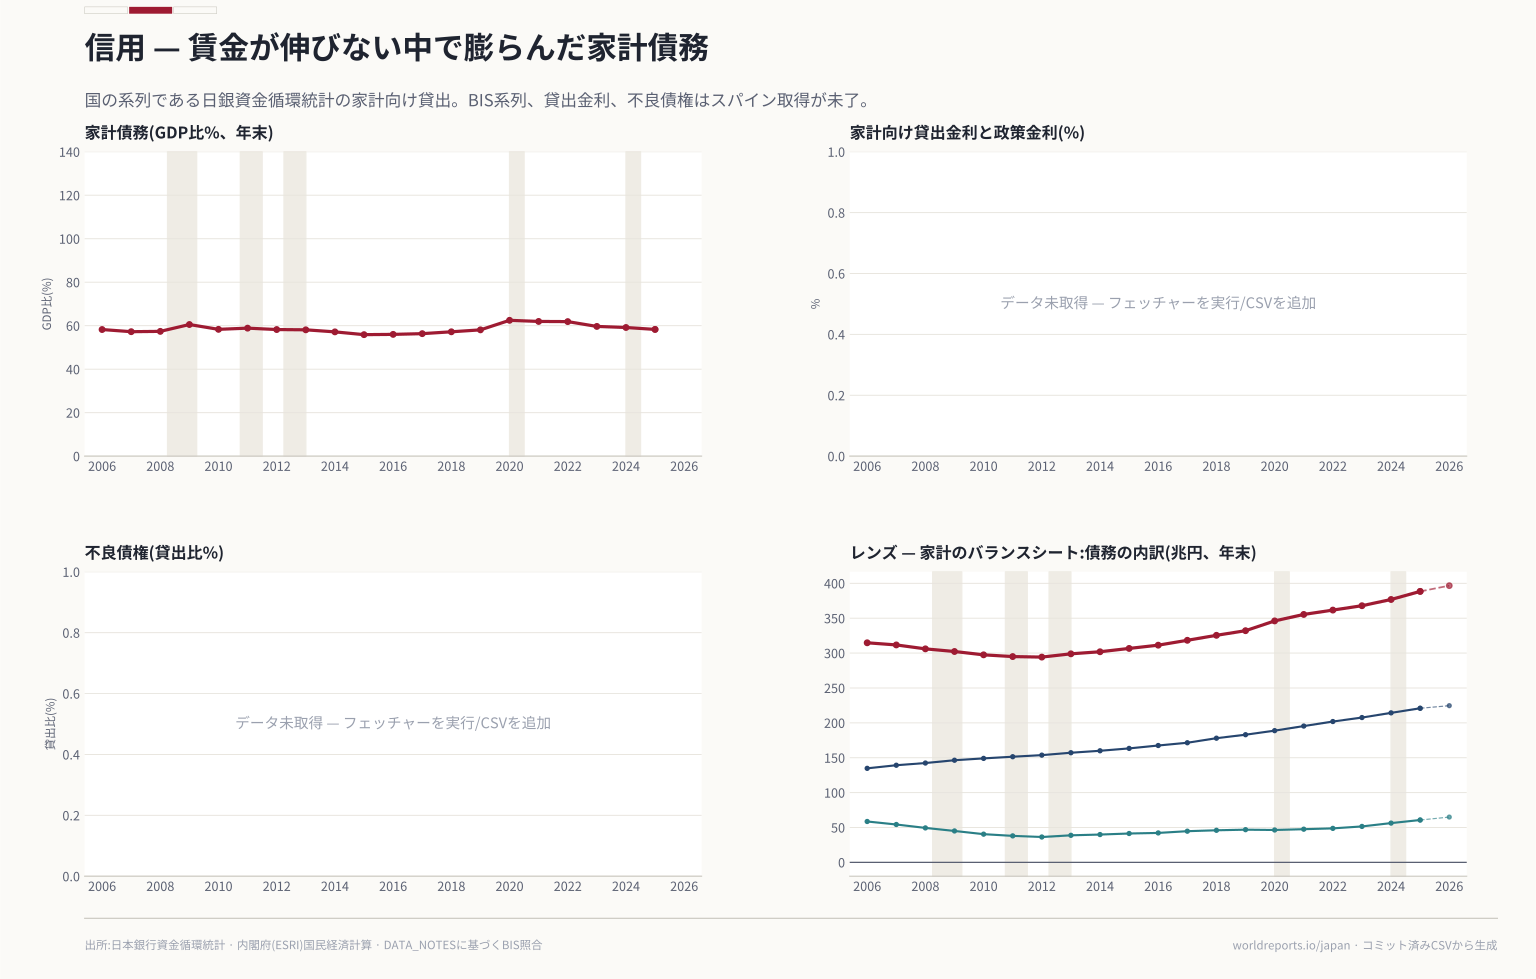
credit/household_debt_from_boj.csv | SIDECAR: ¥ BILLION (published ¥100 MILLION ÷ 10), one row per year at its December (Q4) stock, running year at its latest quarter (asof_quarter)… | Bank of Japan — Flow of Funds, Households, Liabilities/Loans (FOF_FFAS430L200), housing loans (L241), consumer credit (L242) | 2006-2026 | Official |
|---|
demography/census_from_stat.csv | CORRECTED at consolidation: the sidecar is read from e-Stat table 2-3 of the 2025 release (statInfId 000040506655; 2020 re-tabulated on the same… | Statistics Bureau of Japan — 2020 and 2025 Population Census, basic tabulation table 2-3, imputed reference tables (不詳補完値) | — | Official |
|---|
demography/life_expectancy_from_mhlw.csv | CORRECTED at consolidation: the year series is life25-13.xlsx (参考資料2), not life25-12. The ministry's own series uses the COMPLETE table in census… | MHLW — Abridged Life Tables 2025 (簡易生命表), year series 参考資料2, plus census-year abridged and complete tables | 2006-2025 | Official |
|---|
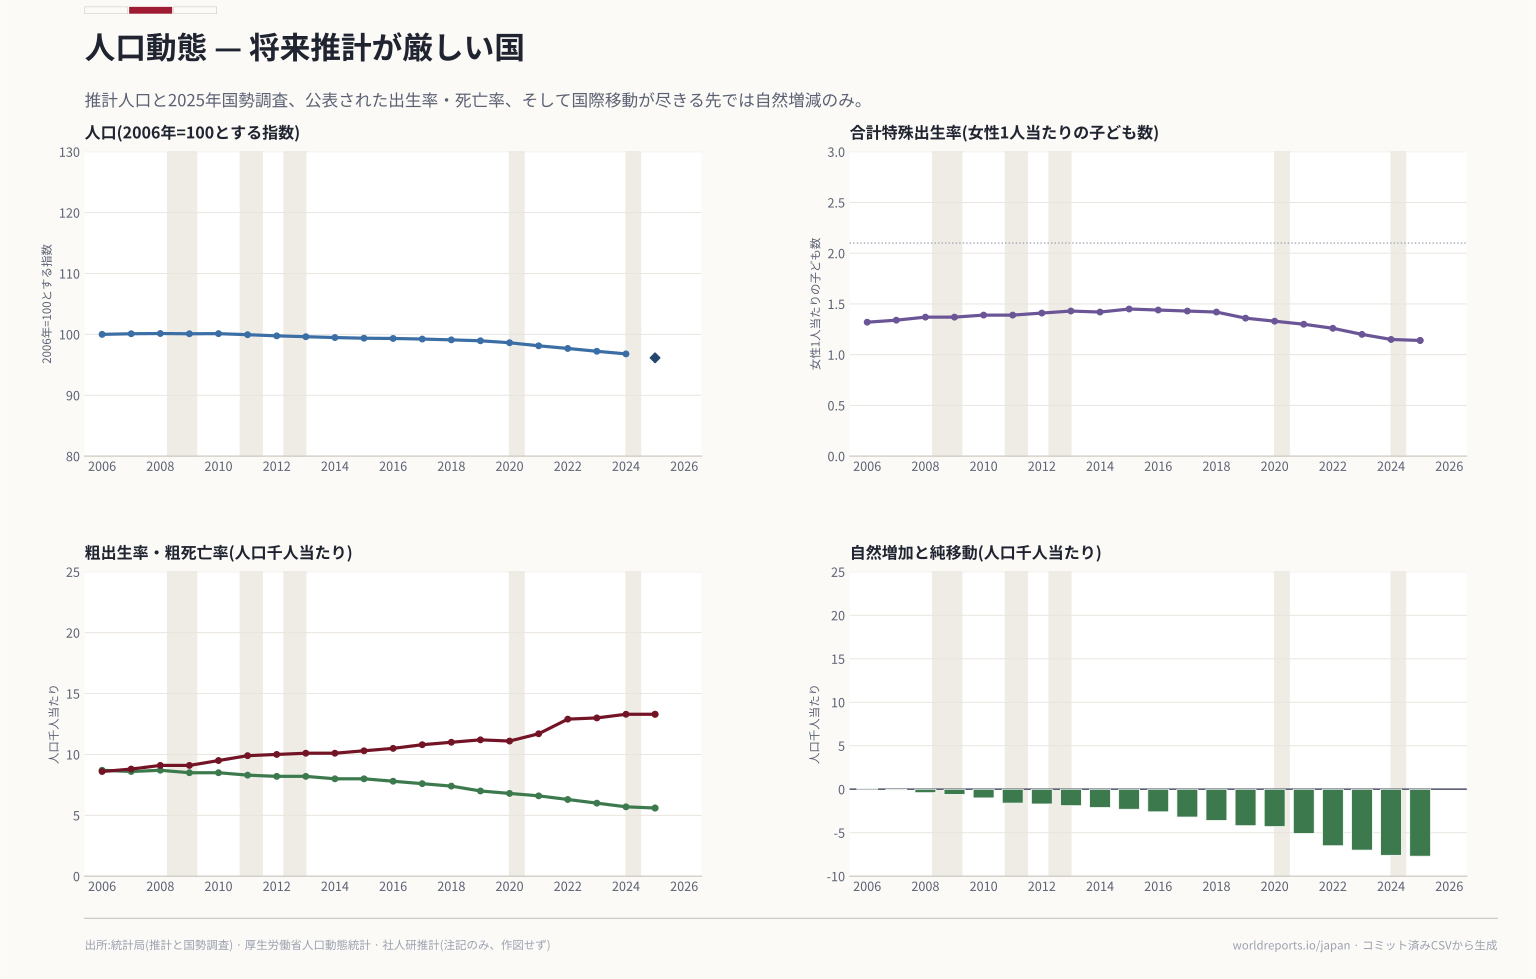
demography/population_from_stat.csv | Total and JAPANESE population on 1 October, THOUSANDS, by sex. Long series (intercensally adjusted) verified: 2006 127,901 · 2010 128,057 (census) ·… | Statistics Bureau of Japan — Population Estimates (人口推計), long series 2000–2020 and annual 1 October estimates | 2006-2024 | Official |
|---|
demography/projection_from_ipss.csv | Page verified (2020-census base, nine variants: three fertility × three mortality; total population including foreigners resident ≥3 months)… | IPSS — Population Projections for Japan (2023), 2021–2070 | 2020-2070 | Official |
|---|
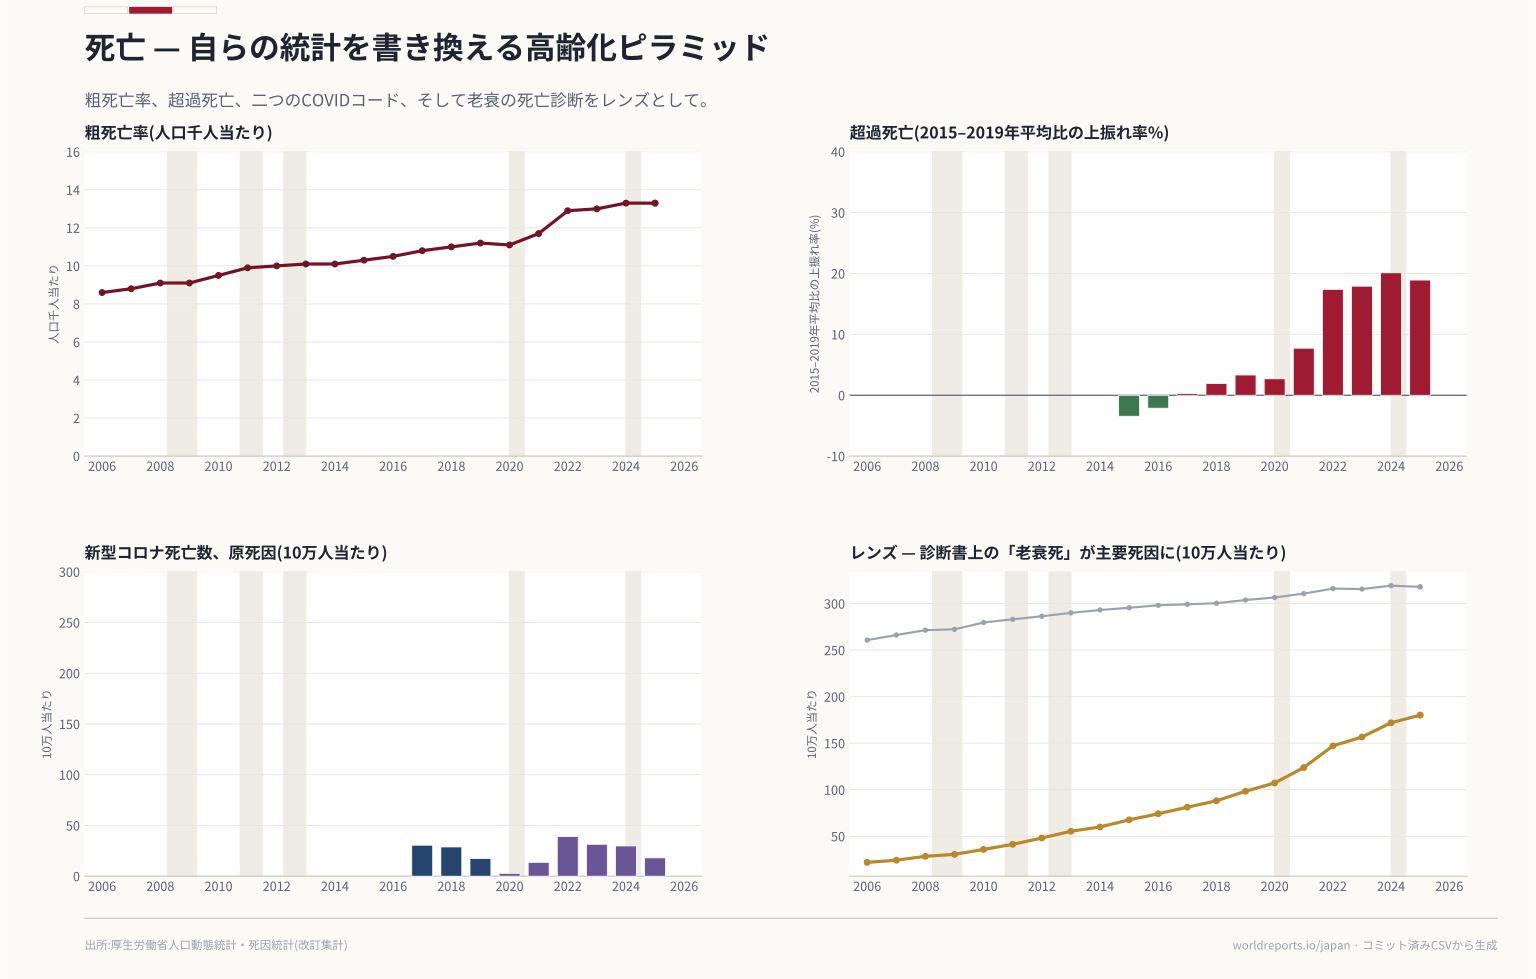
demography/vital_from_mhlw.csv | CORRECTED at consolidation: the long series comes from the NEWEST final edition's own 第2表/第3表 (人口動態総覧の年次推移, back to 1899, already revised), resolved… | MHLW — Vital Statistics 2025 final (人口動態統計 確定数), 第2表/第3表 人口動態総覧の年次推移 | 2006-2025 | Official |
|---|
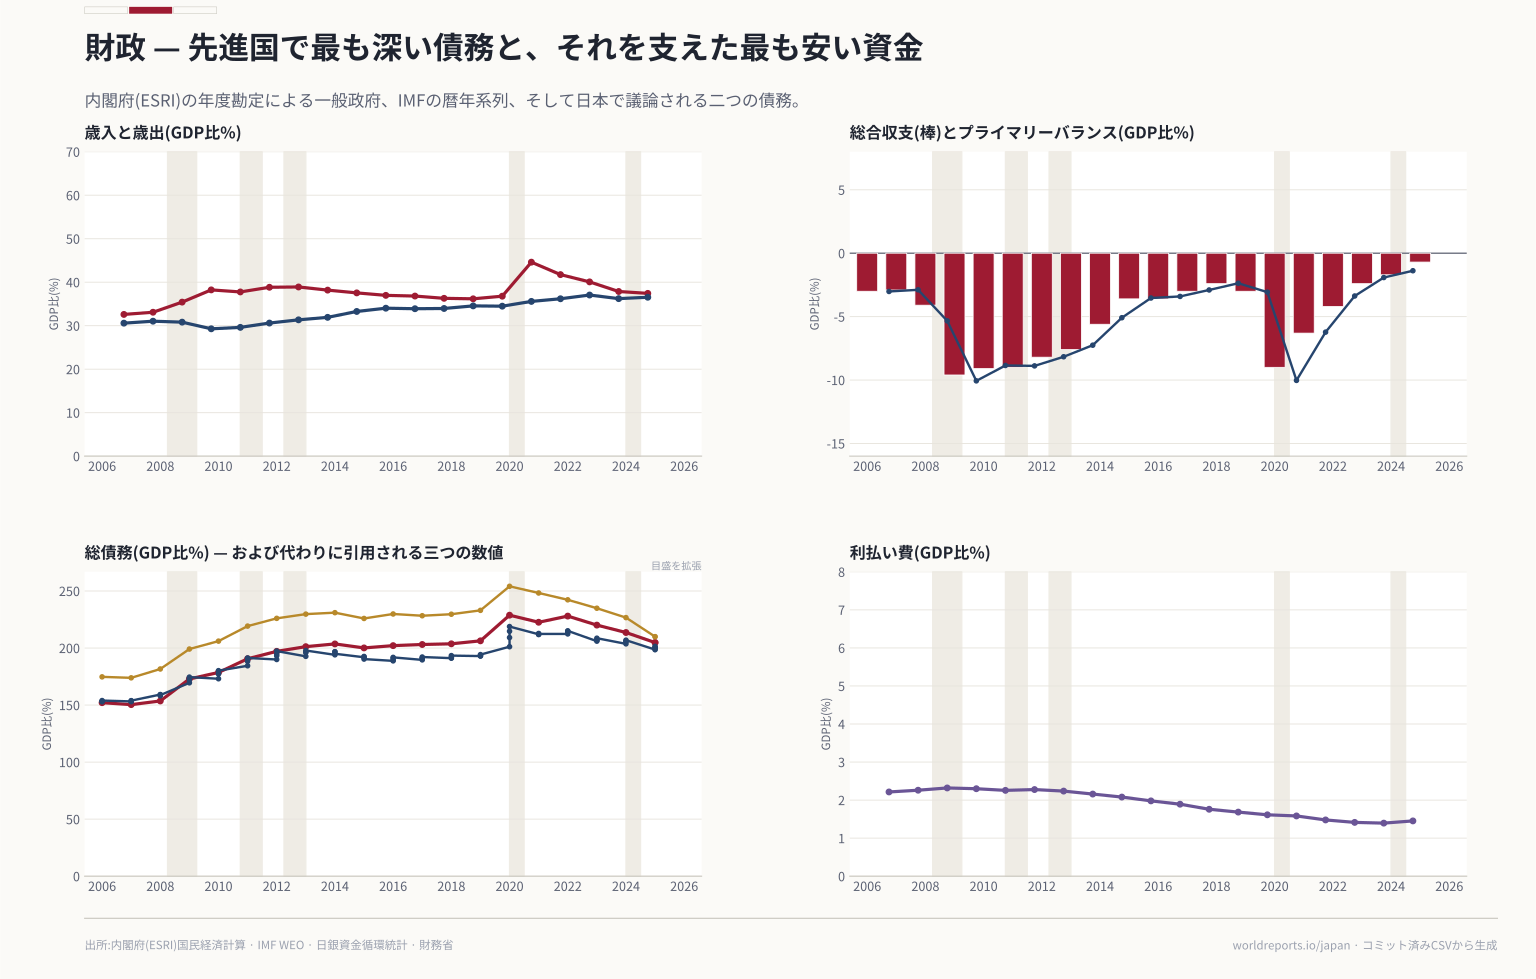
fiscal/central_debt_from_mof.csv | Central-government debt at FACE value, quarter-ends, published in ¥100 MILLION; the SIDECAR is ¥ BILLION. CORRECTED at consolidation: total = 内国債… | MOF — 国債及び借入金並びに政府保証債務現在高, 最近5年間の推移 | 2006-2026 | Official |
|---|
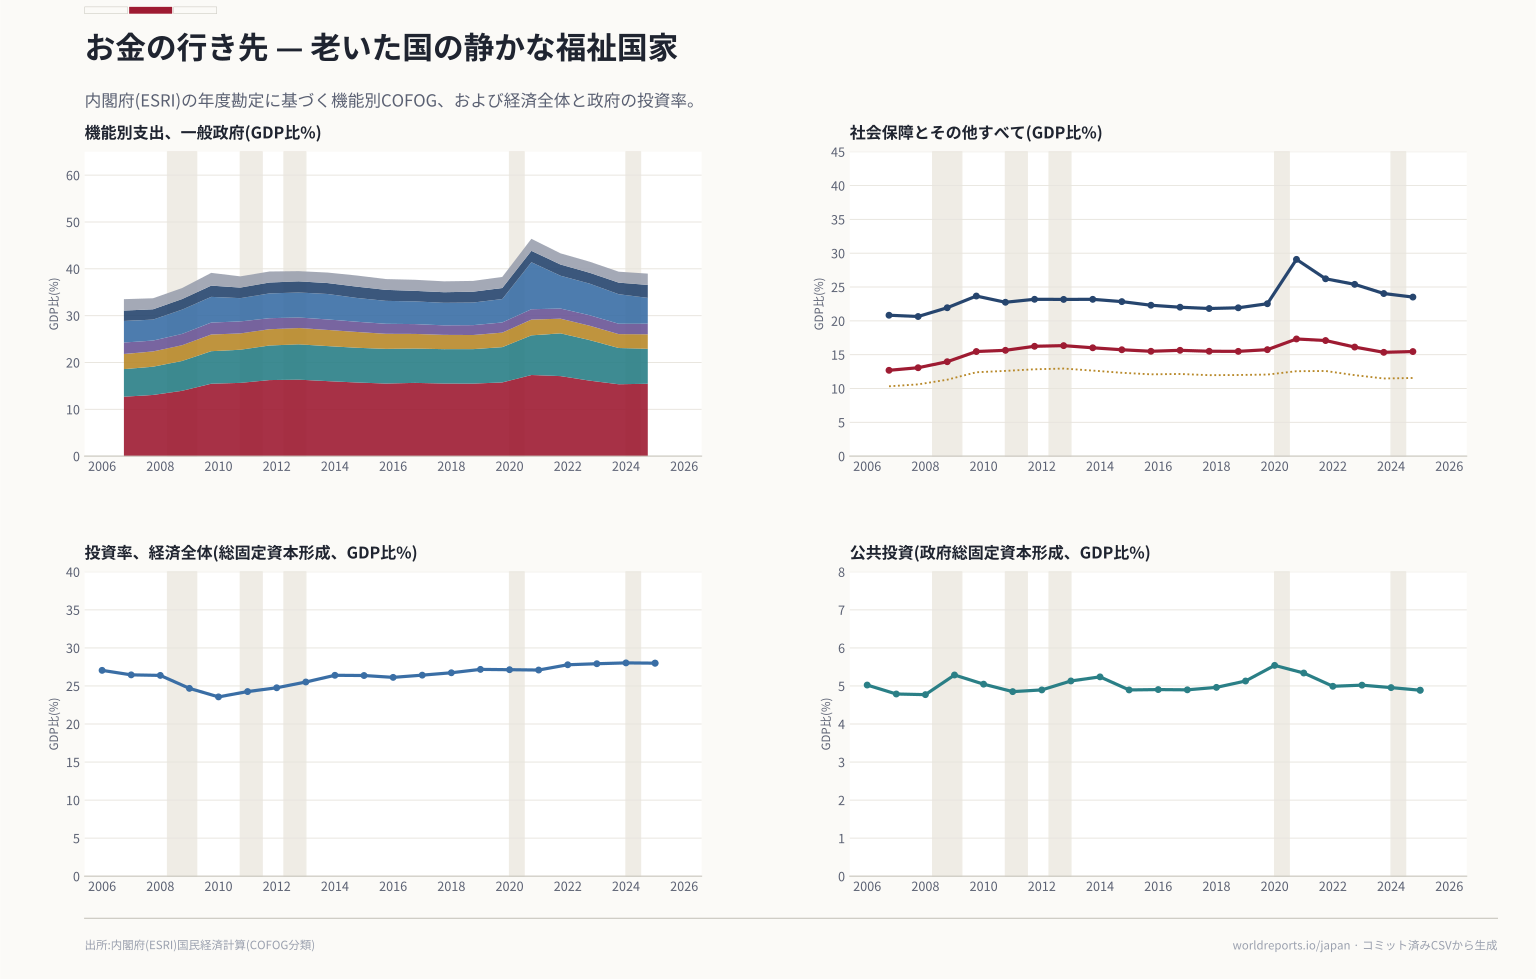
fiscal/cofog_from_esri.csv | General-government expenditure by function, ONE SHEET PER FISCAL YEAR named in wareki (平成17 … 令和6 = FY2005 … FY2024), ¥bn. Table 8 (2024s8_jp.xlsx)… | Cabinet Office ESRI — Annual national accounts FY2024, table 7 一般政府の機能別支出 (COFOG) | — | Official |
|---|
fiscal/general_account_from_mof.csv | Budget and settlement of the general account by fiscal year. The statistics page (…/statistics/data.htm) lists 01.xlsx … 35.xlsx with a table number… | MOF — 財政統計 第1表 明治初年度以降一般会計歳入歳出予算決算 (and 第2表 from FY1963) | — | Official |
|---|
fiscal/gg_accounts_from_esri.csv | General government sector accounts, FISCAL years 1994–2024, ¥bn, two sheets (経常・資本取引 current and capital transactions; 金融資産・負債 financial… | Cabinet Office ESRI — Annual national accounts FY2024 (2020 base), table 6(2) 一般政府の部門別勘定 | — | Official |
|---|
fiscal/gg_liabilities_from_boj.csv | CORRECTED at consolidation — the discovery note was wrong. FOF_FFAS420L900 "Liabilities/Total/General government" is NOT the government's… | Bank of Japan — Flow of Funds (2008 SNA), General government, stocks (L900 − L700 liabilities; L300, L200, A900, L700) | 2006-2026 | Official |
|---|
fiscal/tax_revenue_from_mof.csv | Legacy .xls, published in ¥100 MILLION (億円); the SIDECAR is ¥ BILLION (÷10). FISCAL years keyed by era year and Western year (both in the sheet… | MOF — 一般会計税収の推移 (general-account tax revenue since FY1979) | — | Official |
|---|
international/gdp_pc_from_wb.csv | Verified 2024 US$33,797, 2025 US$35,951. | World Bank — NY.GDP.PCAP.CD | 2006-2026 | Other |
|---|
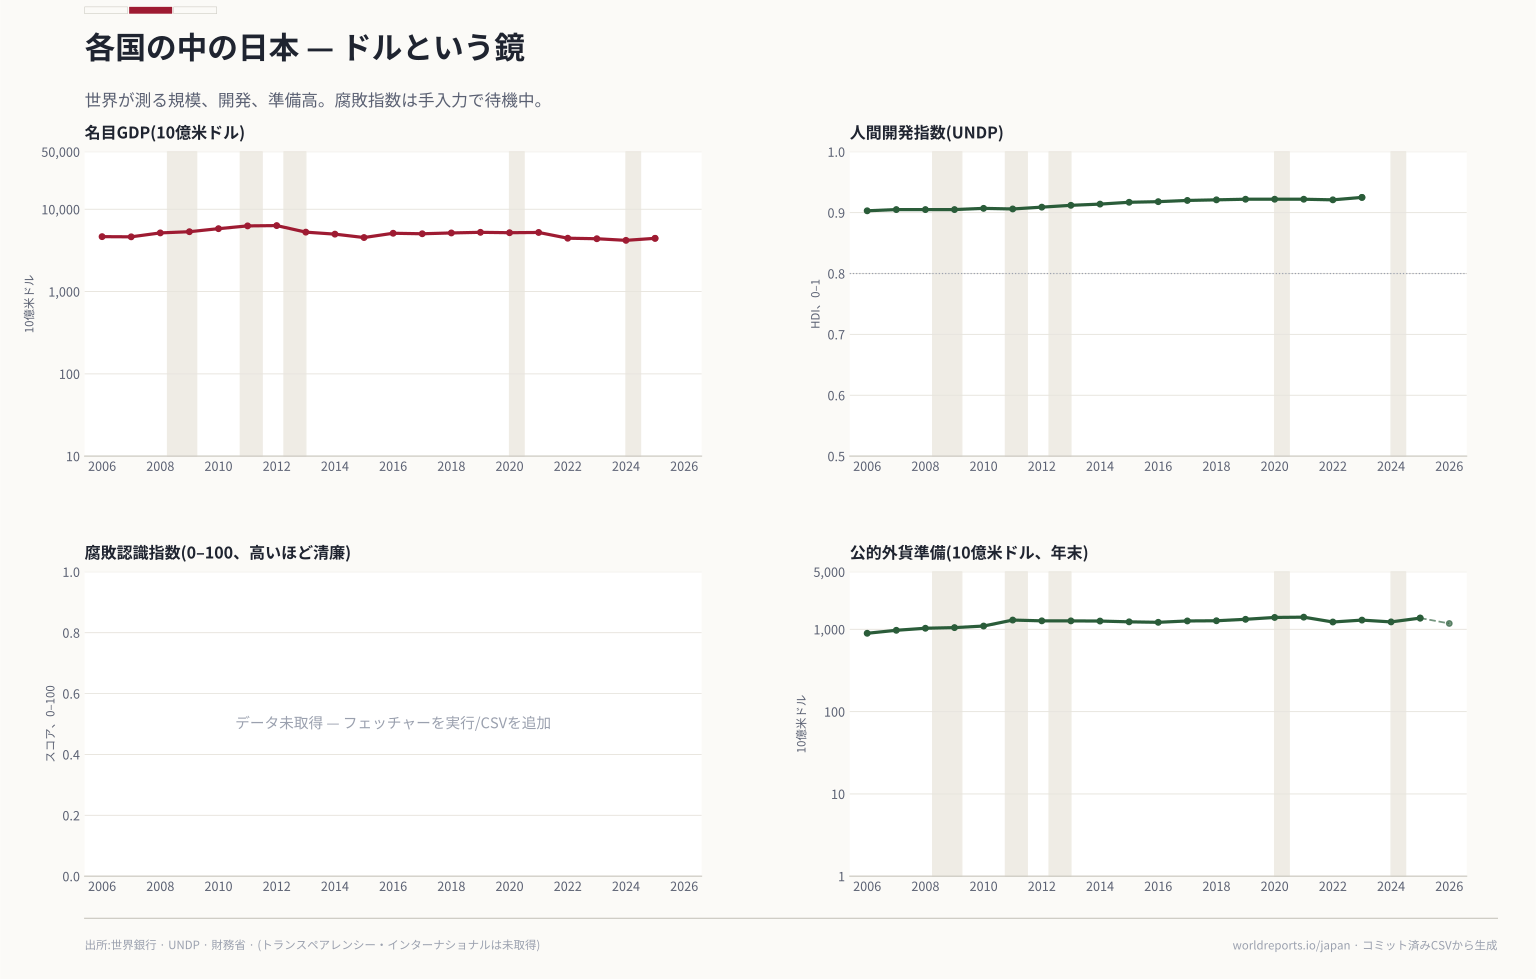
international/gdp_usd_from_wb.csv | Verified (lastupdated 2026-10-08): 2006 US$4.648tn, 2020 5.189tn, 2024 4.190tn, 2025 4.435tn. Agrees with ESRI ¥636.9tn at the 2024 average… | World Bank — NY.GDP.MKTP.CD | 2006-2026 | Other |
|---|
international/gg_fiscal_from_imf.csv | General government, % of GDP, 1980–2031 (years after 2025 are PROJECTIONS — `kind: projection`, drawn dashed). Verified gross debt 2006 152.1 · 2020… | IMF DataMapper (WEO) — GGXWDG_NGDP (gross debt), GGXCNL_NGDP (net lending), NGDPD | 1980-2031 | Other |
|---|
international/hdi_from_undp.csv | Latin-1 CSV, send a browser UA. Verified JPN hdi_2006 0.903, hdi_2023 0.925, rank 23. One vintage throughout. | UNDP — Human Development Report 2025, composite indices complete time series | 2006-2023 | Other |
|---|
international/openness_from_wb.csv | Verified non-null to 2024 (44.9%); 2025 blank and stays blank. | World Bank — NE.TRD.GNFS.ZS | 2006-2026 | Other |
|---|
international/population_from_wb.csv | Verified 2024 123,975,371 (mid-year) vs the Statistics Bureau's 123,802k on 1 October; 2025 123,366,734 (pre-census vintage). Cross-check only. | World Bank — SP.POP.TOTL | 2006-2026 | Other |
|---|
international/reserves_from_mof.csv | Monthly, US$ MILLIONS, from April 2000, Shift_JIS, IMF template layout; the year is written only on the first month of each year (forward-fill it)… | MOF — 外貨準備等の状況 (International Reserves/Foreign Currency Liquidity), historical.csv | 2006-2026 | Official |
|---|
international/reserves_from_wb.csv | | World Bank — FI.RES.TOTL.CD (IMF IFS) | 2006-2026 | Other |
|---|
macro/cpi_from_stat.csv | CORRECTED at consolidation: the sidecar is built from e-Stat's long monthly series on EACH base (2020=100: index statInfId 000032103842, published… | Statistics Bureau of Japan (MIC) — Consumer Price Index, 2020-base and 2025-base national long series (e-Stat 中分類指数 and 前年同月比) | — | Official |
|---|
macro/cpi_tokyo_from_stat.csv | CORRECTED at consolidation: from the e-Stat 2025-base Tokyo long series (index 000040482965, published rates 000040482975), checked against… | Statistics Bureau of Japan — CPI, Tokyo ku-area (preliminary), 2025 base, e-Stat long series | — | Official |
|---|
macro/gdp_from_esri.csv | Expenditure-side GDP, 2020 benchmark (2020-base chained yen, 2008 SNA), ¥ BILLIONS (10億円), Shift_JIS CSV with a five-row bilingual header; row labels… | Cabinet Office ESRI — Quarterly Estimates (QE), 2026 Apr–Jun second preliminary, gaku-mcy / gaku-mfy / gaku-jcy | 1994-2025 | Official |
|---|
macro/gdp_quarterly_from_esri.csv | Real GDP, SA, chained 2020 yen, ¥bn, 1994 Q1 – 2026 Q2. ANNUALISED: the header says "*年率で表示している" — the quarterly levels are at annual rates (2026 Q2… | Cabinet Office ESRI — QE real seasonally adjusted series, gaku-jk | — | Official |
|---|
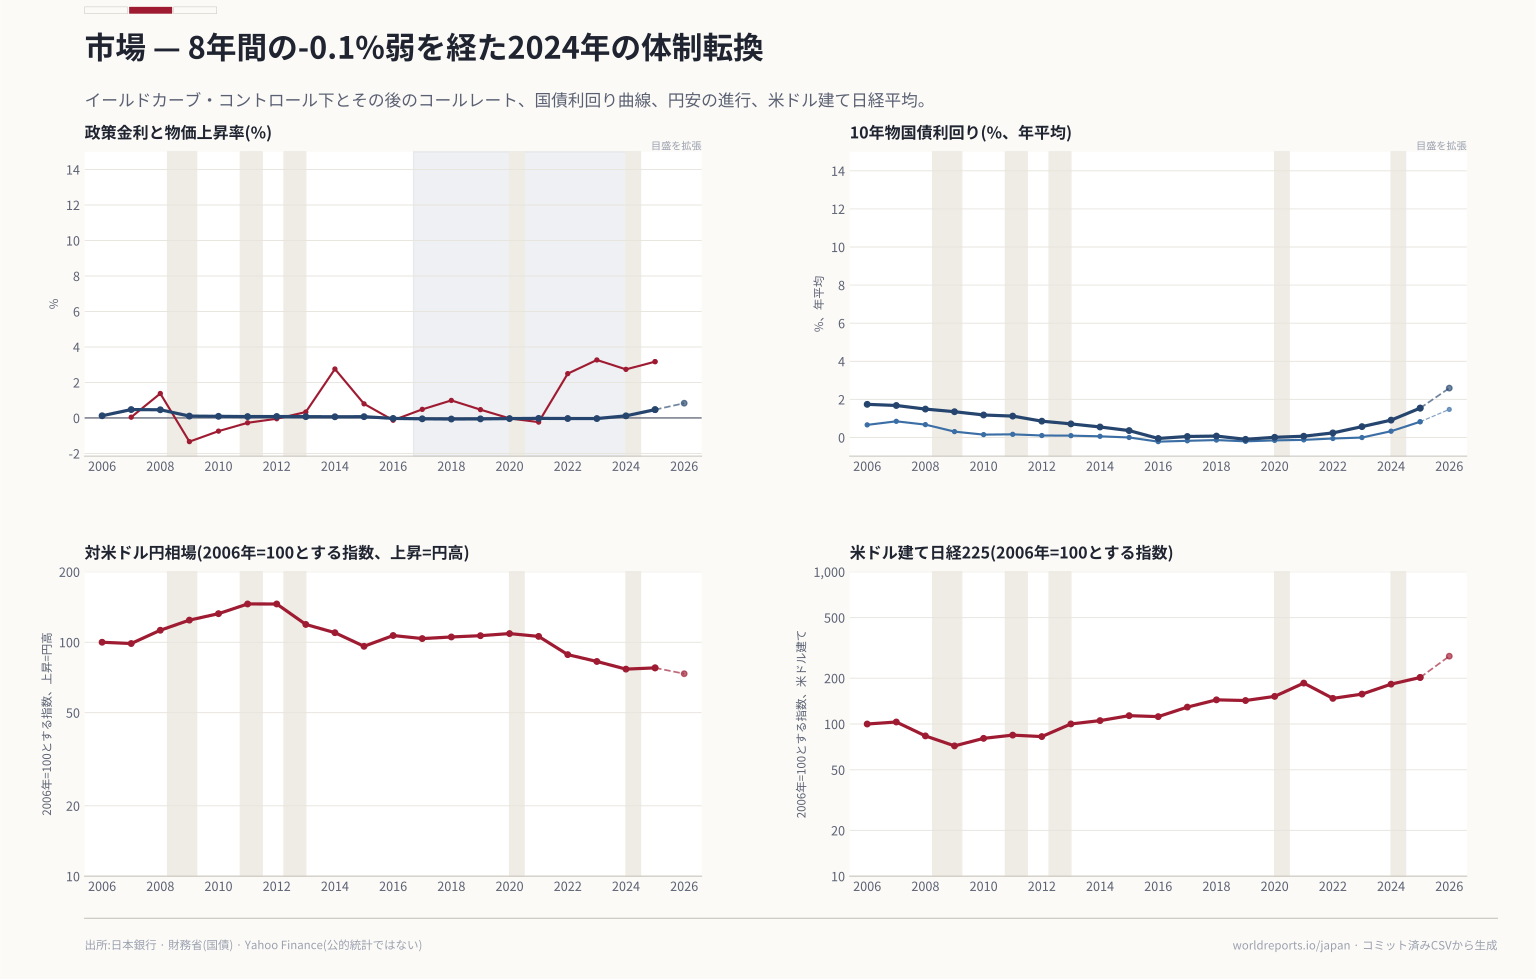
markets/jgb_from_mof.csv | Daily yields 1–40 years, % p.a., Shift_JIS, ~1.2MB, from S49.9.24 (1974-09-24). Dates are WAREKI strings (S49.9.24, H18.1.4, R8.9.30); tenors not yet… | MOF — 国債金利情報 (JGB constant-maturity yields), jgbcm_all.csv + jgbcm.csv | 2006-2026 | Official |
|---|
markets/monetary_base_from_boj.csv | Published in ¥100 MILLION, monthly; the SIDECAR is ¥ BILLION, one row per year at its December reading (running year at its latest month… | Bank of Japan — MD01 MABS1AN11 (monetary base, average amounts outstanding) | 2006-2026 | Official |
|---|
markets/nikkei_from_yahoo.csv | Monthly closes, JPY, 1996-11 → 2026-10 once the JST offset is applied (the first bar, stamped 1996-10-31 15:00 UTC, is November; the running month is… | Nikkei Inc. (Nikkei Stock Average), redistributed by Yahoo Finance (^N225) | — | Other |
|---|
markets/rates_from_boj.csv | The BoJ API (anonymous, no key; manual at https://www.stat-search.boj.or.jp/info/api_manual_en.pdf; ≤250 series and ≤60,000 data points per request… | Bank of Japan — Time-Series Data Search API, FM02 STRACLUCON / FM01 STRDCLUCON / IR01 MADR1M | 2006-2026 | Official |
|---|
markets/reer_from_boj.csv | Nominal (FX180110001) and real (FX180110002) effective rates, monthly, CY2020=100. The pre-2010 series (FXCP7JP/FXCP8JP, March 1973=100) is… | Bank of Japan — FM09 FX180110002 (real effective exchange rate, CY2020=100) | 2006-2026 | Official |
|---|
markets/usdjpy_from_boj.csv | Yen per U.S. dollar, Tokyo market. Verified annual means of the monthly averages: 2006 116.28, 2011 79.78, 2012 79.79, 2015 121.02, 2022 131.37, 2024… | Bank of Japan — FM08 FXERM07 (USD/JPY 17:00 JST, monthly average), FXERM06 (end of month) | 2006-2026 | Official |
|---|
migration/asylum_from_unhcr.csv | JSON, items per year × procedure × app_type (N = new, A = appeal) × dec_level (FI first instance, AR appeal/review). Verified 2022 new first-instance… | UNHCR Refugee Data Finder API — asylum-applications and asylum-decisions, coa=JPN | 2006-2025 | Other |
|---|
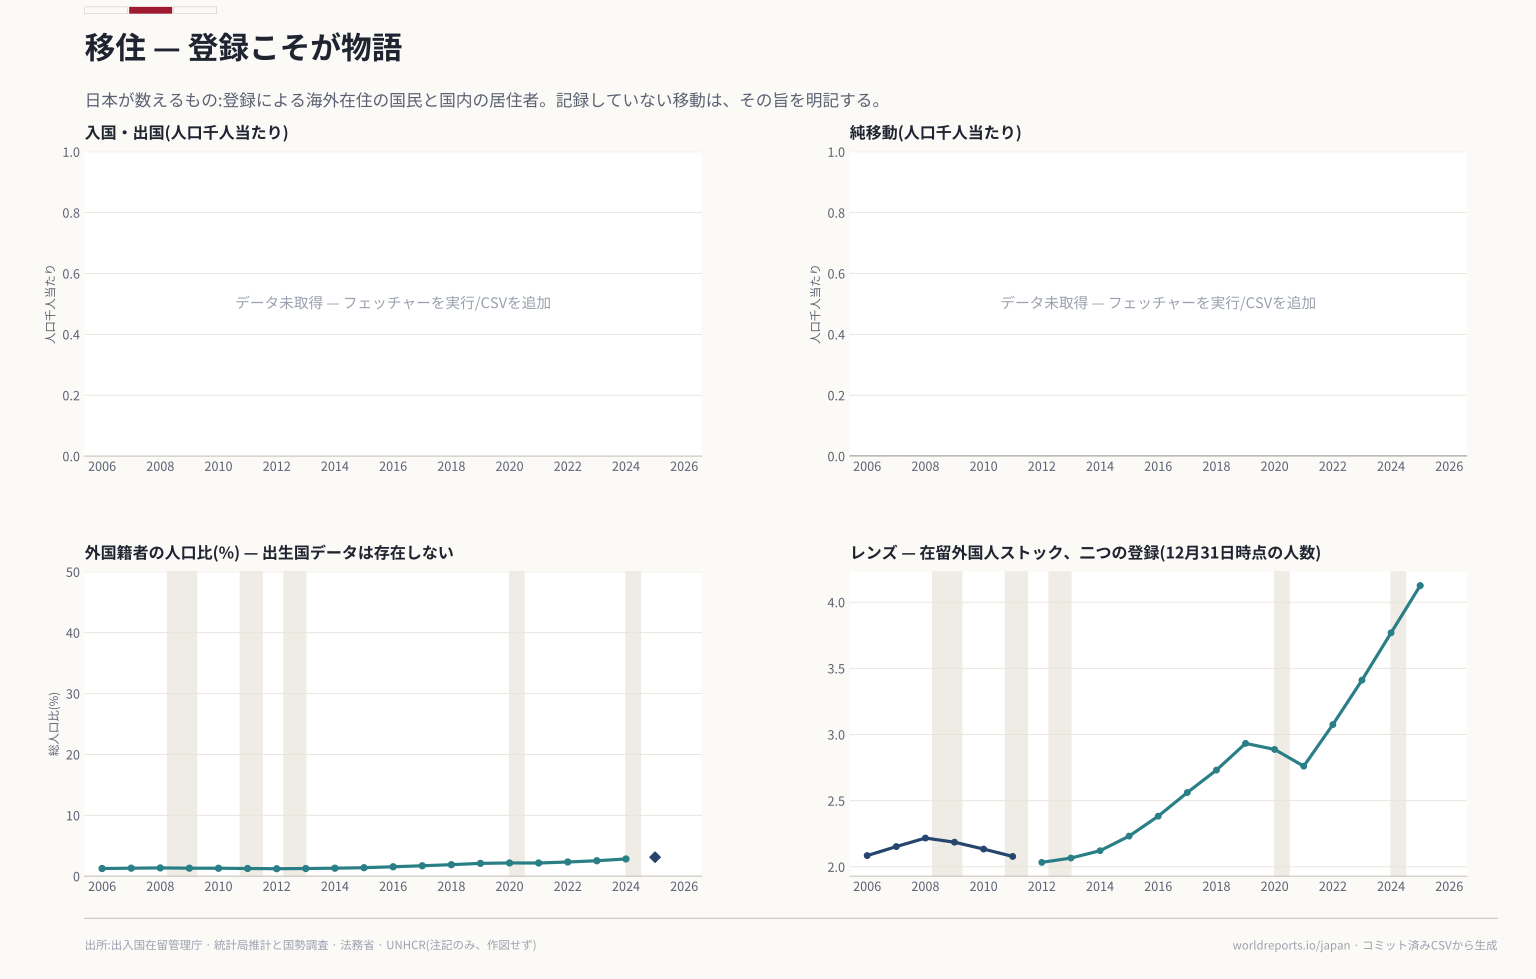
migration/entrants_from_isa.csv | New entrants (first entry, excluding re-entry) by nationality × status of residence. Year index on… | Immigration Services Agency — 出入国管理統計 (immigration control statistics), annual, table 25-00-05 新規入国外国人 by status | 2006-2025 | Official |
|---|
migration/foreign_residents_from_isa.csv | Stock at end-June and end-December by nationality × status of residence; period index (lids) on… | Immigration Services Agency — 在留外国人統計 (statistics on foreign residents), semi-annual | 2006-2025 | Official |
|---|
migration/naturalisation_from_moj.csv | PDF table from 1952, page https://www.moj.go.jp/MINJI/toukei_t_minj03.html. Verified 2025: applications 14,103, granted 9,258 (Korea/North Korea… | MOJ Civil Affairs Bureau — 帰化許可申請者数、帰化許可者数及び帰化不許可者数の推移 | 2006-2025 | Official |
|---|
mortality/causes_from_mhlw.csv | Deaths by the abridged cause list (死因簡単分類), each year's edition a separate file whose NAME CHURNS: kakutei06/xls/hyo.xls, kakutei08 split files… | MHLW — Vital Statistics final, 第8表 死因簡単分類別にみた性別死亡数 (per-year editions) | 2006-2025 | Official |
|---|
published/asylum_unhcr.csv | Reviewed 2026-10-23; byte-identical to the staged publisher sidecar. | UNHCR Refugee Data Finder API — asylum-applications and asylum-decisions, coa=JPN | 2006-2025 | Other |
|---|
published/causes_mhlw.csv | Reviewed 2026-10-23; byte-identical to the staged publisher sidecar. | MHLW — Vital Statistics final, 第8表 死因簡単分類別にみた性別死亡数 (per-year editions) | 2006-2025 | Official |
|---|
published/census_stat.csv | Reviewed 2026-10-23; byte-identical to the staged publisher sidecar. | Statistics Bureau of Japan — 2020 and 2025 Population Census, basic tabulation table 2-3, imputed reference tables (不詳補完値) | — | Official |
|---|
published/central_debt_mof.csv | Reviewed 2026-10-23; byte-identical to the staged publisher sidecar. | MOF — 国債及び借入金並びに政府保証債務現在高, 最近5年間の推移 | 2006-2026 | Official |
|---|
published/cofog_esri.csv | Reviewed 2026-10-23; byte-identical to the staged publisher sidecar. | Cabinet Office ESRI — Annual national accounts FY2024, table 7 一般政府の機能別支出 (COFOG) | — | Official |
|---|
published/cpi_stat.csv | Reviewed 2026-10-23; byte-identical to the staged publisher sidecar. | Statistics Bureau of Japan (MIC) — Consumer Price Index, 2020-base and 2025-base national long series (e-Stat 中分類指数 and 前年同月比) | — | Official |
|---|
published/cpi_tokyo_stat.csv | Reviewed 2026-10-23; byte-identical to the staged publisher sidecar. | Statistics Bureau of Japan — CPI, Tokyo ku-area (preliminary), 2025 base, e-Stat long series | — | Official |
|---|
published/current_account_boj.csv | Reviewed 2026-10-23; byte-identical to the staged publisher sidecar. | Bank of Japan / MOF — Balance of Payments (BPM6), BP01 BPBP6JYNCB | 2006-2026 | Official |
|---|
published/entrants_isa.csv | Reviewed 2026-10-23; byte-identical to the staged publisher sidecar. | Immigration Services Agency — 出入国管理統計 (immigration control statistics), annual, table 25-00-05 新規入国外国人 by status | 2006-2025 | Official |
|---|
published/foreign_residents_isa.csv | Reviewed 2026-10-23; byte-identical to the staged publisher sidecar. | Immigration Services Agency — 在留外国人統計 (statistics on foreign residents), semi-annual | 2006-2025 | Official |
|---|
published/gdp_esri.csv | Reviewed 2026-10-23; byte-identical to the staged publisher sidecar. | Cabinet Office ESRI — Quarterly Estimates (QE), 2026 Apr–Jun second preliminary, gaku-mcy / gaku-mfy / gaku-jcy | 1994-2025 | Official |
|---|
published/gdp_pc_wb.csv | Reviewed 2026-10-23; byte-identical to the staged publisher sidecar. | World Bank — NY.GDP.PCAP.CD | 2006-2026 | Other |
|---|
published/gdp_quarterly_esri.csv | Reviewed 2026-10-23; byte-identical to the staged publisher sidecar. | Cabinet Office ESRI — QE real seasonally adjusted series, gaku-jk | — | Official |
|---|
published/gdp_usd_wb.csv | Reviewed 2026-10-23; byte-identical to the staged publisher sidecar. | World Bank — NY.GDP.MKTP.CD | 2006-2026 | Other |
|---|
published/general_account_mof.csv | Reviewed 2026-10-23; byte-identical to the staged publisher sidecar. | MOF — 財政統計 第1表 明治初年度以降一般会計歳入歳出予算決算 (and 第2表 from FY1963) | — | Official |
|---|
published/gg_accounts_esri.csv | Reviewed 2026-10-23; byte-identical to the staged publisher sidecar. | Cabinet Office ESRI — Annual national accounts FY2024 (2020 base), table 6(2) 一般政府の部門別勘定 | — | Official |
|---|
published/gg_fiscal_imf.csv | Reviewed 2026-10-23; byte-identical to the staged publisher sidecar. | IMF DataMapper (WEO) — GGXWDG_NGDP (gross debt), GGXCNL_NGDP (net lending), NGDPD | 1980-2031 | Other |
|---|
published/gg_liabilities_boj.csv | Reviewed 2026-10-23; byte-identical to the staged publisher sidecar. | Bank of Japan — Flow of Funds (2008 SNA), General government, stocks (L900 − L700 liabilities; L300, L200, A900, L700) | 2006-2026 | Official |
|---|
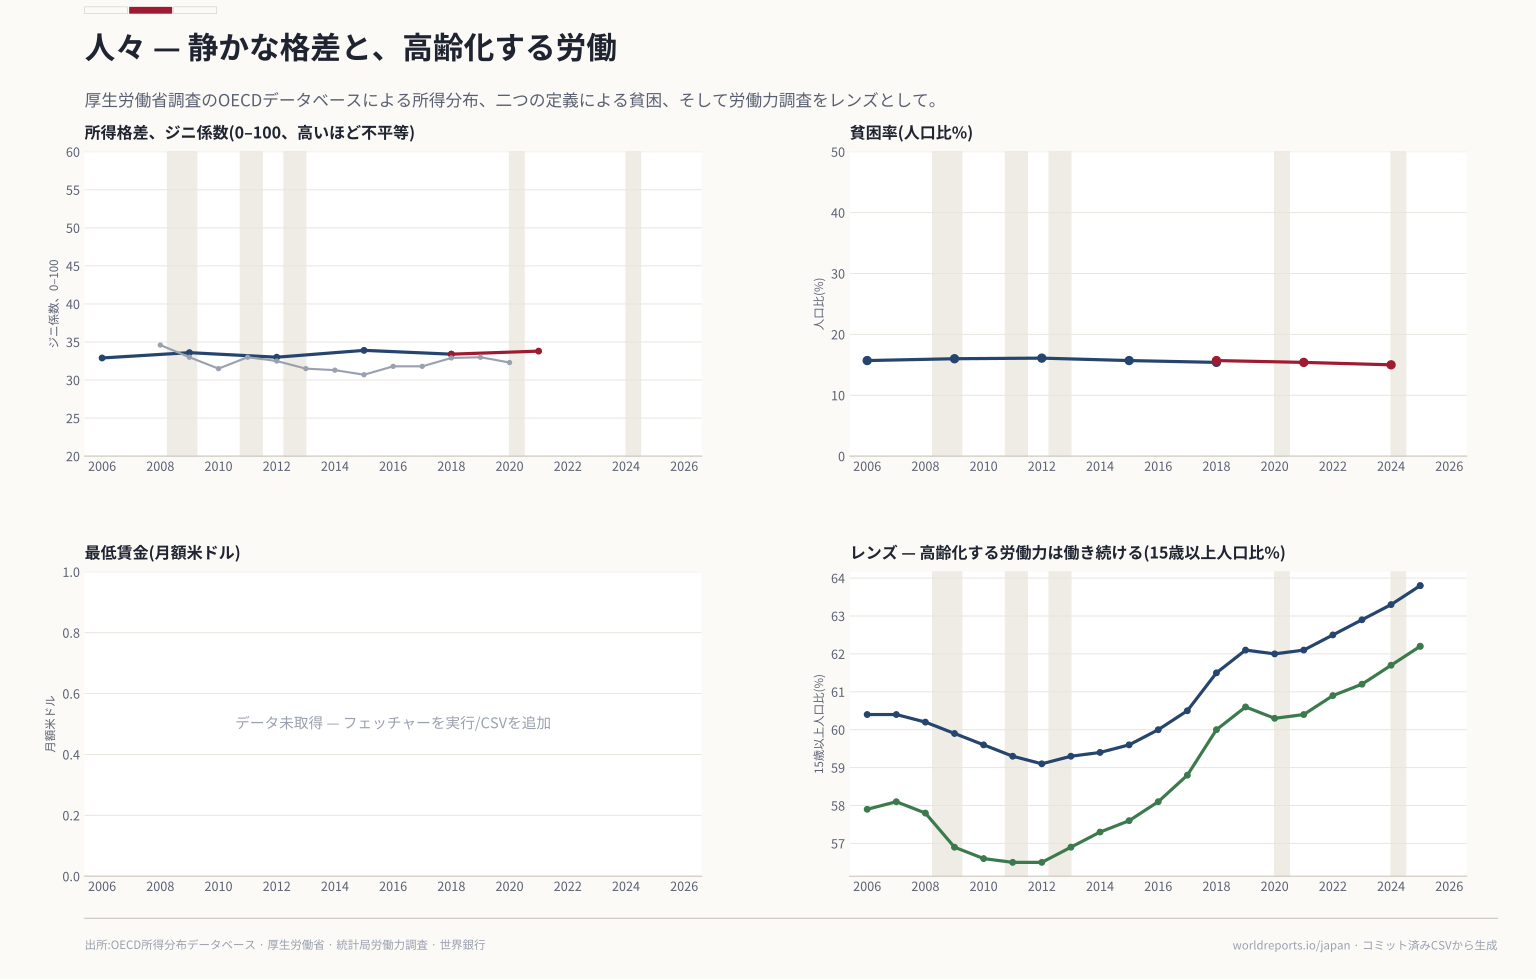
published/gini_oecd.csv | Reviewed 2026-10-23; byte-identical to the staged publisher sidecar. | OECD Income Distribution Database (DF_IDD), REF_AREA=JPN | 2006-2021 | Other |
|---|
published/gini_wb.csv | Reviewed 2026-10-23; byte-identical to the staged publisher sidecar. | World Bank — SI.POV.GINI | 2006-2026 | Other |
|---|
published/hdi_undp.csv | Reviewed 2026-10-23; byte-identical to the staged publisher sidecar. | UNDP — Human Development Report 2025, composite indices complete time series | 2006-2023 | Other |
|---|
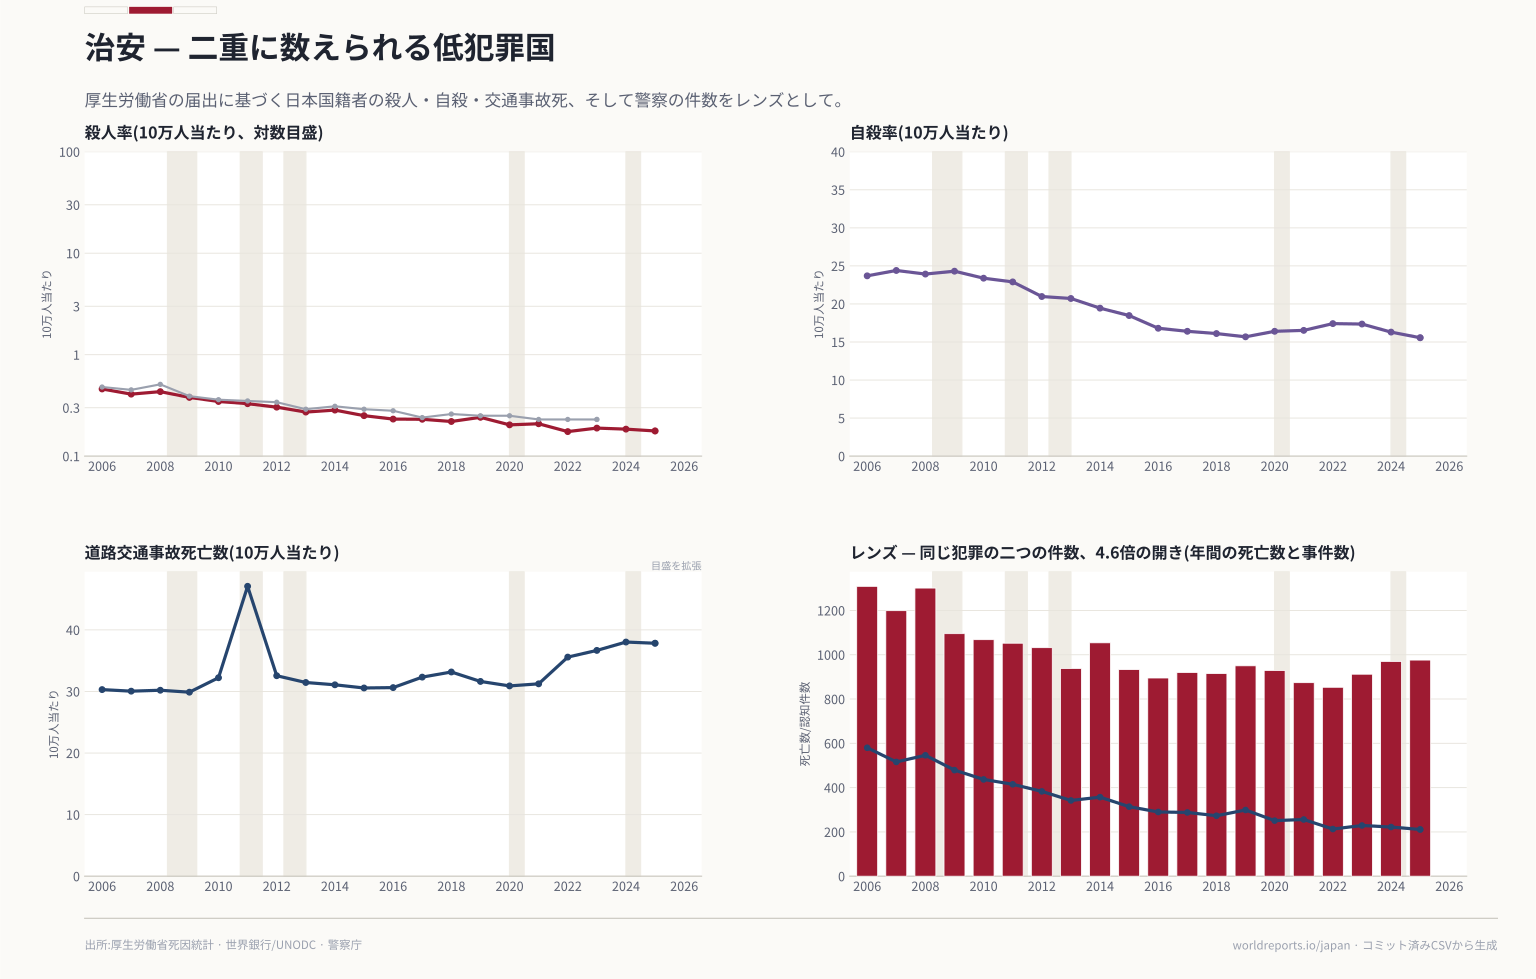
published/homicide_deaths_mhlw.csv | Reviewed 2026-10-23; byte-identical to the staged publisher sidecar. | MHLW — Vital Statistics, cause 20300 他殺 (assault) | 2006-2025 | Official |
|---|
published/homicide_police_npa.csv | Reviewed 2026-10-23; byte-identical to the staged publisher sidecar. | National Police Agency — 犯罪統計 (crime statistics), 刑法犯 罪種別 認知・検挙件数, 殺人 | 2006-2025 | Official |
|---|
published/homicide_rate_wb.csv | Reviewed 2026-10-23; byte-identical to the staged publisher sidecar. | World Bank — VC.IHR.PSRC.P5 (UNODC intentional homicides per 100,000) | 2006-2026 | Other |
|---|
published/household_debt_boj.csv | Reviewed 2026-10-23; byte-identical to the staged publisher sidecar. | Bank of Japan — Flow of Funds, Households, Liabilities/Loans (FOF_FFAS430L200), housing loans (L241), consumer credit (L242) | 2006-2026 | Official |
|---|
published/jgb_mof.csv | Reviewed 2026-10-23; byte-identical to the staged publisher sidecar. | MOF — 国債金利情報 (JGB constant-maturity yields), jgbcm_all.csv + jgbcm.csv | 2006-2026 | Official |
|---|
published/labour_stat.csv | Reviewed 2026-10-23; byte-identical to the staged publisher sidecar. | Statistics Bureau of Japan — Labour Force Survey, 長期時系列表2 (annual averages) | 2006-2025 | Official |
|---|
published/life_expectancy_mhlw.csv | Reviewed 2026-10-23; byte-identical to the staged publisher sidecar. | MHLW — Abridged Life Tables 2025 (簡易生命表), year series 参考資料2, plus census-year abridged and complete tables | 2006-2025 | Official |
|---|
published/monetary_base_boj.csv | Reviewed 2026-10-23; byte-identical to the staged publisher sidecar. | Bank of Japan — MD01 MABS1AN11 (monetary base, average amounts outstanding) | 2006-2026 | Official |
|---|
published/naturalisation_moj.csv | Reviewed 2026-10-23; byte-identical to the staged publisher sidecar. | MOJ Civil Affairs Bureau — 帰化許可申請者数、帰化許可者数及び帰化不許可者数の推移 | 2006-2025 | Official |
|---|
published/nikkei_yahoo.csv | Reviewed 2026-10-23; byte-identical to the staged publisher sidecar. | Nikkei Inc. (Nikkei Stock Average), redistributed by Yahoo Finance (^N225) | — | Other |
|---|
published/openness_wb.csv | Reviewed 2026-10-23; byte-identical to the staged publisher sidecar. | World Bank — NE.TRD.GNFS.ZS | 2006-2026 | Other |
|---|
published/population_stat.csv | Reviewed 2026-10-23; byte-identical to the staged publisher sidecar. | Statistics Bureau of Japan — Population Estimates (人口推計), long series 2000–2020 and annual 1 October estimates | 2006-2024 | Official |
|---|
published/population_wb.csv | Reviewed 2026-10-23; byte-identical to the staged publisher sidecar. | World Bank — SP.POP.TOTL | 2006-2026 | Other |
|---|
published/poverty_mhlw.csv | Reviewed 2026-10-23; byte-identical to the staged publisher sidecar. | MHLW — Comprehensive Survey of Living Conditions 2025 (国民生活基礎調査), 表11 貧困率の年次推移 (09.xlsx) | 2006-2024 | Official |
|---|
published/projection_ipss.csv | Reviewed 2026-10-23; byte-identical to the staged publisher sidecar. | IPSS — Population Projections for Japan (2023), 2021–2070 | 2020-2070 | Official |
|---|
published/rates_boj.csv | Reviewed 2026-10-23; byte-identical to the staged publisher sidecar. | Bank of Japan — Time-Series Data Search API, FM02 STRACLUCON / FM01 STRDCLUCON / IR01 MADR1M | 2006-2026 | Official |
|---|
published/reer_boj.csv | Reviewed 2026-10-23; byte-identical to the staged publisher sidecar. | Bank of Japan — FM09 FX180110002 (real effective exchange rate, CY2020=100) | 2006-2026 | Official |
|---|
published/reserves_mof.csv | Reviewed 2026-10-23; byte-identical to the staged publisher sidecar. | MOF — 外貨準備等の状況 (International Reserves/Foreign Currency Liquidity), historical.csv | 2006-2026 | Official |
|---|
published/reserves_wb.csv | Reviewed 2026-10-23; byte-identical to the staged publisher sidecar. | World Bank — FI.RES.TOTL.CD (IMF IFS) | 2006-2026 | Other |
|---|
published/tax_revenue_mof.csv | Reviewed 2026-10-23; byte-identical to the staged publisher sidecar. | MOF — 一般会計税収の推移 (general-account tax revenue since FY1979) | — | Official |
|---|
published/trade_customs.csv | Reviewed 2026-10-23; byte-identical to the staged publisher sidecar. | Japan Customs (MOF) — 普通貿易統計, 輸出入総額の推移 (d41ca annual, d41ma monthly) | 2006-2026 | Official |
|---|
published/trade_partners_customs.csv | Reviewed 2026-10-23; byte-identical to the staged publisher sidecar. | Japan Customs — 国別・地域別 輸出 (d52caNNN) / 輸入 (d62caNNN) annual series by commodity | 2006-2025 | Official |
|---|
published/usdjpy_boj.csv | Reviewed 2026-10-23; byte-identical to the staged publisher sidecar. | Bank of Japan — FM08 FXERM07 (USD/JPY 17:00 JST, monthly average), FXERM06 (end of month) | 2006-2026 | Official |
|---|
published/vital_mhlw.csv | Reviewed 2026-10-23; byte-identical to the staged publisher sidecar. | MHLW — Vital Statistics 2025 final (人口動態統計 確定数), 第2表/第3表 人口動態総覧の年次推移 | 2006-2025 | Official |
|---|
security/homicide_deaths_from_mhlw.csv | Deaths certified as homicide, Japanese nationals in Japan, by year of death, total / male / female. Verified 2025 = 211, 2024 = 222. Read from the… | MHLW — Vital Statistics, cause 20300 他殺 (assault) | 2006-2025 | Official |
|---|
security/homicide_police_from_npa.csv | One CSV per year (Shift_JIS, ~228KB, table 1 = recorded and cleared offences by type vs previous year), linked from the year index… | National Police Agency — 犯罪統計 (crime statistics), 刑法犯 罪種別 認知・検挙件数, 殺人 | 2006-2025 | Official |
|---|
security/homicide_rate_from_wb.csv | Verified 2006 0.48 → 2023 0.23 (non-null to 2023). The comparable; on UNODC's definition, not either national one. | World Bank — VC.IHR.PSRC.P5 (UNODC intentional homicides per 100,000) | 2006-2026 | Other |
|---|
social/gini_from_oecd.csv | Verified on METH2012 / total population: Gini 2018 0.334, 2021 0.338; poverty (50% line) 2018 15.7, 2021 15.4. Built from the same MHLW survey… | OECD Income Distribution Database (DF_IDD), REF_AREA=JPN | 2006-2021 | Other |
|---|
social/gini_from_wb.csv | Sparse: non-null 2008–2020 only (2020 = 32.3). Kept as the cross-country comparable; the national figure is MHLW's. | World Bank — SI.POV.GINI | 2006-2026 | Other |
|---|
social/labour_from_stat.csv | lt02.xlsx (listing: https://www.e-stat.go.jp/stat-search/files?tclass=000001226526&cycle=0, table 2-1), 1953–2025, units 万人 (TEN THOUSAND persons)… | Statistics Bureau of Japan — Labour Force Survey, 長期時系列表2 (annual averages) | 2006-2025 | Official |
|---|
social/poverty_from_mhlw.csv | CORRECTED at consolidation: read from the edition's xlsx (09.xlsx, 表11, linked from the k-tyosa25 index; the edition is resolved from… | MHLW — Comprehensive Survey of Living Conditions 2025 (国民生活基礎調査), 表11 貧困率の年次推移 (09.xlsx) | 2006-2024 | Official |
|---|
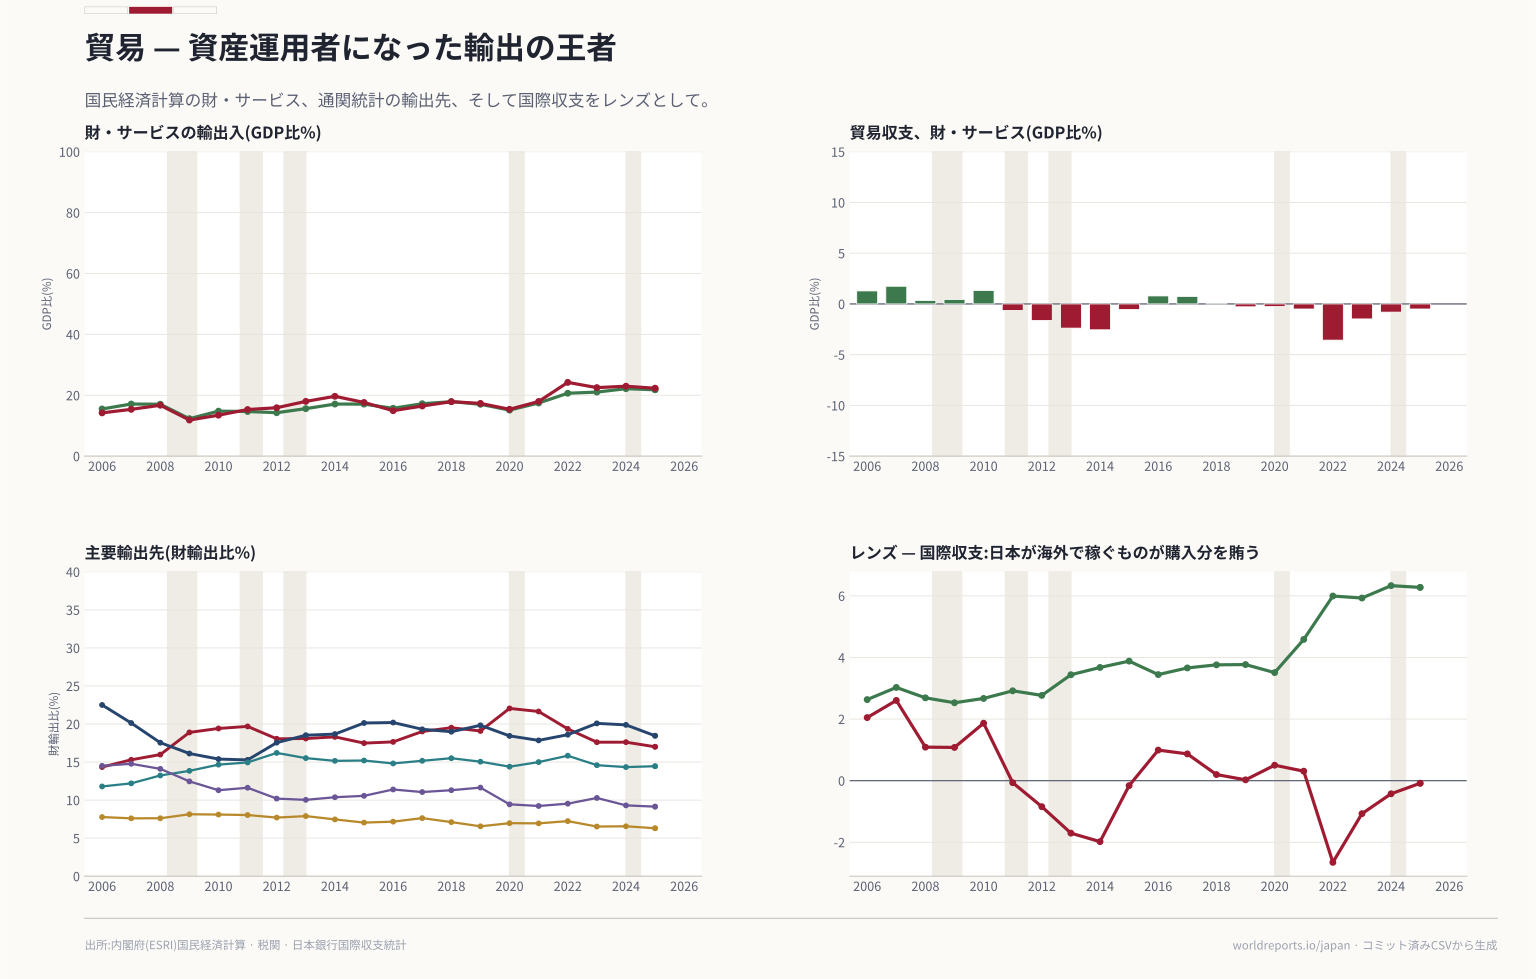
trade/current_account_from_boj.csv | Current account net balance, monthly, ¥100 MILLION; verified CY2024 sum ¥29.28tn, CY2025 ¥32.24tn. Primary income (overseas investment returns) is… | Bank of Japan / MOF — Balance of Payments (BPM6), BP01 BPBP6JYNCB | 2006-2026 | Official |
|---|
trade/trade_from_customs.csv | Goods exports and imports, customs basis, ¥ THOUSAND (千円), Shift_JIS, 4-line header, values with trailing spaces. Verified CY 2006 X 75,246,173,392 /… | Japan Customs (MOF) — 普通貿易統計, 輸出入総額の推移 (d41ca annual, d41ma monthly) | 2006-2026 | Official |
|---|
trade/trade_partners_from_customs.csv | One file per partner and direction, index on https://www.customs.go.jp/toukei/suii/html/time.htm: 001 USA, 002 EU, 003 Asia, 004 China, 005 Korea… | Japan Customs — 国別・地域別 輸出 (d52caNNN) / 輸入 (d62caNNN) annual series by commodity | 2006-2025 | Official |
|---|
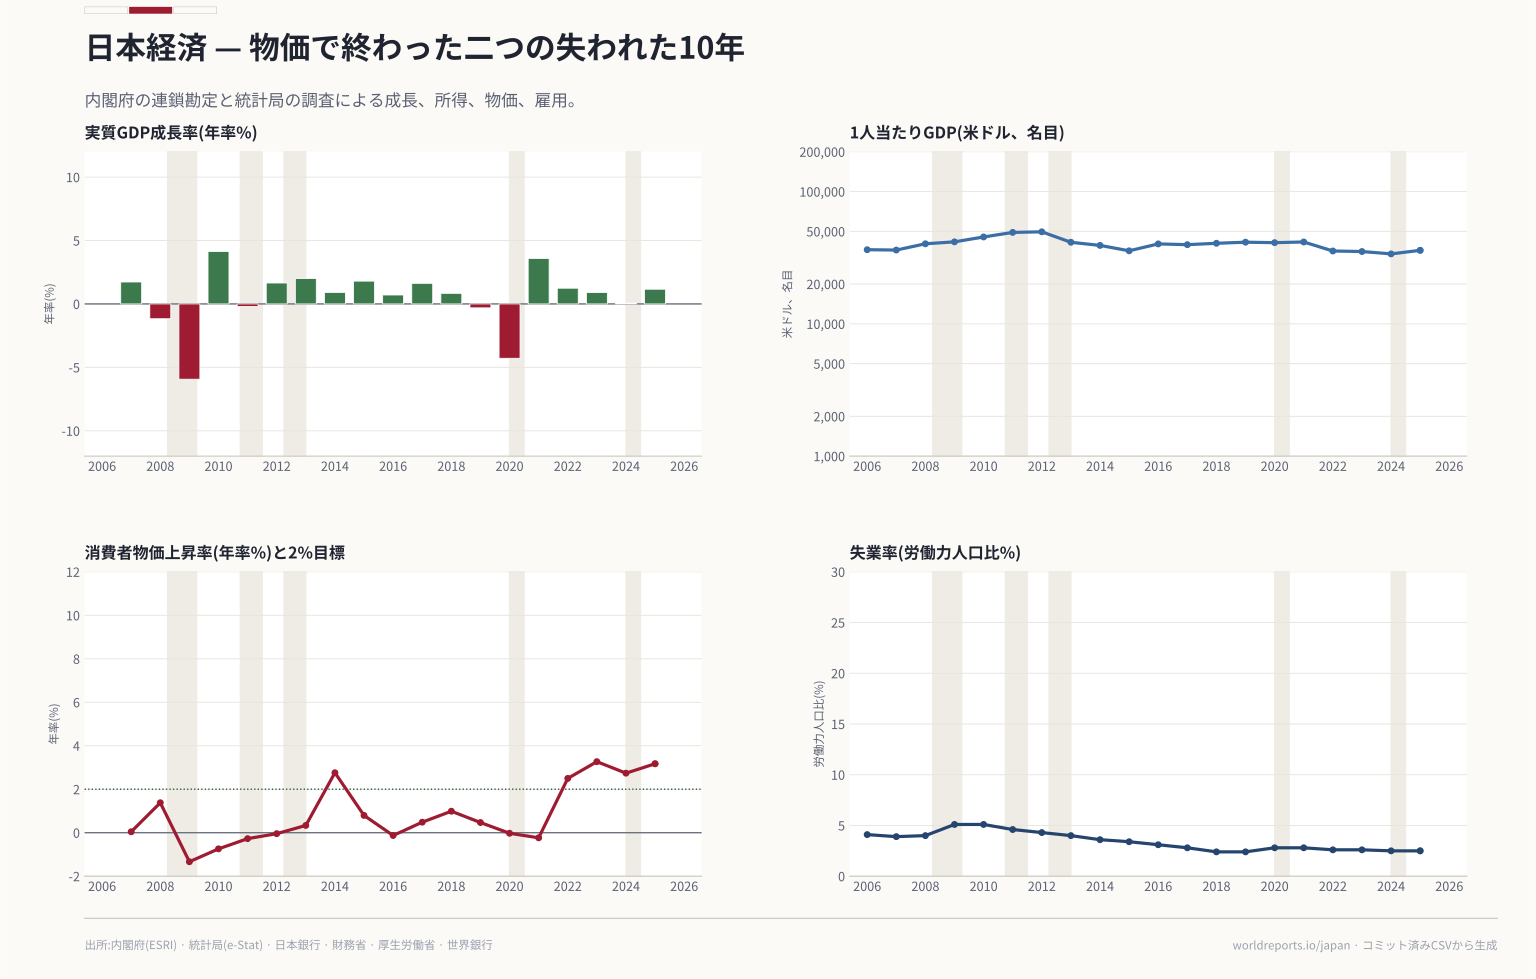 Plate 01